


close
keyboard_arrow_left
Table of Contents
- play_arrow 开始使用
- play_arrow 交换机配置
- 交换机配置概述 (Mist)
- 将交换机载入 Mist 云
- 配置交换机
- 交换机配置选项
- 通过 Mist 在交换机上配置 BGP
- 通过 Mist 在交换机上配置路由策略
- 路由引擎保护
- QoS 配置
- 在交换机上配置 SNMP
- 在交换机上配置 DHCP 服务器或中继
- 通过 Mist 在交换机上配置网桥优先级
- 交换机的 OSPF 配置
- 管理或更新配置设置
- 升级交换机上的 Junos OS 软件
- 为交换机创建恢复快照
- 为交换机分配角色
- 通过 LED 定位交换机
- 更换交换机
- 禁用对交换机和网关设备的远程 Shell 访问
- 使用 Cloudx 通过代理服务器将交换机连接到 Mist 云
- 配置系统日志
- 从库存中释放交换机
- play_arrow 交换机仪表板
- play_arrow 虚拟机箱配置
- play_arrow 园区交换矩阵配置
- play_arrow 故障 排除
- play_arrow 附录
list Table of Contents
keyboard_arrow_right
有线 SLE 仪表板
date_range
07-Oct-24
总结 开始使用有线服务级别体验 (SLE) 仪表板来评估服务级别,以影响用户的因素,例如吞吐量、连接和交换机运行状况。
™ Juniper Mist云持续收集网络遥测数据,并使用机器学习来分析最终用户体验。您可以通过Juniper Mist有线服务级别预期 (SLE) 仪表板访问这些信息,这有助于您评估网络的用户体验并主动解决问题。有线 SLE 仪表板可显示网络上有线客户端在任何给定时间点的用户体验。您可以使用这些交互式仪表板,在用户痛点成为棘手问题之前识别它们,从而主动测量和管理您的网络。
查找有线 SLE 仪表板
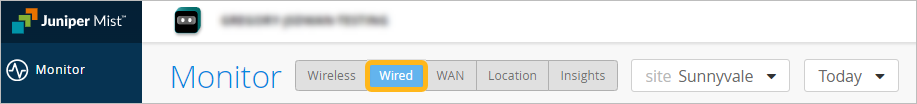
要查找有线 SLE 仪表板,请从左侧菜单中选择 “监控 > 服务级别 ”,然后单击“ 有线 ”按钮。
注意:
仅当您拥有所需的订阅时,才会显示这些按钮。有关这些要求的信息,请参阅 Juniper Mist人工智能原生运维指南。
