
Switch Details
Get familiar with the information and troubleshooting tools that you can find on the Switch Details page.
The switch details page is your ultimate go-to place on Mist for everything you need to know about a switch. You can view the status of each port and the statistics of the devices connected to the switch, access the switch configuration, review and modify the configuration, and track how the switch is performing against key metrics that matter to you.
The switch details page also has the tools that help you with switch testing and troubleshooting.
Finding the Switch Details Page
From the left menu, select Switches. Then click a switch in the list.
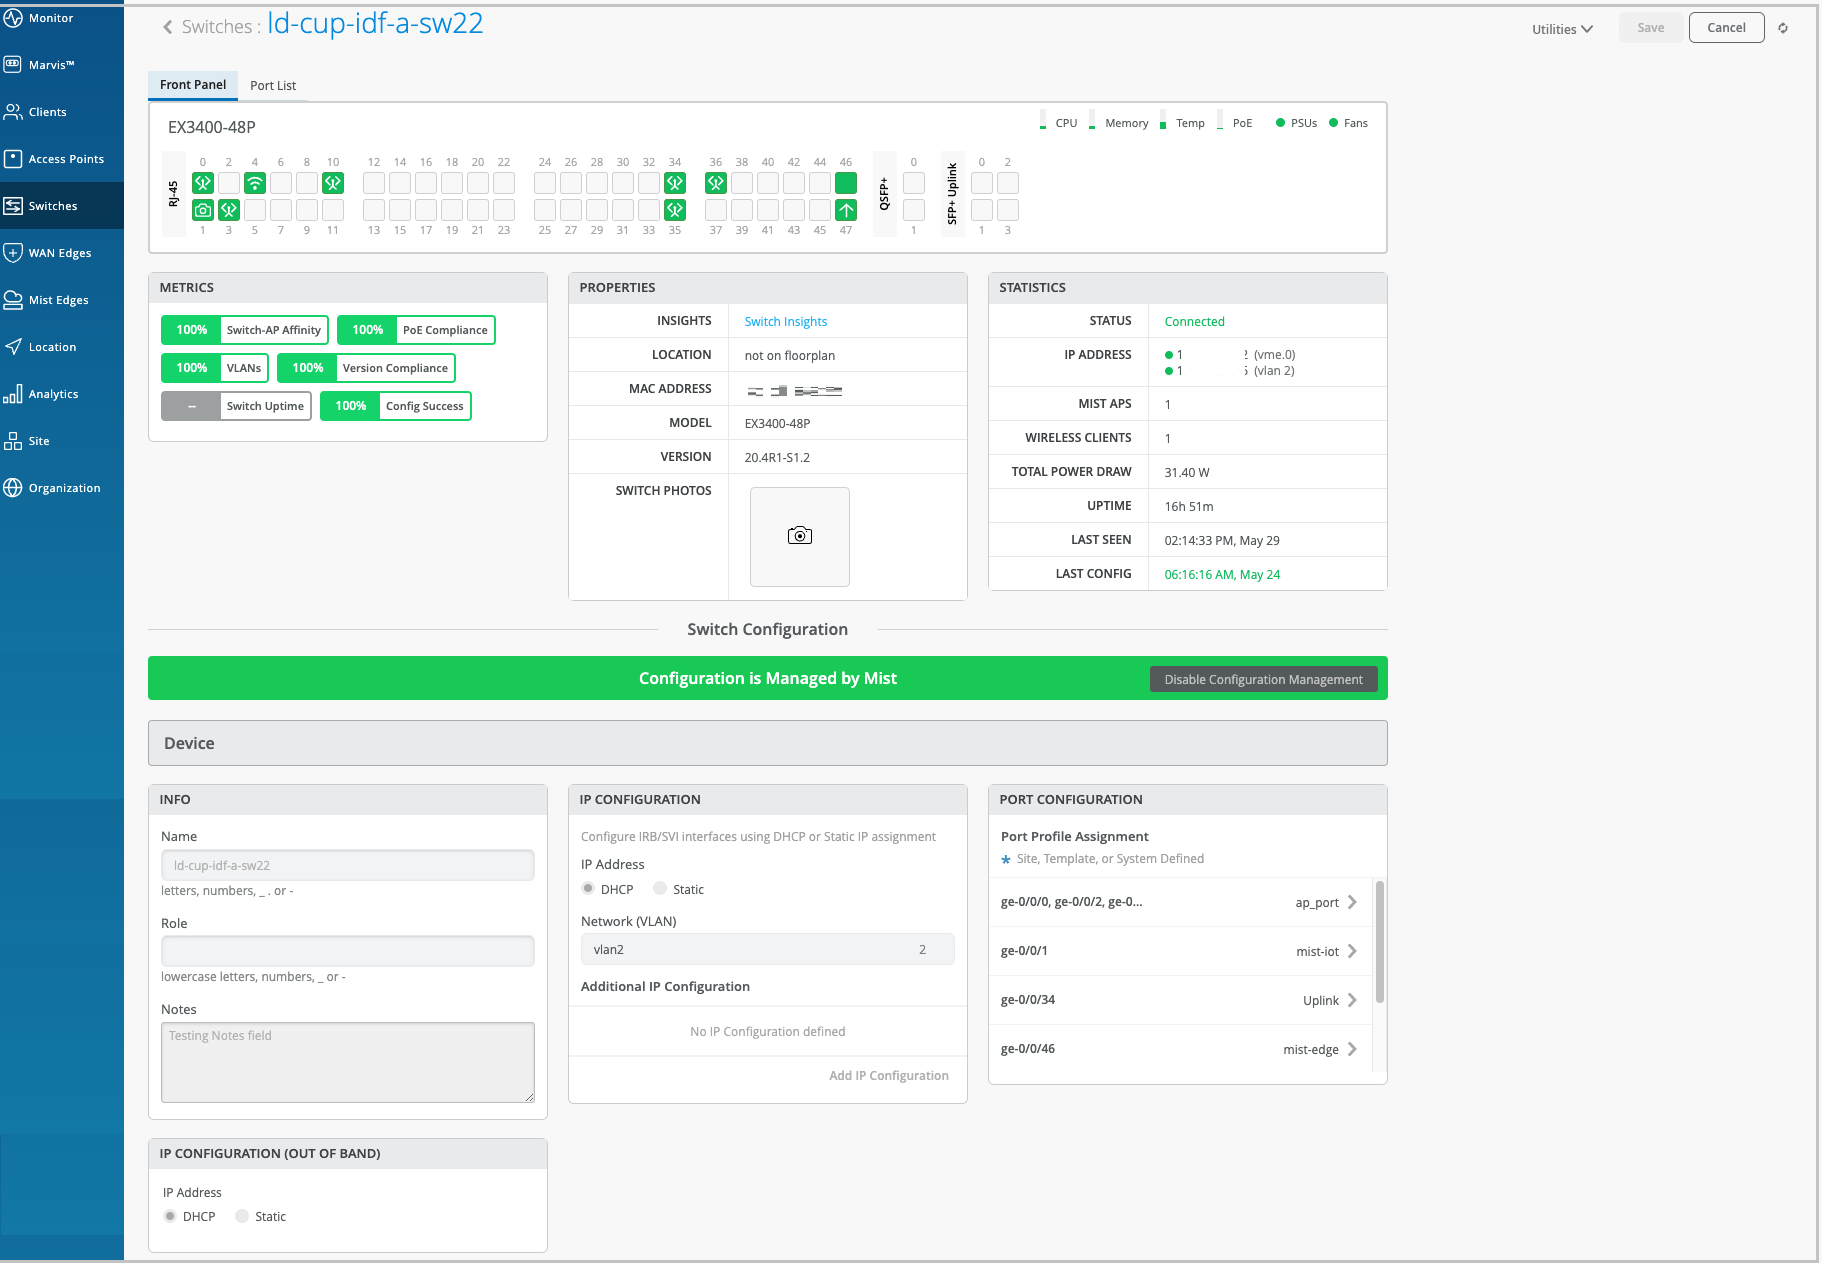
Here's an example of the details page of a switch named ld-cup-idf-a-sw22.
Front Panel
When you open a switch details page, you'll find yourself on the Front Panel tab. This tab gives you a comprehensive overview of the switch's port panel.
The front panel view varies depending on whether the device is a standalone switch, a Virtual Chassis device, or a CX VSF (Virtual Switching Framework) platform.
In this Front Panel view, you get a logical representation of the switch's ports. You can view the port status, port configuration, and the clients or APs connected to each port. The following image represents a sample Front Panel.

The port icons on the Front Panel view help you quickly identify the client devices or APs connected to each port and their status. The following table lists the key port icons and their descriptions:
| Port Icon | Description |
|---|---|
 |
The port is empty. No device is connected. |
 |
A wired client is connected. |
 |
A wired client is connected (trunk port). |
 |
A Mist AP is connected. |
 |
A camera is connected. This icon applies only to Verkada cameras. |
 |
Virtual Chassis port (VCP). A member device is connected. |
 |
The port is up. Sometimes, when a switch port is learning multiple MAC addresses on the same interface, the switch cannot identify which device is connected to the port. When that happens, the Mist portal might not display the connected device as a wired client, even though the port icon stays solid green. However, if the connected device has LLDP enabled, the portal identifies which device is connected to the port. |
 |
The port is empty, with active alerts. |
 |
A wired client is connected, but the port has active alerts. |
 |
A Mist AP is connected, but the port has active alerts. |
 |
An uplink is connected. But the port has active alerts. |
 |
The port is administratively disabled by a user. |
- Port View
- Marvis Actions
- Sensors
- Digital Optical Monitoring Chart (EX and QFX Series Switches)
- Live Traffic Counters
- Switch Processes
Port View
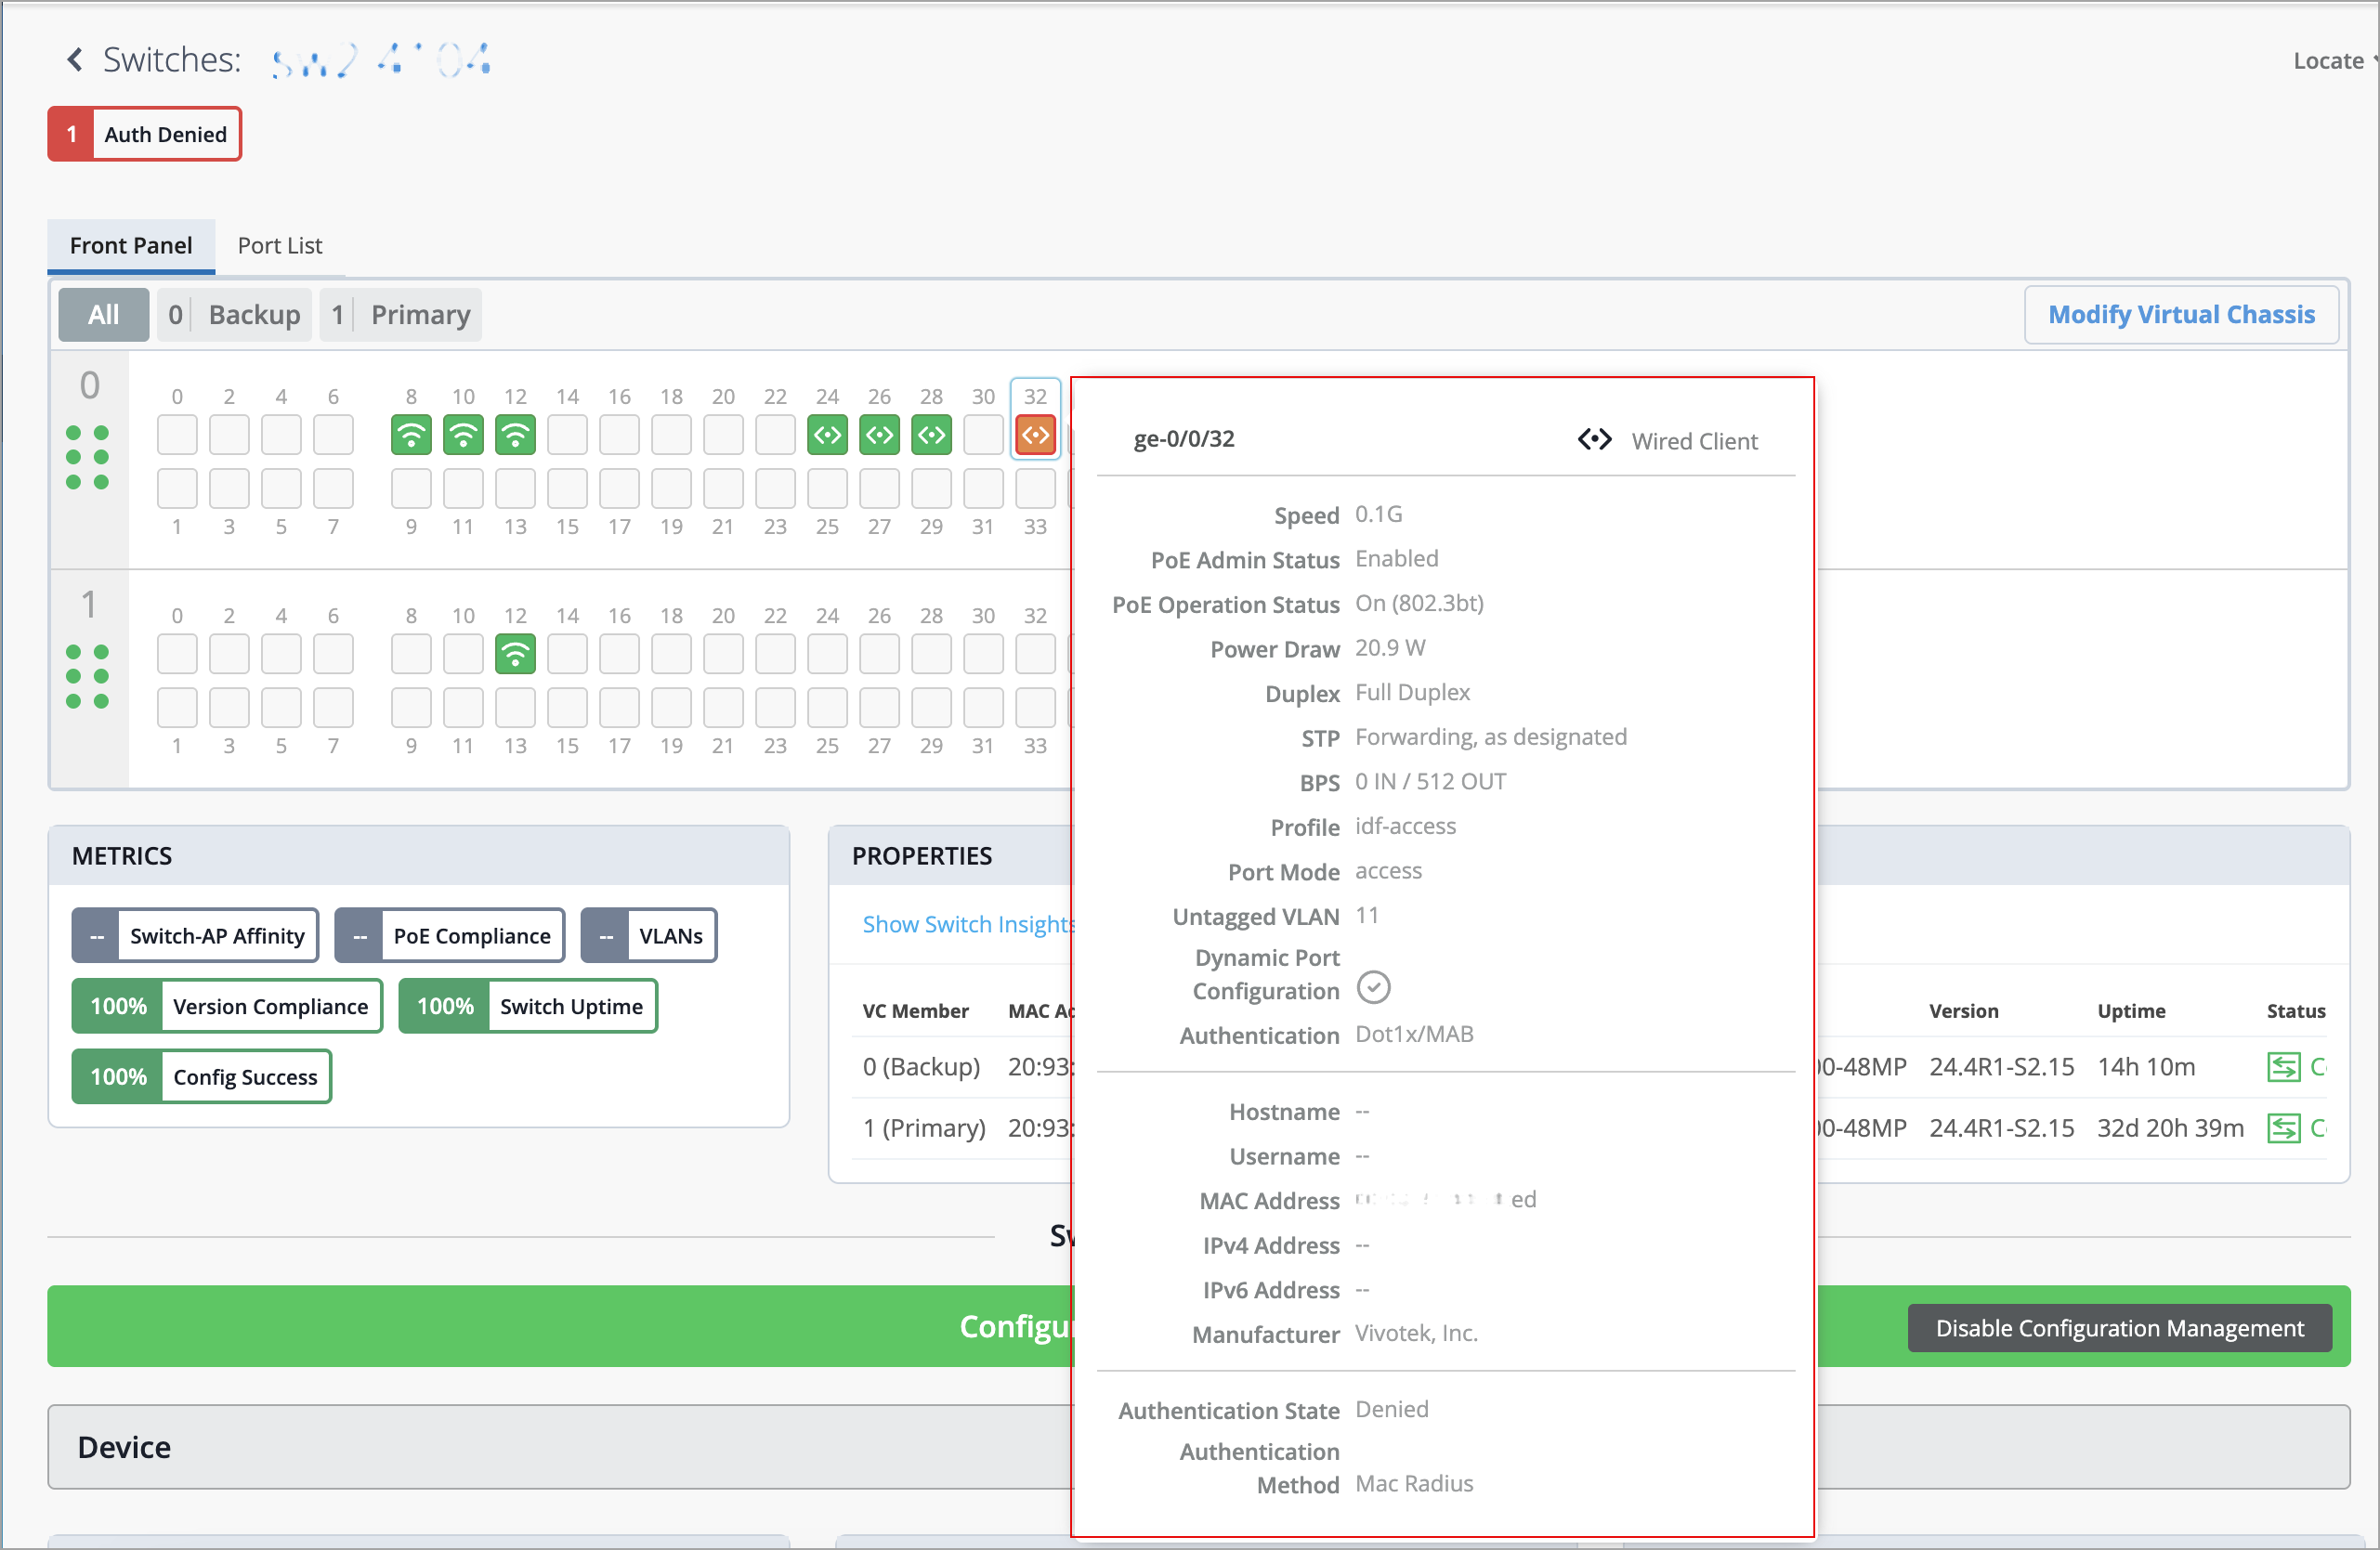
For a sneak peek into what's happening on a specific port, simply hover your mouse over the port. You can view the type of device connected to the port, the port speed, power settings, IP address, authentication status, authentication method, and much more.
Here's an example of what you might see if you hover over port ge-0/0/32:
To get a more detailed view of what's going on with a port, click that port to select it. When you select a port from the front panel, the following happens:
-
If you select multiple ports, the configuration page displays the Port Configuration, Networks, and Port Profiles tiles with the settings applied to the selected ports. You can make configuration adjustments to the ports from these tiles. If the selected ports do not have any configuration, the Port Configuration, Networks, and Port Profiles tiles are displayed without any data.
-
If you select only a single port, the configuration page additionally displays port Statistics and Wired Client insights. From the Wired Client insights tile, you can access the connected devices.
From the detailed view of the port, you can also bulk edit the port configuration, perform cable tests, bounce (restart) the port in case you encounter any issues with it, and clear MAC addresses stored through persistent MAC learning.
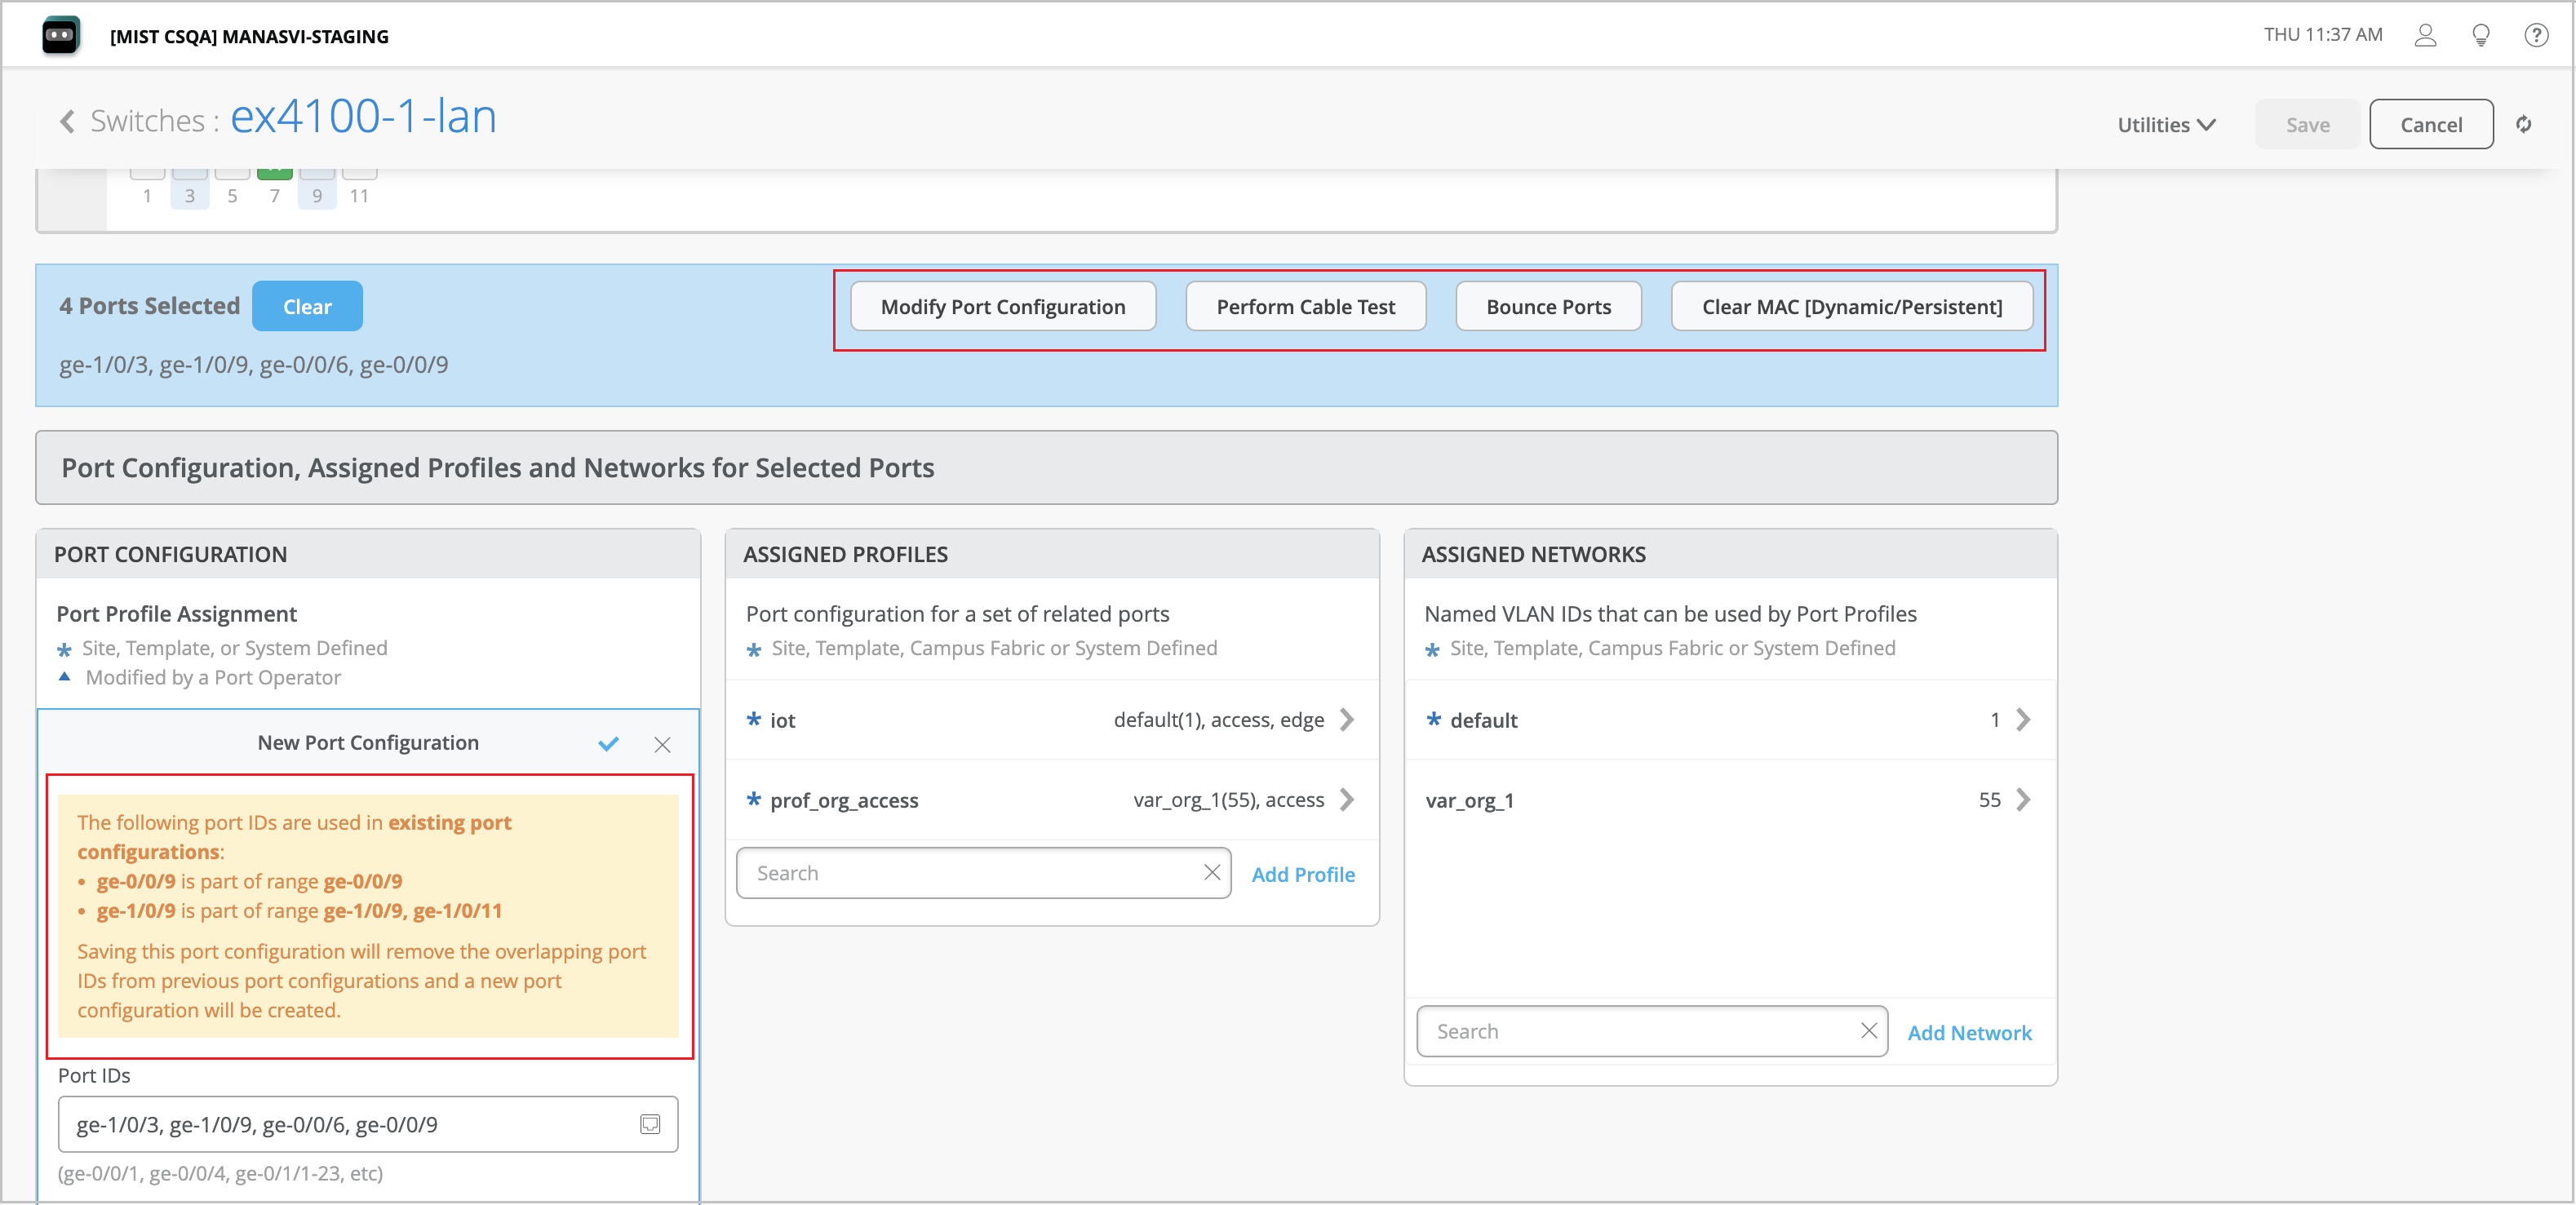
To bulk edit your port configuration or override any existing port configuration on a switch, select the ports to be configured from the Front Panel on the switch details page, and click Modify Port Configuration (shown in the above picture). In case the selected ports are already part of an existing port range configuration, a warning message indicating the same is displayed. When you save the new configuration, it will replace the existing configuration for the selected ports. Previously, you had to manually remove any port configuration overlap before you carry out a bulk port edit.
Marvis Actions
View and manage Marvis Actions reported for a switch.
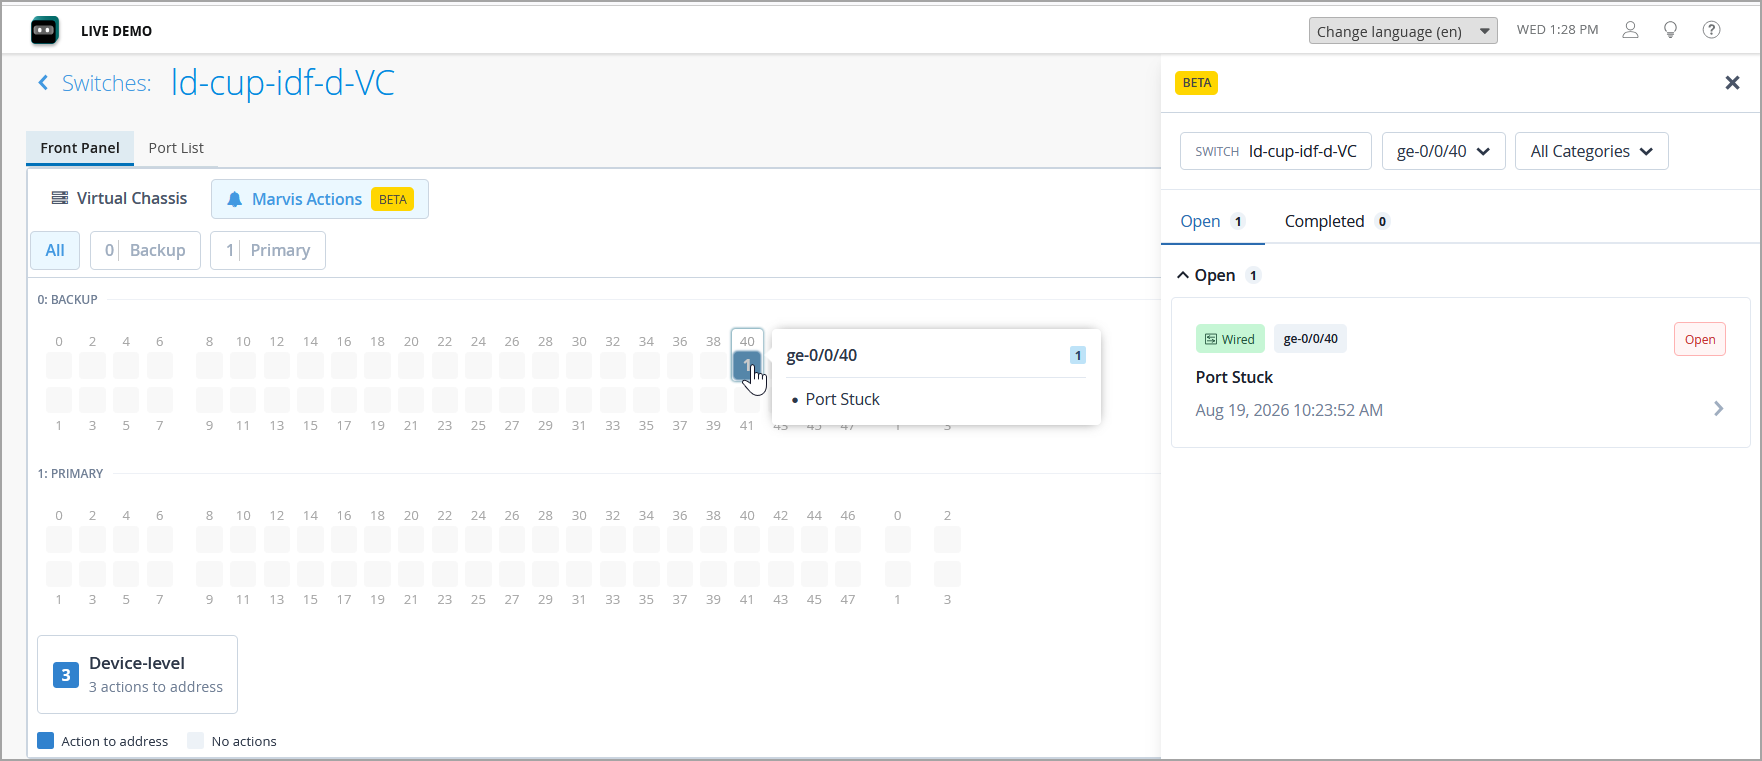
When you select the Marvis Actions overlay on the front panel, ports with active Marvis Actions are highlighted along with the action count per port. Hovering over a port displays a summary of the active port-level actions for that port, and clicking the port opens a sidebar with detailed root-cause insights and available remediation workflows. Device-level actions, such as switch offline, high CPU or memory utilization, and switch-wide configuration issues, are not tied to a specific port and are displayed separately in the sidebar outside the front panel port context.
The following user roles can view Marvis Actions on the switch details page with an active Wired Marvis subscription: Super User, Network Admin, Helpdesk, and Observer.
For all Marvis Actions supported by switches, refer to Wired Actions.
Sensors
Juniper switches include a variety of sensors to measure CPU, memory, temperature, power draw, power supply, and the cooling fans for each tray. Red/Yellow/Green indicators show the overall health, or you can hover over an indicator to show a detailed list. Red indicates a failure, or a value is in the critical range. Yellow is a warning, typically because a value is approaching a critical level. Greens means OK. Figure 1 shows the temperature for each monitored component on the switch.
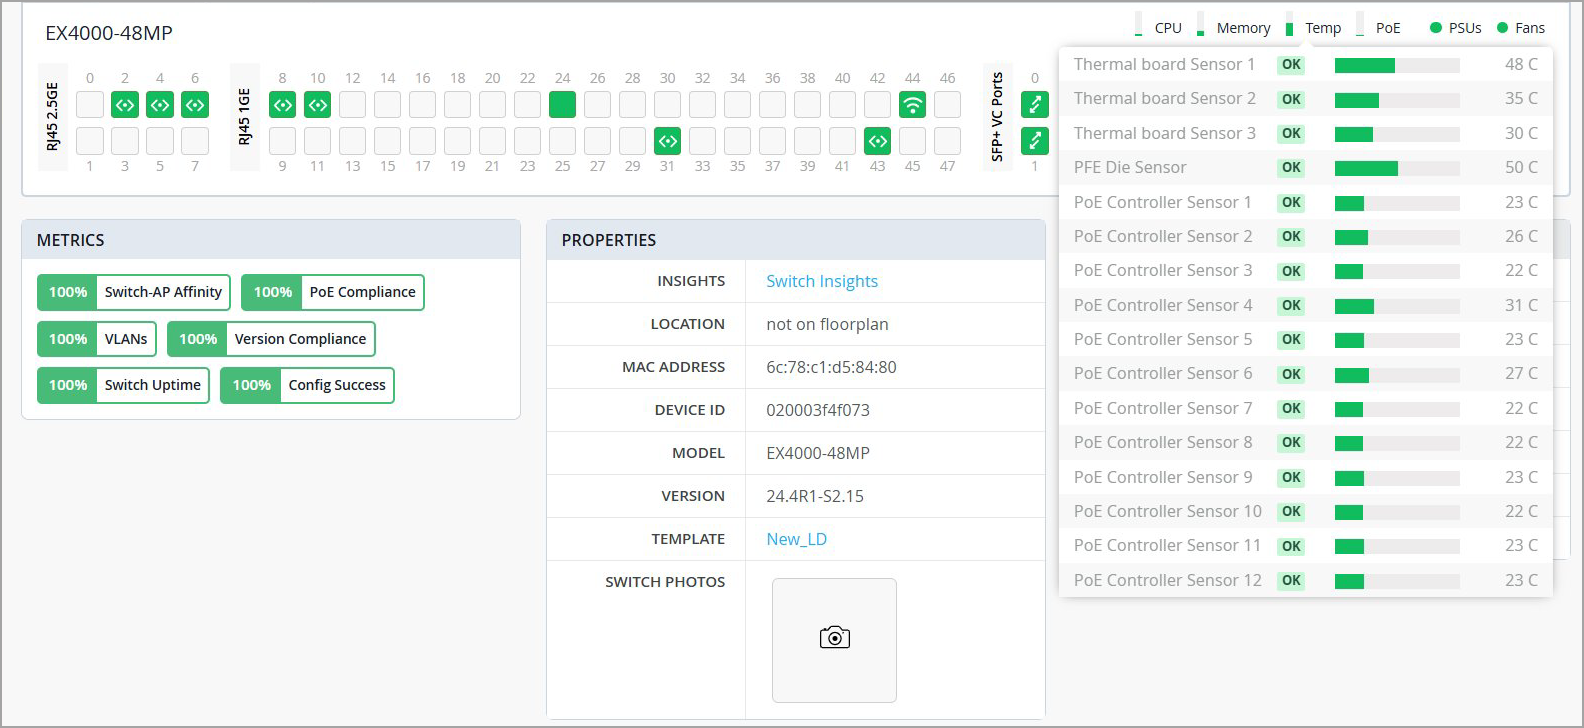
Likewise, you can hover over the PSU indicator to see the status of each power supply on the switch. Green indicates the power supply is present and working properly. Red indicates insufficient power, or failure. Gray means the power supply is not present. Yellow indicates the power supply is initializing.
Digital Optical Monitoring Chart (EX and QFX Series Switches)
When you select fiber optics ports from the Front Panel, this chart appears. It displays five port properties:
-
Rx Power
-
Tx Power
-
Voltage
-
Current
-
Temperature
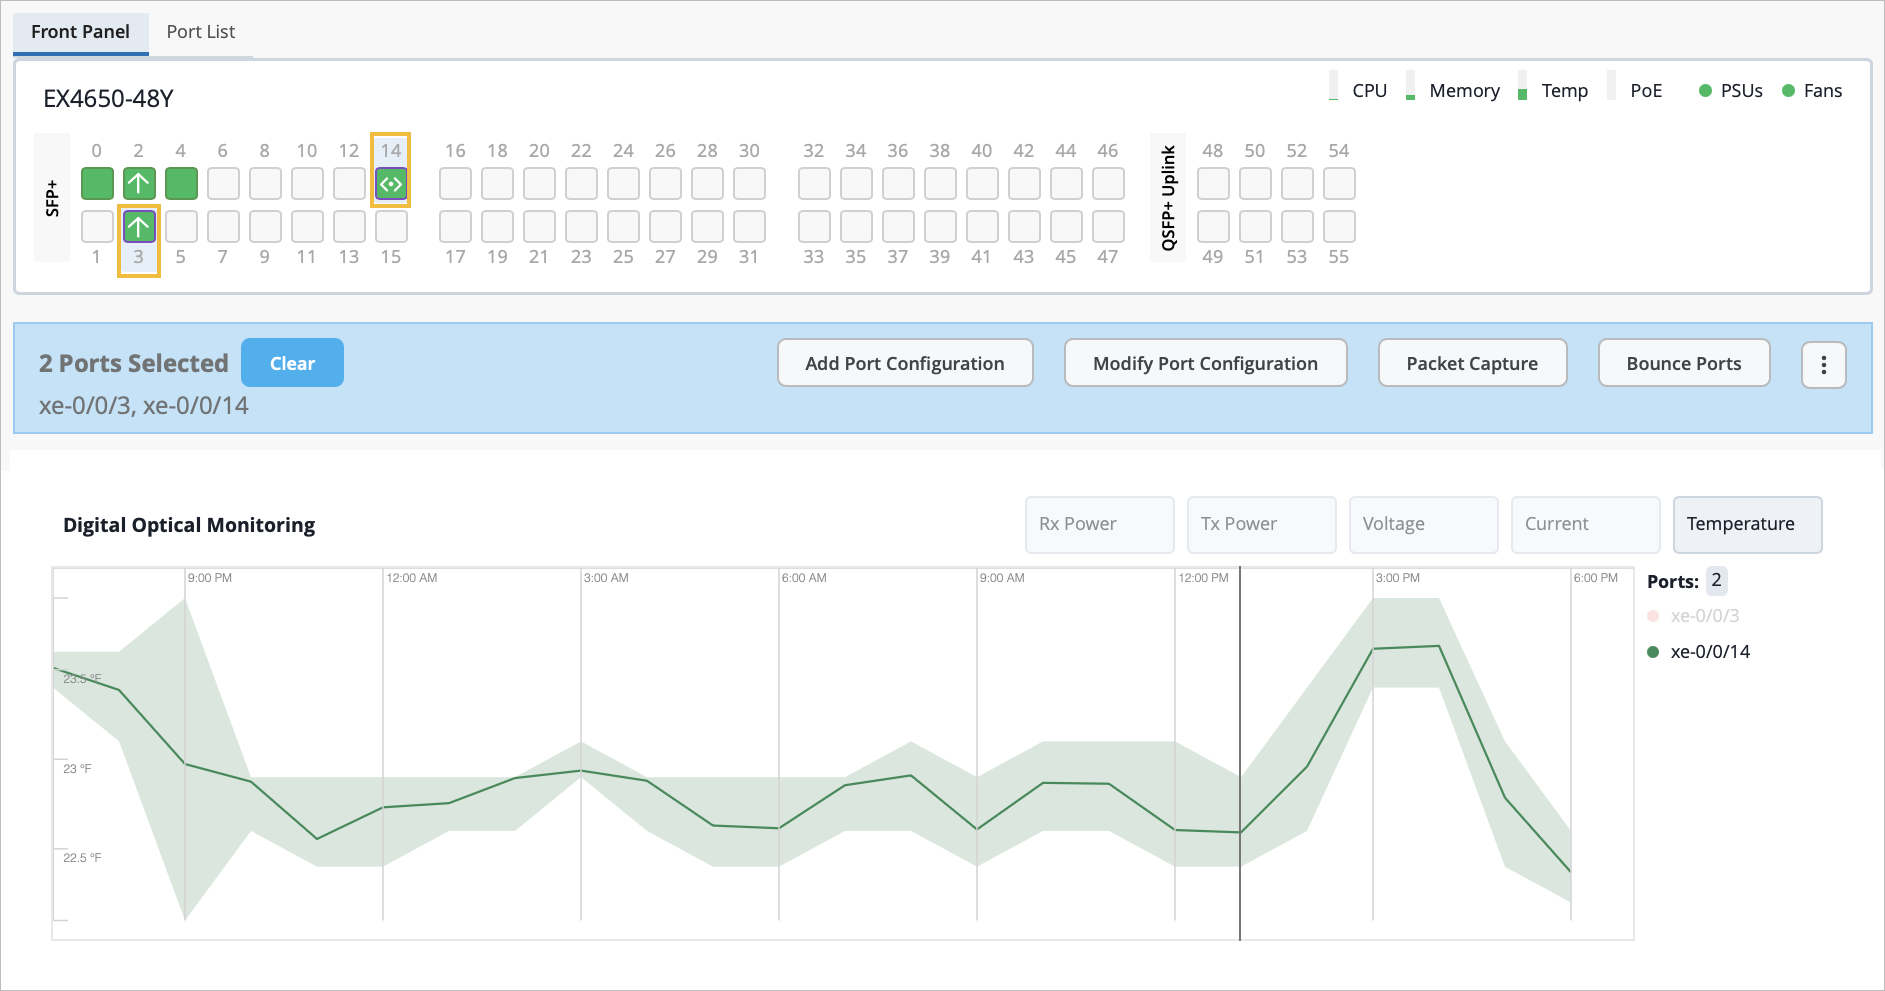
Tips for using this chart:
-
Property buttons—Use the buttons at the top-right corner of the chart to select a property to view. For example, click the Temperature button to see temperature variations across the displayed time period.
-
Port list—If you selected multiple ports from the Front Panel, use the port list on the right side of the chart to select a port to view.
Live Traffic Counters

Users with Super User or Network Admin privileges can get real-time statistics for a given switch interface by selecting the switch and then drilling down on the port. Traffic statistics include input and output, L2 and L3 errors, and BUM traffic, and are available on all EX series and QFX series switches with an active Wired Assurance license.
Switch Processes

You can get real-time statistics for the processes running on a given switch by selecting the switch and then drilling down to the switch Insights page, then clicking the View Live Process Detail button.
Port List
To see a list of all the ports, click the Port List tab. In the Port List view, details include port name, status, connected clients, power draw, port profile, port mode, port speed, and data transmitted and received. For details on a given client, click the name hyperlink. The column headers and the Port column are locked to remain stationary when you scroll.
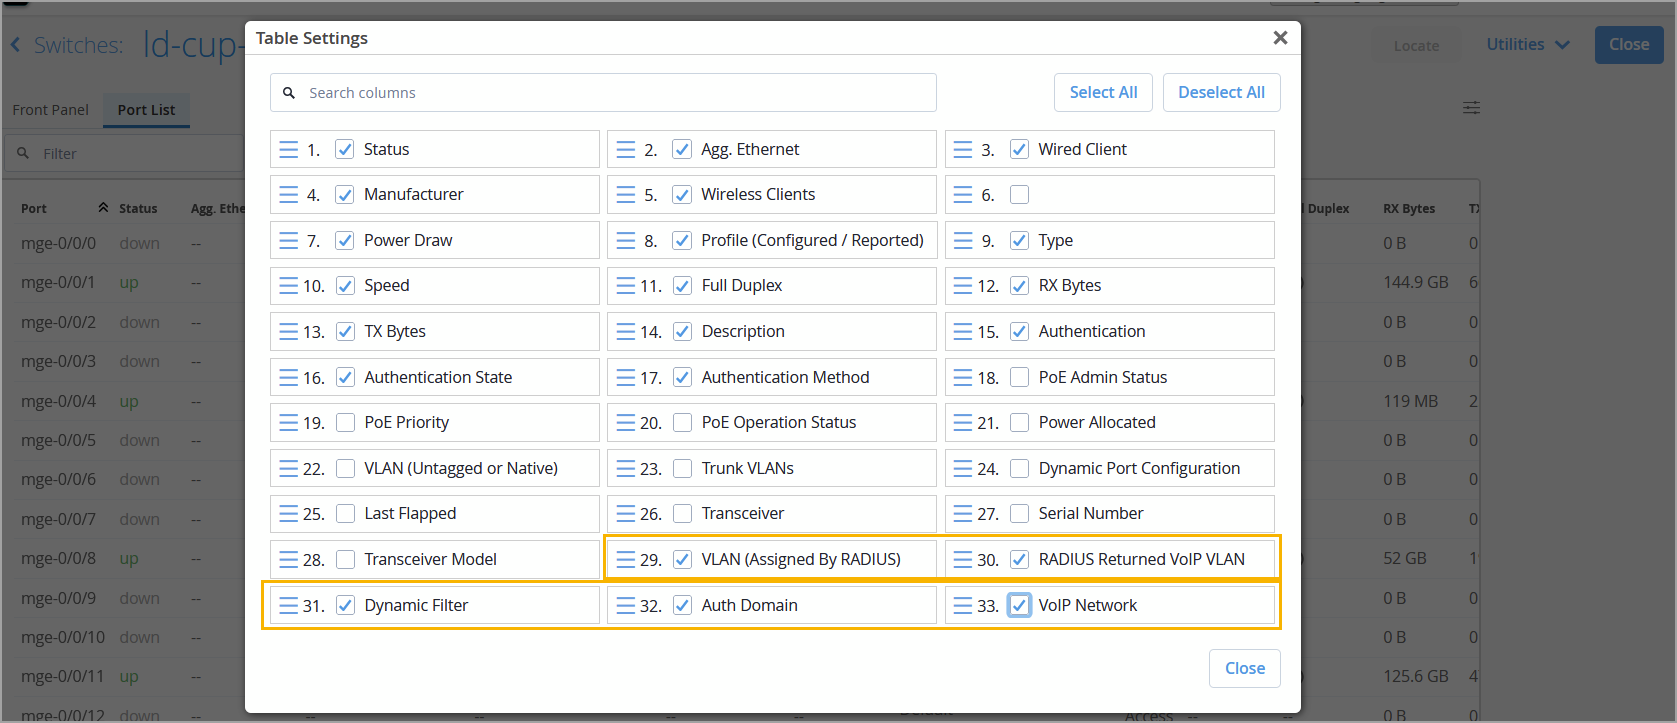
You can select which columns to display in the Port List view by clicking the hamburger menu in the upper right of the page. In Table Settings, select the port parameters you want to show.
-
Filter option—Use this search field to find switch port details, including those that are unlisted, but available in the Table Settings.
-
VoIP Network—Shows the VoIP VLAN configured on the port profile bound to the port.
Note that this column is not applicable to the Wired Clients view.
-
VLAN (Assigned By RADIUS)—Shows the VLAN ID that the RADIUS server dynamically returned during client authentication.
-
RADIUS Returned VoIP VLAN—Shows the VoIP VLAN that the RADIUS server dynamically returned for a wired client or port during authentication.
-
Dynamic Filter—Shows the name of a firewall filter (ACL) dynamically applied to the switch port during authentication. This filter is typically returned by the RADIUS server.
-
Auth Domain—Shows the authentication domain used for the client or port.
Switch Insights
If you want to gain valuable insights into your switch, the events such as switch configuration changes, performance, and connected endpoints, visit the Switch Insights page by clicking the Switch Insights hyperlink on the Properties tile.
You can also go to the Switch Insights page by using the hyperlink on the main Switches page.
Switch Insights gives you a bird's-eye view of all the switch events that have taken place. It's like a log of configuration changes, software updates, and system alarms.
Switch Insights also lets you track some important metrics like CPU and memory utilization of the switch. You can also dive into details about BGP neighbors (applicable to campus fabrics). You can also view traffic patterns, port errors, and power draw at the switch or port level.
The key sections on the Switch Insights page are the following:
-
Switch Events—Provides a log of all the switch events reported. You can filter good, neutral, and bad events. The event type filter in the Switch Events section allows users to include or exclude specific event types. Users can easily filter out high-frequency, low-value events and focus on more relevant operational data.
Table Capacity—Provides the following indicators:
-
MAC Address Table—Displays the percentage of the MAC address table capacity used. The MAC address table contains MAC Address-interface bindings associated with each VLAN.
-
ARP Table—Displays the percentage of Address Resolution Protocol (ARP) table capacity used. The ARP table contains the learned MAC Address-IP bindings of the devices connected to the network.
-
Route Summary—Displays the percentage of routing table capacity used.
-
EVPN Database—Available for switches that are part of an EVPN topology.
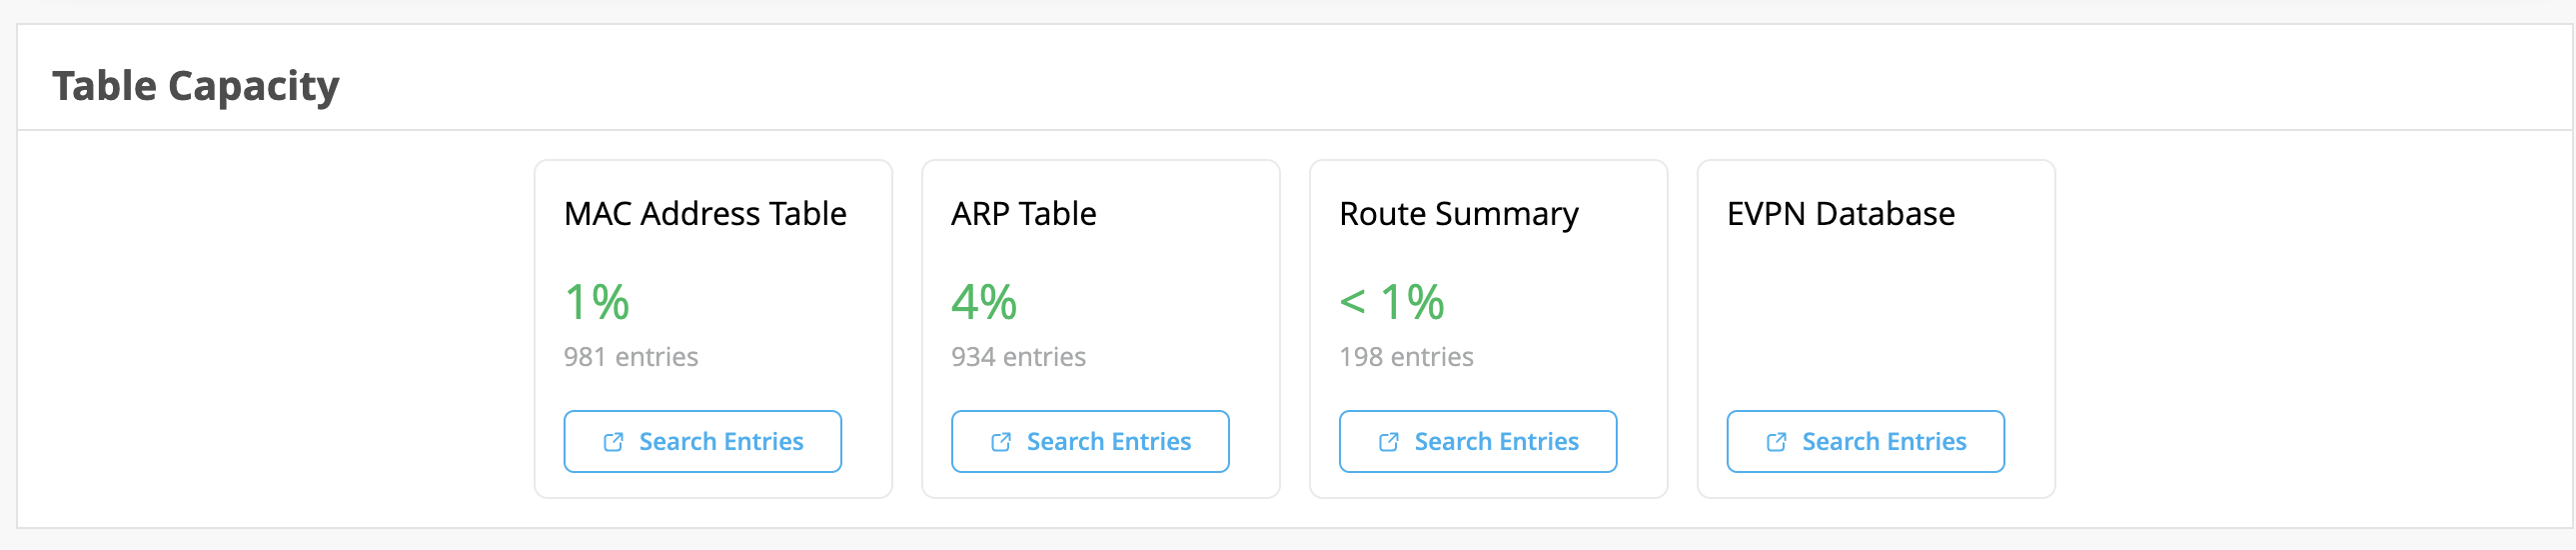
You can click the Search Entries button under each metric to open a shell view in a new window where you can search for entries after specifying filters. You also have the option to refresh and clear the entries displayed. Clicking Refresh on the upper right of the window provides a continuous display of the entry every three seconds for a total of 30 seconds. To stop the refresh before the 30-second timer is complete, close the window or click another table. Clicking the Clear Entry button, which is available only for MAC and ARP table, clears the respective entry from the table. You also have the option to clear the buffer on the screen by clicking Clear Screen at the lower left of the window.
-
-
BGP Summary—Displays BGP neighbor details and summary information, which can be used for troubleshooting and monitoring BGP status on the switch. The data is refreshed automatically every 3 minutes. You can also refresh the data manually to retrieve the latest status. It can take about 3 to 6 minutes for any new updates to appear on the BGP Summary page after a manual refresh.

-
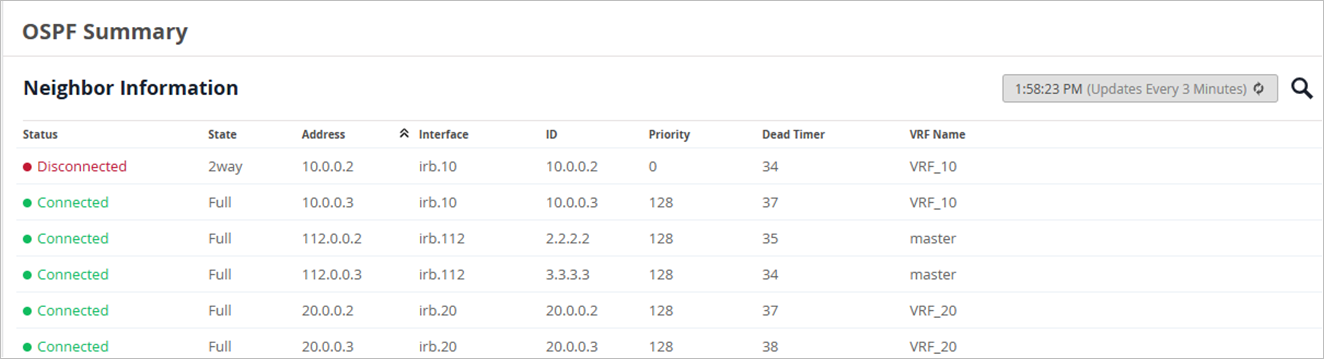
OSPF Summary—Displays near real-time status of OSPF neighbors and peers. The data is refreshed automatically every 3 minutes. You can also refresh the data manually to retrieve the latest status. It can take about 3 to 6 minutes for any new updates to appear on the OSPF Summary page after a manual refresh.
The summary is available when OSPF is enabled on the switch and at least one neighbor has established full adjacency.
-
Switch Charts—A set of charts providing insights into key metrics.
Use the drop-down menu at the top of this section to select all ports or a specific port.
Charts include:
-
CPU Utilization—Percent of CPU in use across the selected time period. Hover your mouse over any point in time to see details below the chart.
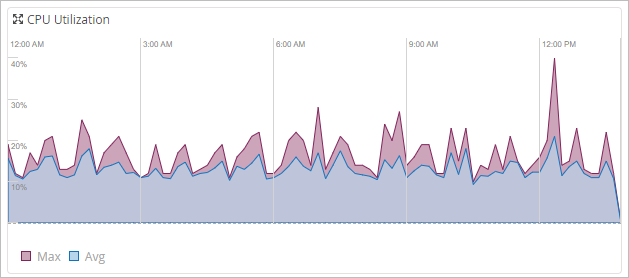
You can get real-time statistics for the processes running on a given switch by clicking the View Live Process Detail button.
-
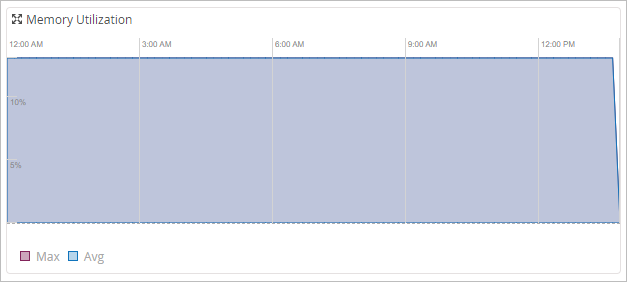
Memory Utilization—Percent of memory in use across the selected time period. Hover your mouse over any point in time to see details below the chart.
-
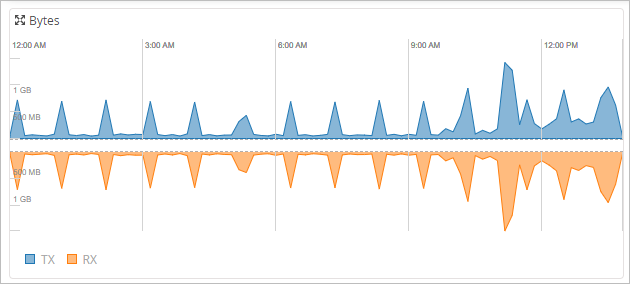
Bytes—Number of bytes transmitted (TX) and received (RX) across the selected time period. Hover your mouse over any point in time to see details in the white bar at the center of the chart.
-
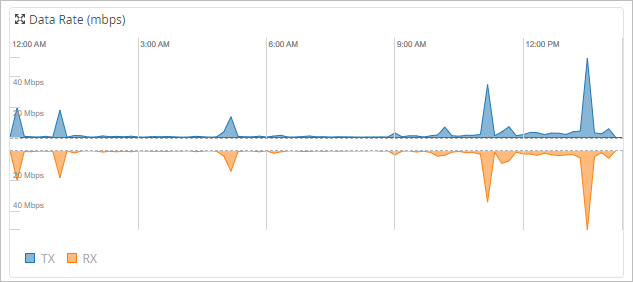
Data Rate—Transmit (TX) and receive (RX) rate (in mbps) across the selected time period. Hover your mouse over any point in time to see details in the white bar at the center of the chart.
-
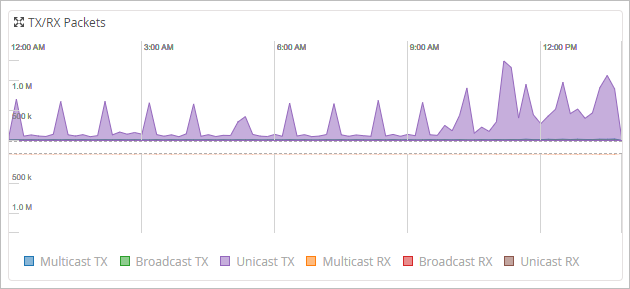
TX/RX Packets—Number of packets transmitted (TX) and received (RX) across the selected time period. Color coding shows the different types of packets (multicast, broadcast, and unicast). Hover your mouse over any point in time to see details in a pop-up description.
-
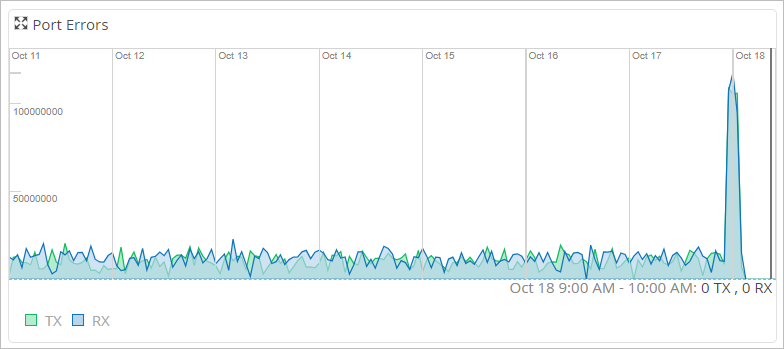
Port Errors—Number of transmit (TX) and receive (RX) errors across the selected time period. Hover your mouse over any point in time to see details below the chart.
-
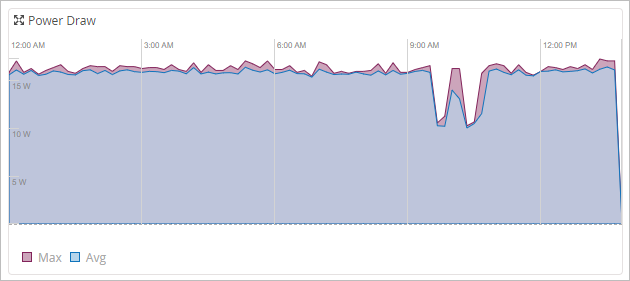
Power Draw—Maximum and minimim Watts drawn across the selected time period. Hover your mouse over any point in time to see details below the chart.
-
-
Switch Ports—A detailed port list. You can see all the ports along with information about the connected endpoints.
-
Current Switch Properties—Displays the switch properties along with its connection status. The properties include the switch location, MAC address, switch model, Junos version, BIOS version, U-boot version, and POE version.
Click into Switch Insights to get an understanding of how the switch is doing over time. Wired Assurance logs and correlates switch events, such as configuration changes, firmware updates, and system alerts. Clicking into an event brings up more details around specific activities, so you never have to guess what happened.
The switch insights also include CPU utilization, memory utilization, bytes transferred, port errors, and power draw. Hovering over the ports in the digital interface shows you high-level data on wired clients or Juniper APs based on the icon you see. There's also an option to view by port list, which also shows any clients or APs that are connected.
These insights can be viewed from a site or switch level, and even down to a specific port or wired client, giving you full visibility into your switch.
Metrics
The Metrics section on the switch details page helps you track the performance of your switches against specific compliance parameters, and identify if there are any areas that need attention. You'll find a bunch of important compliance parameters that are being monitored. For example, you can keep an eye on switch-AP affinity, version compliance, PoE compliance, and switch uptime. When you click each metric, you'll be taken to a detailed view that provides more information.
For more information, see Switch Metrics.
Properties
The Properties tile displays the switch properties that include the device location, MAC address, device ID, device model, and the Junos version on the device. You can access Switch Insights from the Properties tile.
Statistics
This tile displays the switch connection status along with other details such as IP address, number of connected APs, uptime, and configuration status. The Last Config field on the Statistics tile shows the configuration change timestamp immediately after a user makes a configuration change to the switch.
Switch Utilities
The switch details page provides troubleshooting and testing tools to help you get to the root of any issue. To access these tools, click the Utilities drop-down list in the upper right corner of the page.
For more information on switch utilities, see Switch Utilities.
Switch Configuration
If you need to take a closer look at the configuration or make changes to it, scroll down to the Switch Configuration section on the switch details page. This section shows all the configurations applied to the switch through the template linked to the site to which the switch is onboarded. It also shows additional switch-specific settings.
To learn more about the switch configuration templates and different configuration options, see Switch Configuration.