Follow these steps to investigate issues with communications between your switch and
the Juniper Mist™ using CloudX.
For a list of platforms and Junos versions that support Juniper CloudX, refer to Juniper CloudX Overview.
For CloudX to work, you must ensure that the firewall port towards
jma-terminator.xx.mist.com is open and SSL encryption is disabled on the firewall (for more
information, refer to Juniper Mist Firewall Ports and IP Addresses for Firewall
Configuration).
To check if a switch communicates with Mist cloud using CloudX:
-
Run the below CLI commands on the switch:
{master:0}
user@switch> show version | match mist
JUNOS Mist Agent [v1.0.2205-2]

{master:0}
user@switch> show system connections | grep 443
tcp4       0      0  192.168.2.52.62957                            52.52.102.40.443                              ESTABLISHED
To verify CloudX through the Mist portal, you can use the steps below:
-
Log in to the Mist portal (manage.mist.com).
-
Click Switches > switch
name to go to the switch detail page.
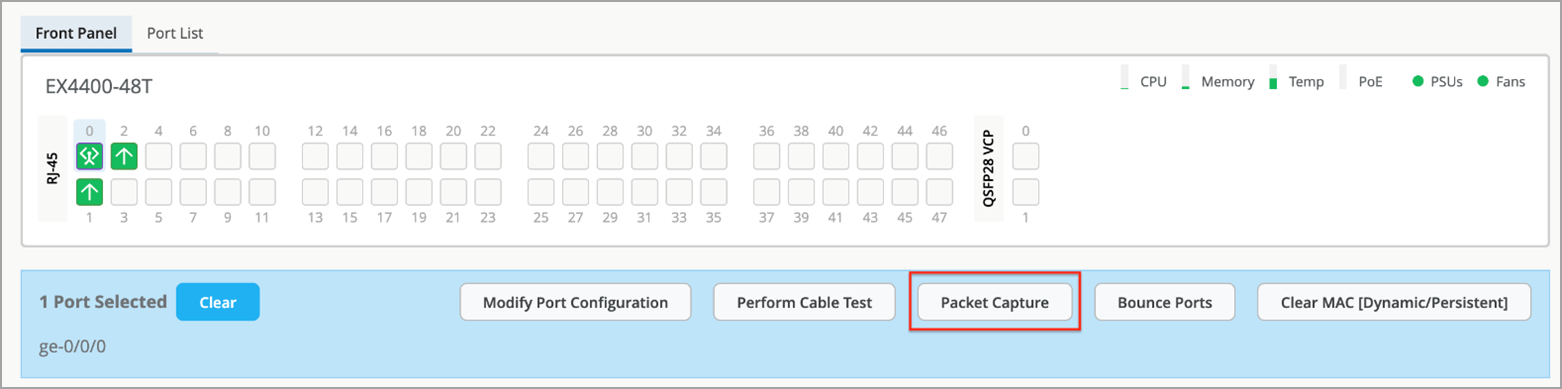
-
Click any port or a range of ports.
If CloudX is running, the Packet Capture button is
enabled; otherwise, the button is grayed
out.
You can also check if CloudX is enabled on multiple switches by using the Mist
portal.
To do that, click Site > Switch
Packet Captures > Add
Switch.
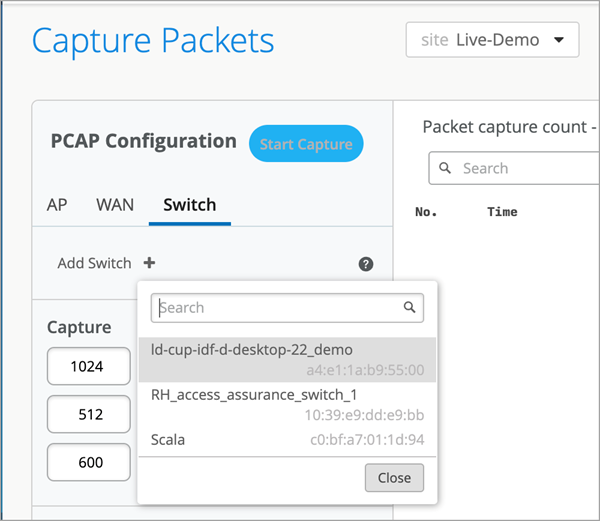
The
switches listed here are all CloudX-enabled.
-
Verify that Mist Cloud Daemon (mcd) and Junos Mist Daemon (jmd) are running.
mcd is responsible for enabling communication between the switch and the cloud. It
maintains a secure WebSocket connection to the terminator in the cloud.
jmd is used for:
- Generating periodic statistics for the device.
- Applying device configuration.
- Gathering device events.
- Initiating device functions (such as packet capture and software updates).
- Returning results from requested functions (such as files and streamed data).
To verify that jmd and mcd are running, use the following CLIs:
user@switch> set cli screen-width 400
user@switch> start shell
% ps aux | grep jmd
root   21408   0.0  0.4 1246080  32200  -  S    Fri23      15:17.51 /var/run/scripts/jet/jmd -mcd-socket /var/run/mist_mcd.ipc
mist    3706   0.0  0.0   11136   2516  0  S+   07:14       0:00.00 grep jmd
%
%
% ps aux | grep mcd
root   21319   0.0  0.3 1242924  22256  -  I    Fri23       8:18.00 /var/run/scripts/jet/mcd
root   21408   0.0  0.4 1246080  32200  -  S    Fri23      15:17.53 /var/run/scripts/jet/jmd -mcd-socket /var/run/mist_mcd.ipc
mist    3708   0.0  0.0   11136   2516  0  S+   07:14       0:00.00 grep mcd
%
-
Check the jmd and mcd logs for any errors by using the CLI commands below. Typically,
jmd logs shows issues related to configuration or stats. The mcd logs report issues
related to the connectivity between the switch and the cloud.
user@switch> show log jmd.log | last 10
[jmd] 2024/11/04 07:12:02 collector.go:850: total stats collection time = 10s
[jmd] 2024/11/04 07:12:02 app_states.go:355: app sending stats to mist cloud (26171 bytes)
[jmd] 2024/11/04 07:12:02 app_states.go:360: successfully sent ipc stats:
[jmd] 2024/11/04 07:12:02 app.go:282: processing app state "STEADY"
[jmd] 2024/11/04 07:12:12 app.go:339: sending ipc keep-alive
[jmd] 2024/11/04 07:12:22 app.go:339: sending ipc keep-alive
[jmd] 2024/11/04 07:12:32 app.go:339: sending ipc keep-alive
[jmd] 2024/11/04 07:12:42 app.go:339: sending ipc keep-alive
[jmd] 2024/11/04 07:12:52 app.go:339: sending ipc keep-alive
[jmd] 2024/11/04 07:12:52 collector.go:417: collecting periodic stats, interval 60
user@switch> show log mcd.log | last 10
[mcd] 2024/11/04 07:09:31 app.go:967: successfully sent msg to cloud: ep-telemetry
[mcd] 2024/11/04 07:10:02 ipc_server.go:414: rx ipc request: send cloud telemetry
[mcd] 2024/11/04 07:10:02 ipc_server.go:447: forwarding ipc telemetry to "junos-stats-" (26167 bytes)
[mcd] 2024/11/04 07:11:02 ipc_server.go:414: rx ipc request: send cloud telemetry
[mcd] 2024/11/04 07:11:02 ipc_server.go:447: forwarding ipc telemetry to "junos-stats-" (26171 bytes)
[mcd] 2024/11/04 07:12:01 app.go:967: successfully sent msg to cloud: ep-telemetry
[mcd] 2024/11/04 07:12:02 ipc_server.go:414: rx ipc request: send cloud telemetry
[mcd] 2024/11/04 07:12:02 ipc_server.go:447: forwarding ipc telemetry to "junos-stats-" (26171 bytes)
[mcd] 2024/11/04 07:13:02 ipc_server.go:414: rx ipc request: send cloud telemetry
[mcd] 2024/11/04 07:13:02 ipc_server.go:447: forwarding ipc telemetry to "junos-stats-" (26171 bytes)
-
If jmd or mcd is not running for some reason, try restarting it, as shown in the sample
below.
{master:0}
user@switch> request extension-service restart-daemonize-app mcd
Extension-service application 'mcd' with pid: 92502 exited with return: -1
Extension-service application restarted successfully
Note: If you are using a 22.4xx Junos version, use the command
request extension-service daemonize-restart mcd.
-
If the switch is not connecting to the cloud, check its reachability by using a ping
and curl test. These tests will help you check if the required firewall ports are
allowed.
The cloud endpoints are not set up to respond to ping tests; however, running a
ping test (as shown below) will ensure that DNS resolves FQDN.
user@switch> ping
              jma-terminator-cloud_env.mist.com
Example:
user@switch> ping jma-terminator-ac2.mist.com
PING a8481a00030ad459aac15af07d5f2c5b-75855524.us-east-1.elb.amazonaws.com (3.210.247.53): 56 data bytes
^C
--- a8481a00030ad459aac15af07d5f2c5b-75855524.us-east-1.elb.amazonaws.com ping statistics ---
1 packets transmitted, 0 packets received, 100% packet loss
Here is a sample curl test. Replace the URL in the below sample with
your designated URL.
user@switch> start shell
% curl -k https://jma-terminator.mistsys.net/test
Welcome to MIST
%
A valid response from the curl test proves that the jma-terminator in the
Mist cloud is reachable. A lack of response or receipt of an error will indicate that
the path between the switch and the cloud is blocking these ports, likely because of the
firewall. The URLs used in the test are the same as those in firewall ports and differ between cloud
instances.