Wireless Client Events
View all events for individual client devices. For example, view the status of connections and authentications.
Features and Benefits
-
Provides a unified view of the wireless client events using which you can easily identify a problem and perform root cause analysis.
- Organization wide client-failure analysis helps in easily identifying if an end-user connectivity issue is caused by a client configuration mistake, network infrastructure and service problems, or authentication policy configuration issues.
Before you Begin
- Familiarize with the options available on your dashboard. See Figure 3.
-
See Juniper Mist Wireless Configuration Guide for wireless configuration details.
-
You need a license for using the Juniper Mist Premium Analytics dashboard. See Mist Premium Analytics Trial License.
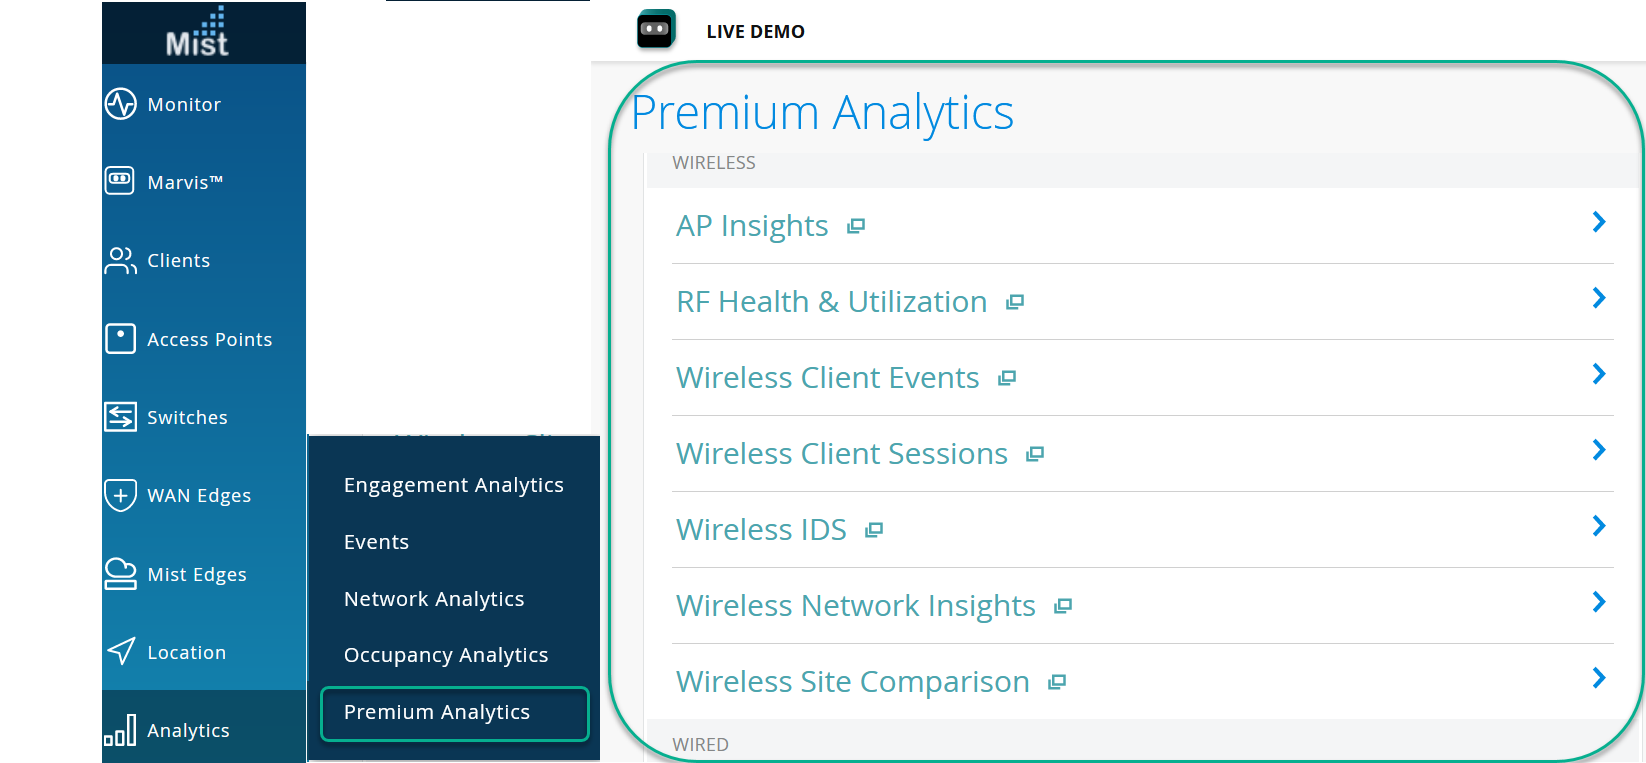
Access Wireless Client Events Dashboard
To access the AP Insights dashboard:
Wireless Client Events Tiles
- Events Timeline
- Failure Events Distribution Across Sites, SSID and APs
- Client Failures Distribution
- Failure Analysis by Event Types
- Association Events
- Client Events - Raw Data
Events Timeline
The Events Timeline tile shows wireless client events over a selected period of time.

Juniper Mist categorizes the events as positive, negative, or neutral and displays the individual events as separate lines in the chart.
Place your cursor on a point in a line graph to see the exact number of events in the selected category.
To hide data for an event category from the chart and see only the remaining categories, click the category name in the legend below.
Failure Events Distribution Across Sites, SSID and APs
The tile shows network-wide failures across each site, SSID, or AP.
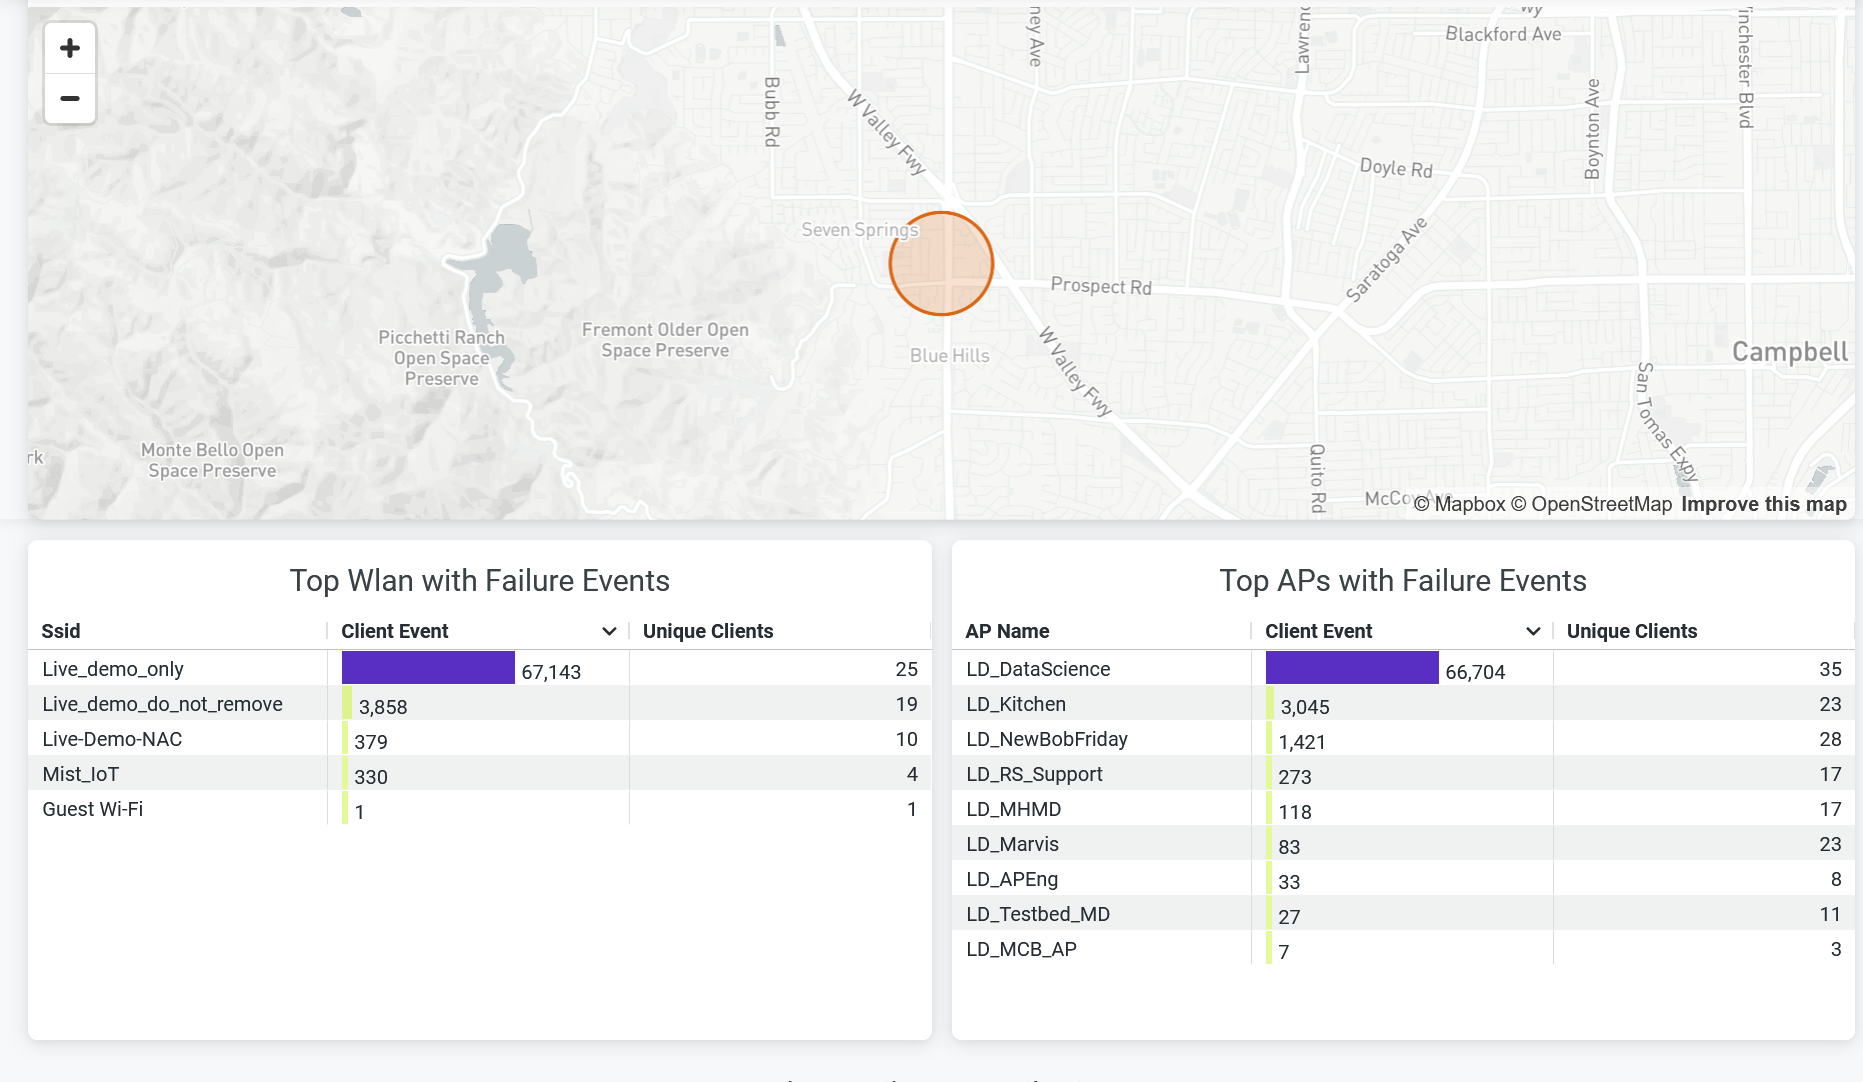
You can view the following details from sections:
- Sites with Failure Events—View the site with failure event in a map. Hover over the map to see the site name, number of clients, and count of client events. Double-click the map to zoom in—you'll see a detailed view of the map. Click the highlighted area of the map to open a new window. The window displays the list of client device names and client failure events in the site. Click Download to download the information.
- Top WLAN with Failure Events—View SSIDs ranked according to the number of failure client events. You can also see unique client events in the table.
- Top APs with Failure Events—View APs ranked according to the number of failure client events. You can also see unique client events in the table.
Client Failures Distribution
The tile shows client failure event distribution classified by the failure reasons.
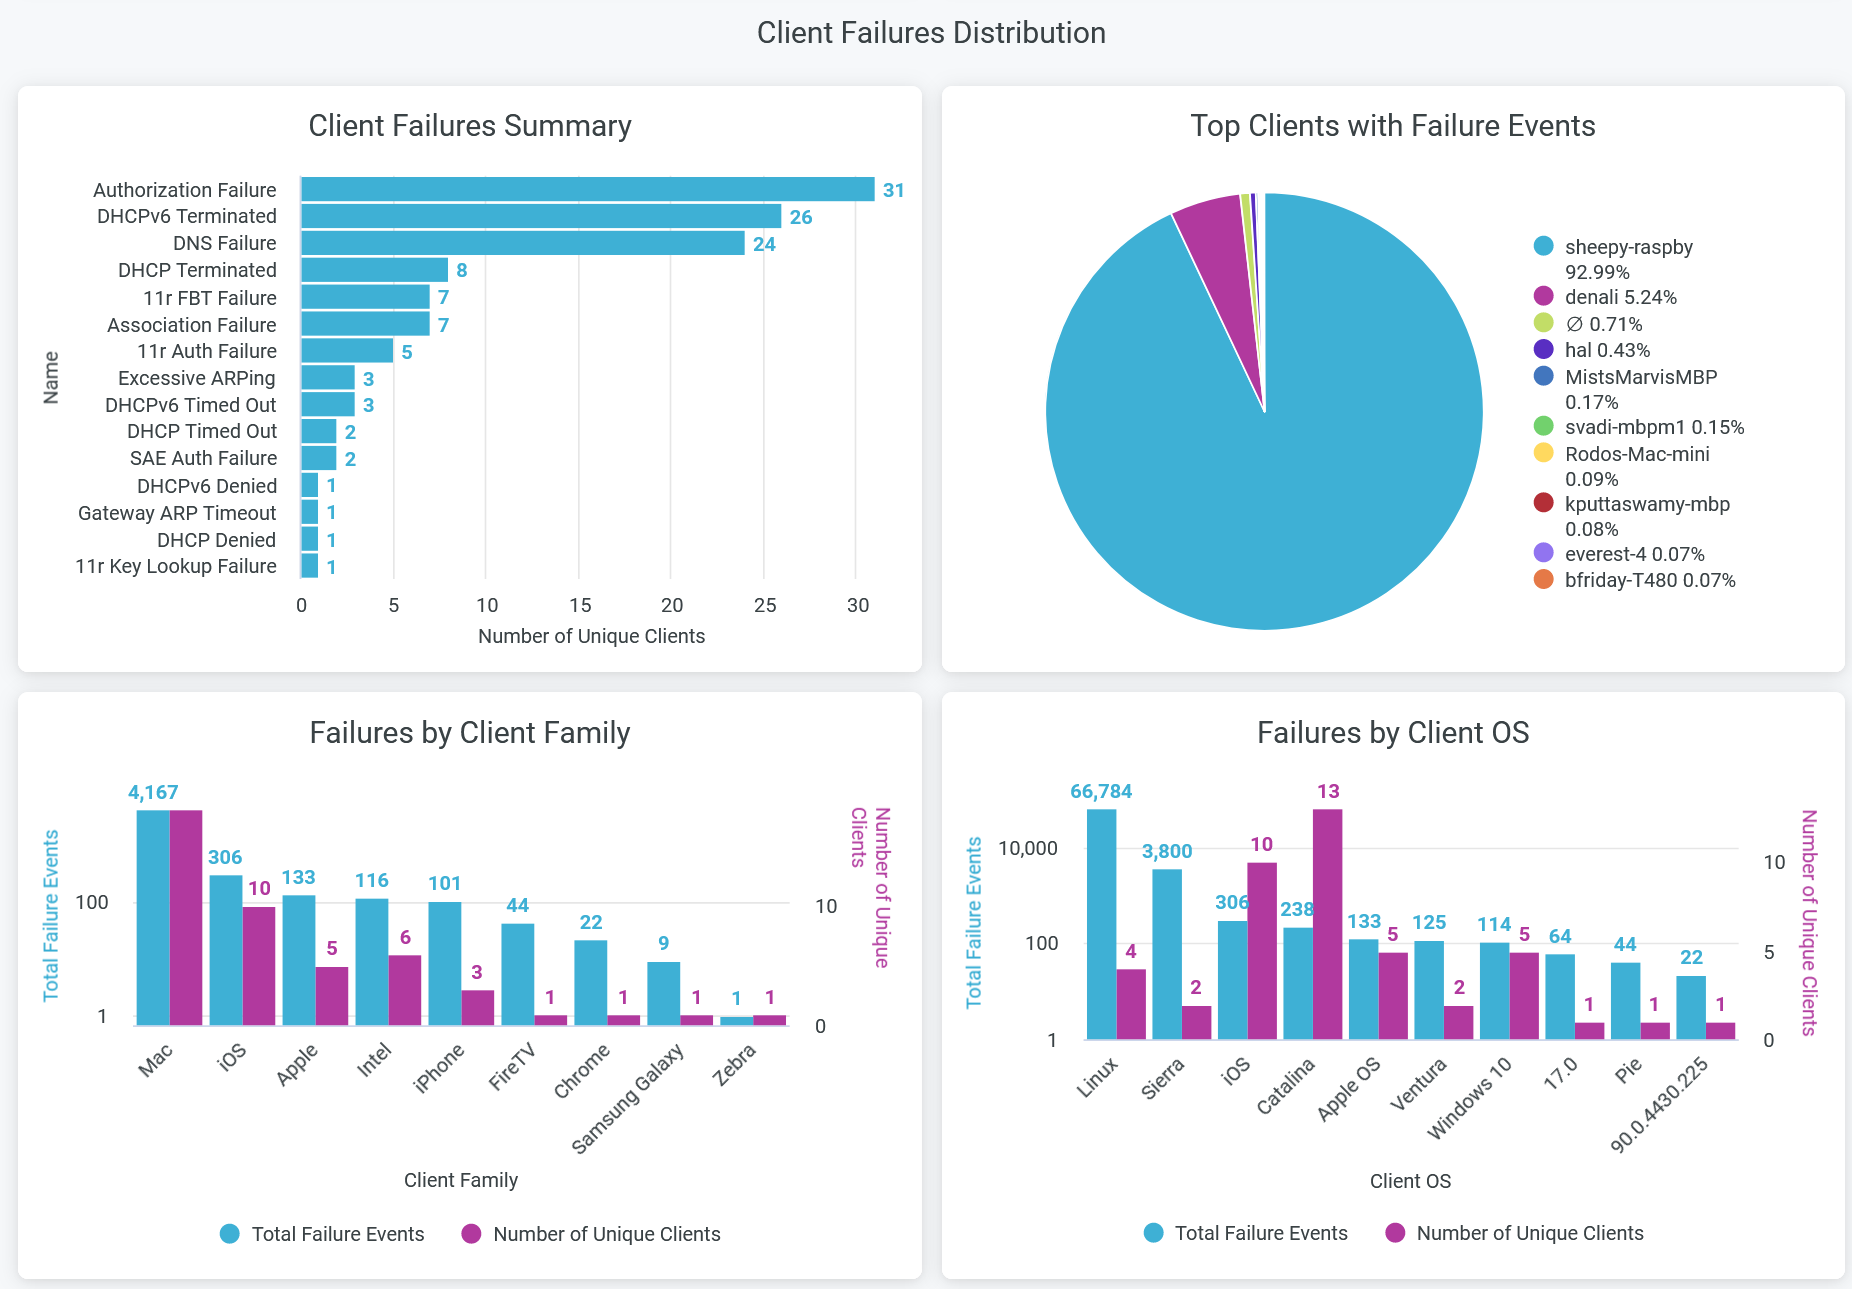
You can see the following details in the tile:
- Client Failures Summary—View reasons for client failure events in horizontal bar chart. Here, you can view the count of each failure reasons and number of unique clients with failure event.
- Top Clients with Failure Events—View the top 10 clients that have the highest number of failure events. The chart represents the proportion of failure events associated with each client.
- Failures by Client Family—View the total failure events per client devices types. The chart shows the count of event failures and number of unique clients for each type of devices. Click on the chart to open a new window to view client device names and failure events per device.
- Failures by Client OS—View the total failure events per client devices operating system. The chart shows the count of event failures and number of unique clients for each type of operating system. Click on the chart to open a new window to view client device names and failure events per operating system.
Failure Analysis by Event Types
DHCP Events
The tile shows number of pre-connection and post-connection failure events caused due to Dynamic Host Configuration Protocol (DHCP) server.
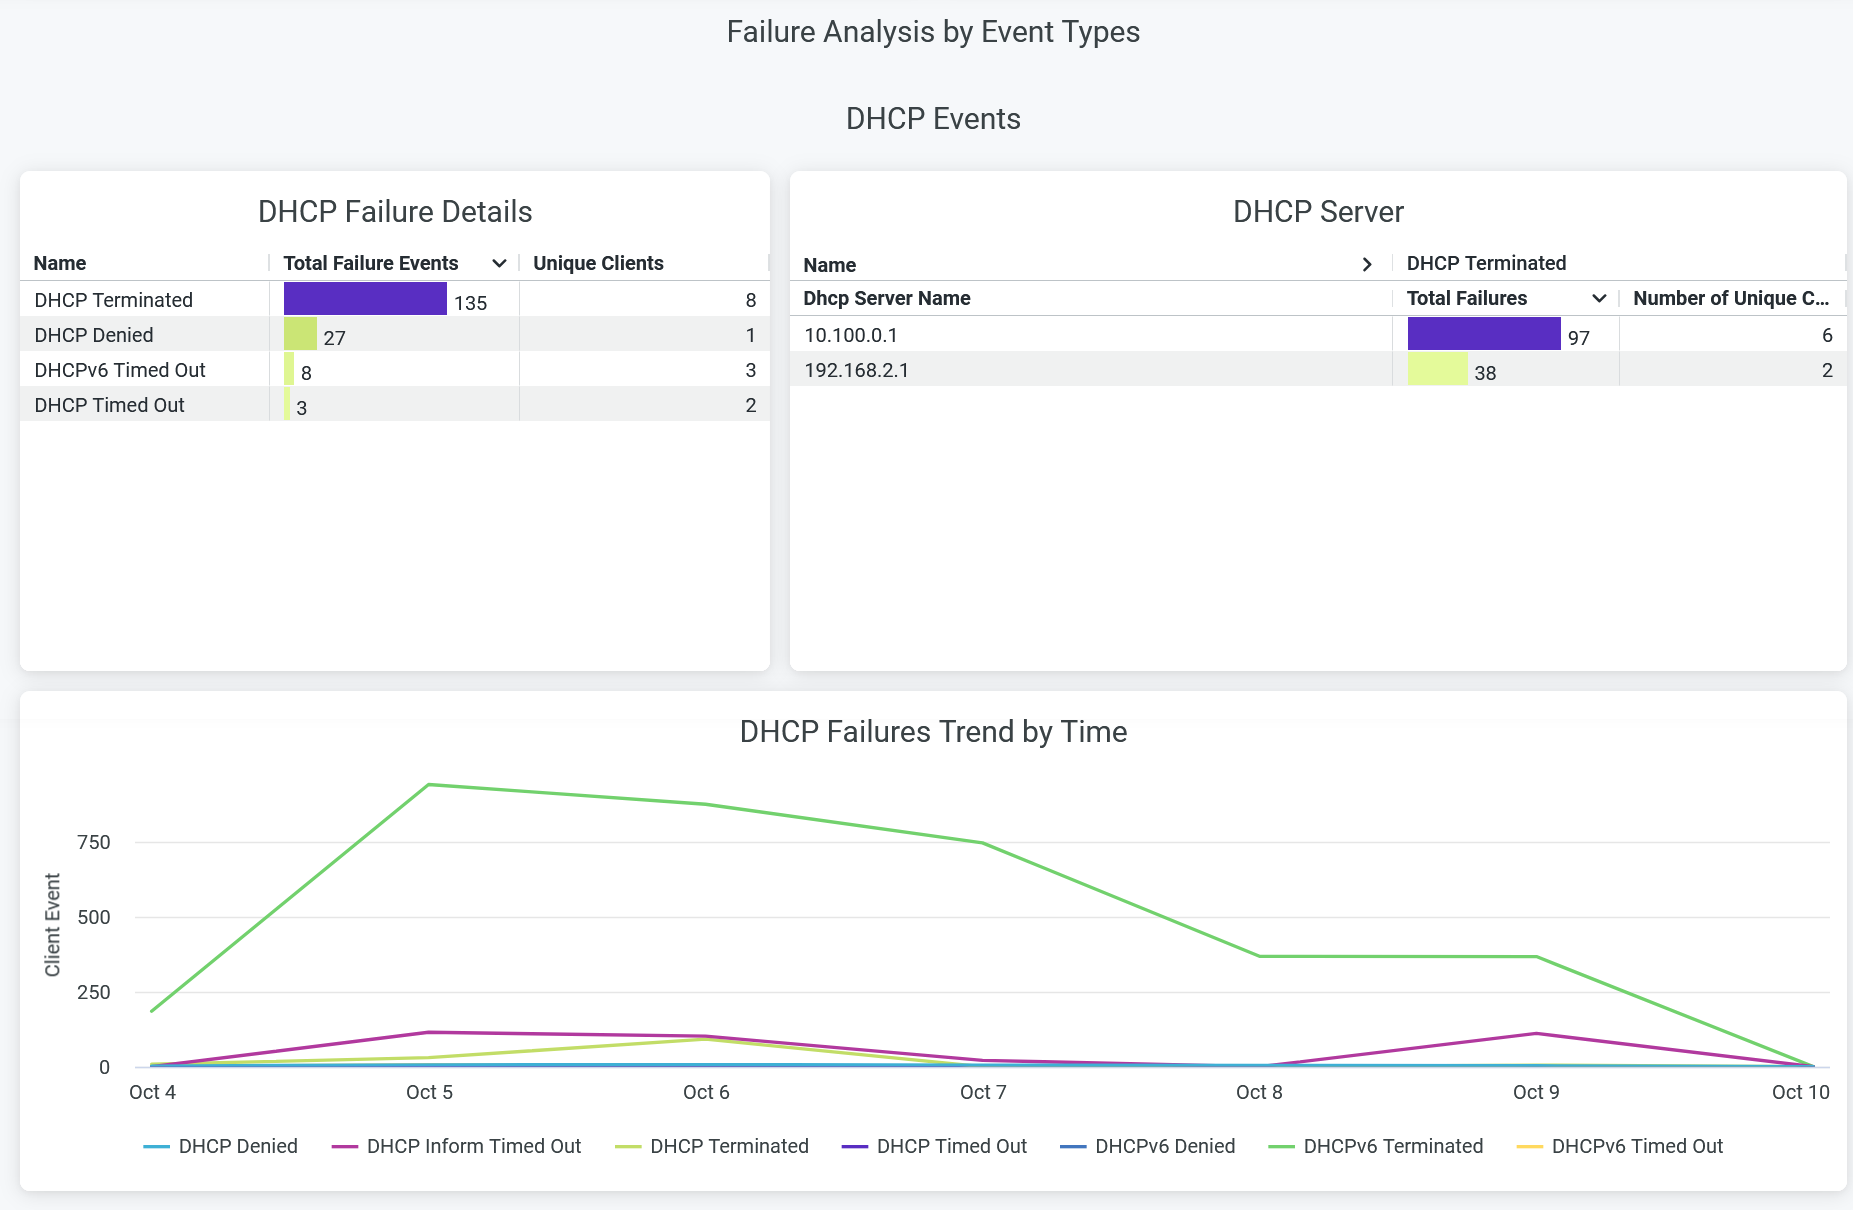
You can view the following details on the chart:
- DHCP Failure Details—The list of DHCP failure causes along with the count of corresponding failure incidents. The chart also displays the list of unique client devices associated with each failure cause.
- DHCP Server—The list of DHCP servers responsible for failure event along with the count of failure events. The chart also displays the list of unique client devices associated with each DHCP server.
- DHCP Failures Trend by Time—DHCP failure trends classified by the failure event reasons. Place your cursor on a point in a line graph to see the exact number of failure event in the selected cause. To hide information about a DHCP failure reason from the chart and see information only about the remaining reasons, click the reason in the legend.
DNS Events
The tile shows number of pre-connection failure events caused due to Domain Name System (DNS) server.
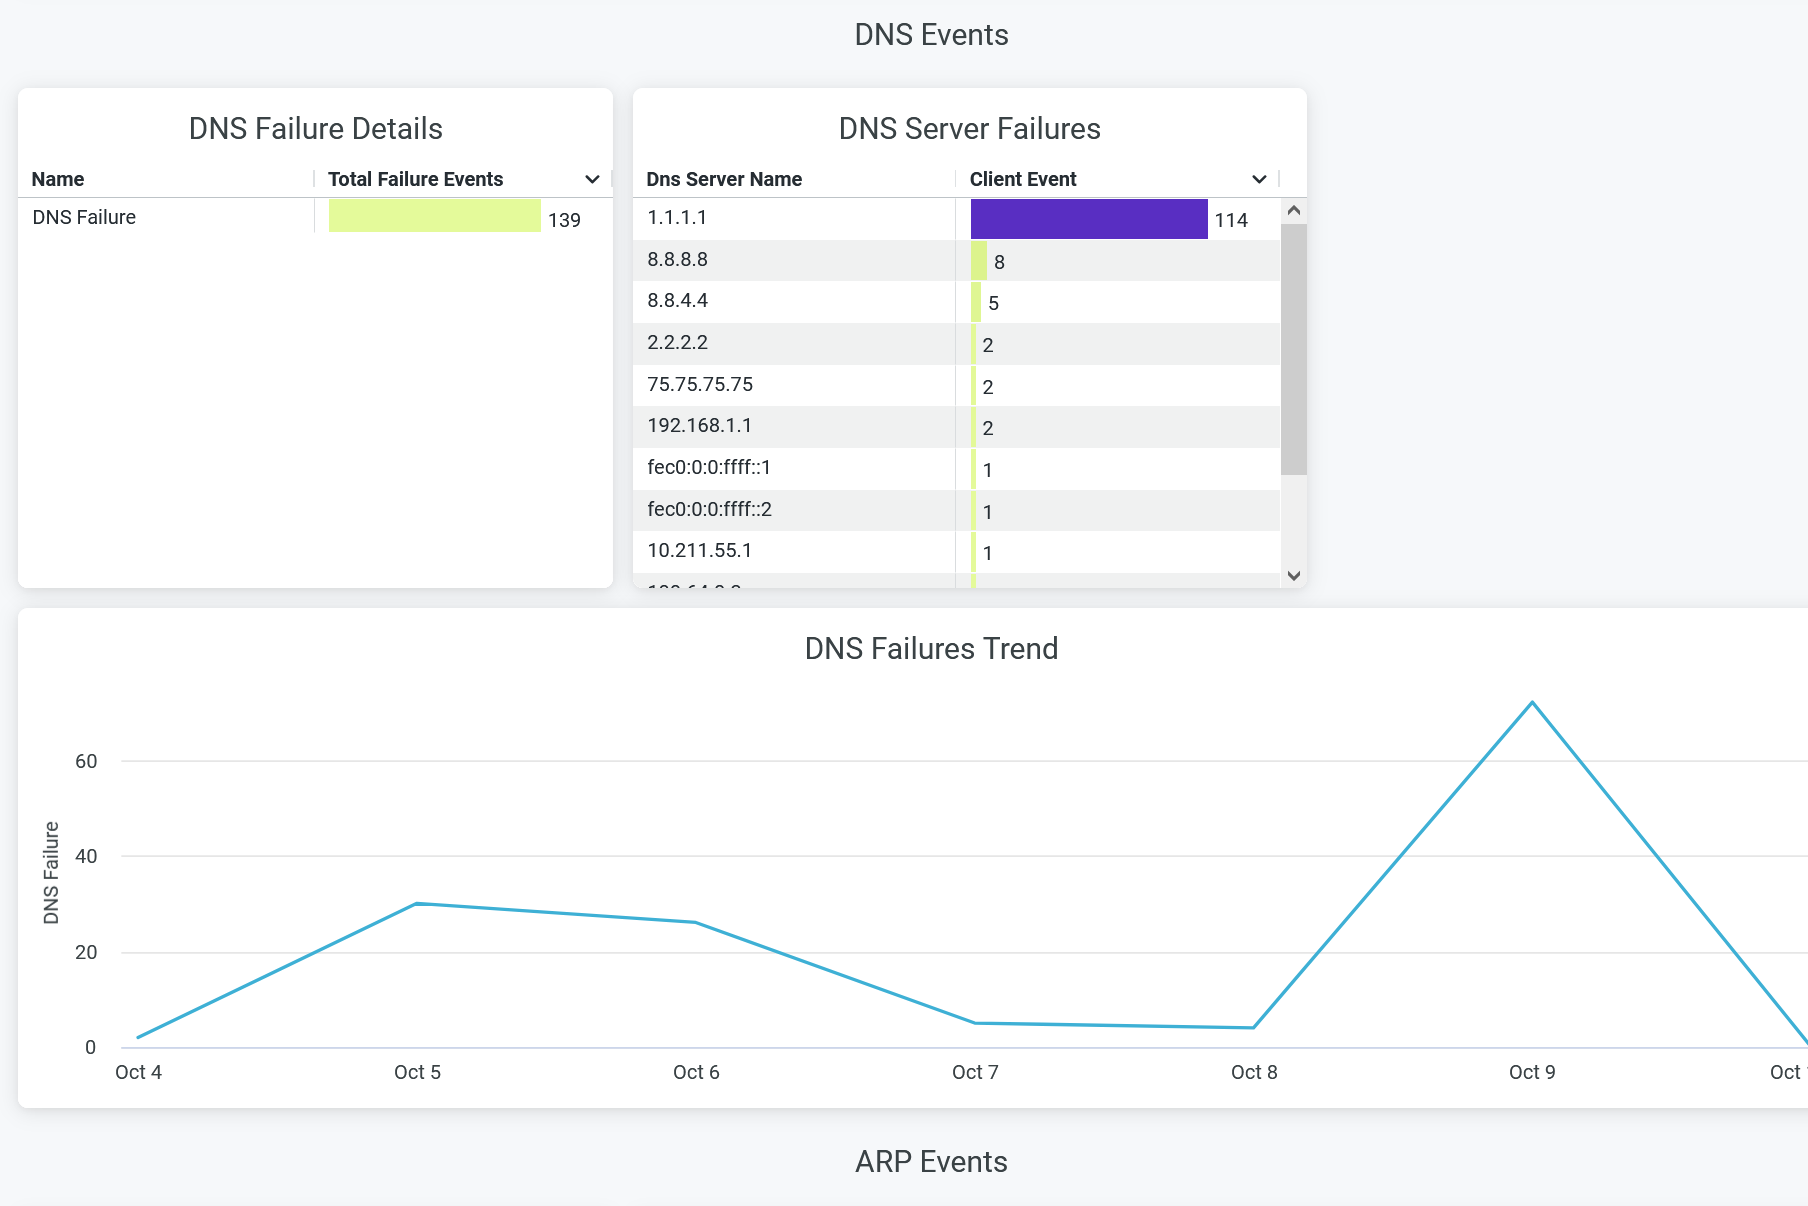
You can view the following details on the chart:
- DNS Failure Details—The count of DNS failure events. Click on the chart to open a new window to display the list of unique client devices along with the count of DNS failure events for each device.
- DNS Server Failure—The list of DNS servers responsible for failure event along with the count of failure events. Select a server on the chart and click to open a new window to display the list of unique client devices along with the count of DNS failure events for each device.
- DNS Failures Trend—DNS failure trends over a selected period of time. Place your cursor on a point in a line graph to see the exact number of failure events.
ARP Events
The tile shows Address Resolution Protocol (ARP) failure details.

You can view the following details on the chart:
- ARP Failure Details—The list of ARP failure types along with the count of corresponding failure incidents. Click on the chart to open a new window to display the list of unique client devices along with the count of ARP failure events for each device.
- ARP Failures Trend—ARP failure trends classified by the types of failure. Place your cursor on a point in a line graph to see the exact number of failure event in the selected type. To hide information about a ARP failure type from the chart and see information only about the remaining types, click the type in the legend.
Roaming Events
The tile shows number of failure events caused while a client device roams between two access points

You can view the following details on the chart:
- Roaming Failure Details—The list of ARP failure types along with the count of corresponding failure incidents. Click on the chart to open a new window to display the list of unique client devices along with the count of ARP failure events for each device.
- Roaming Failures Trend—Roaming failure trends classified by the types of failure. Place your cursor on a point in a line graph to see the exact number of failure event in the selected type. To hide information about a roaming failure type from the chart and see information only about the remaining types, click the type in the legend.
Authorization Events
The tile shows number of failure events caused during authorization process.
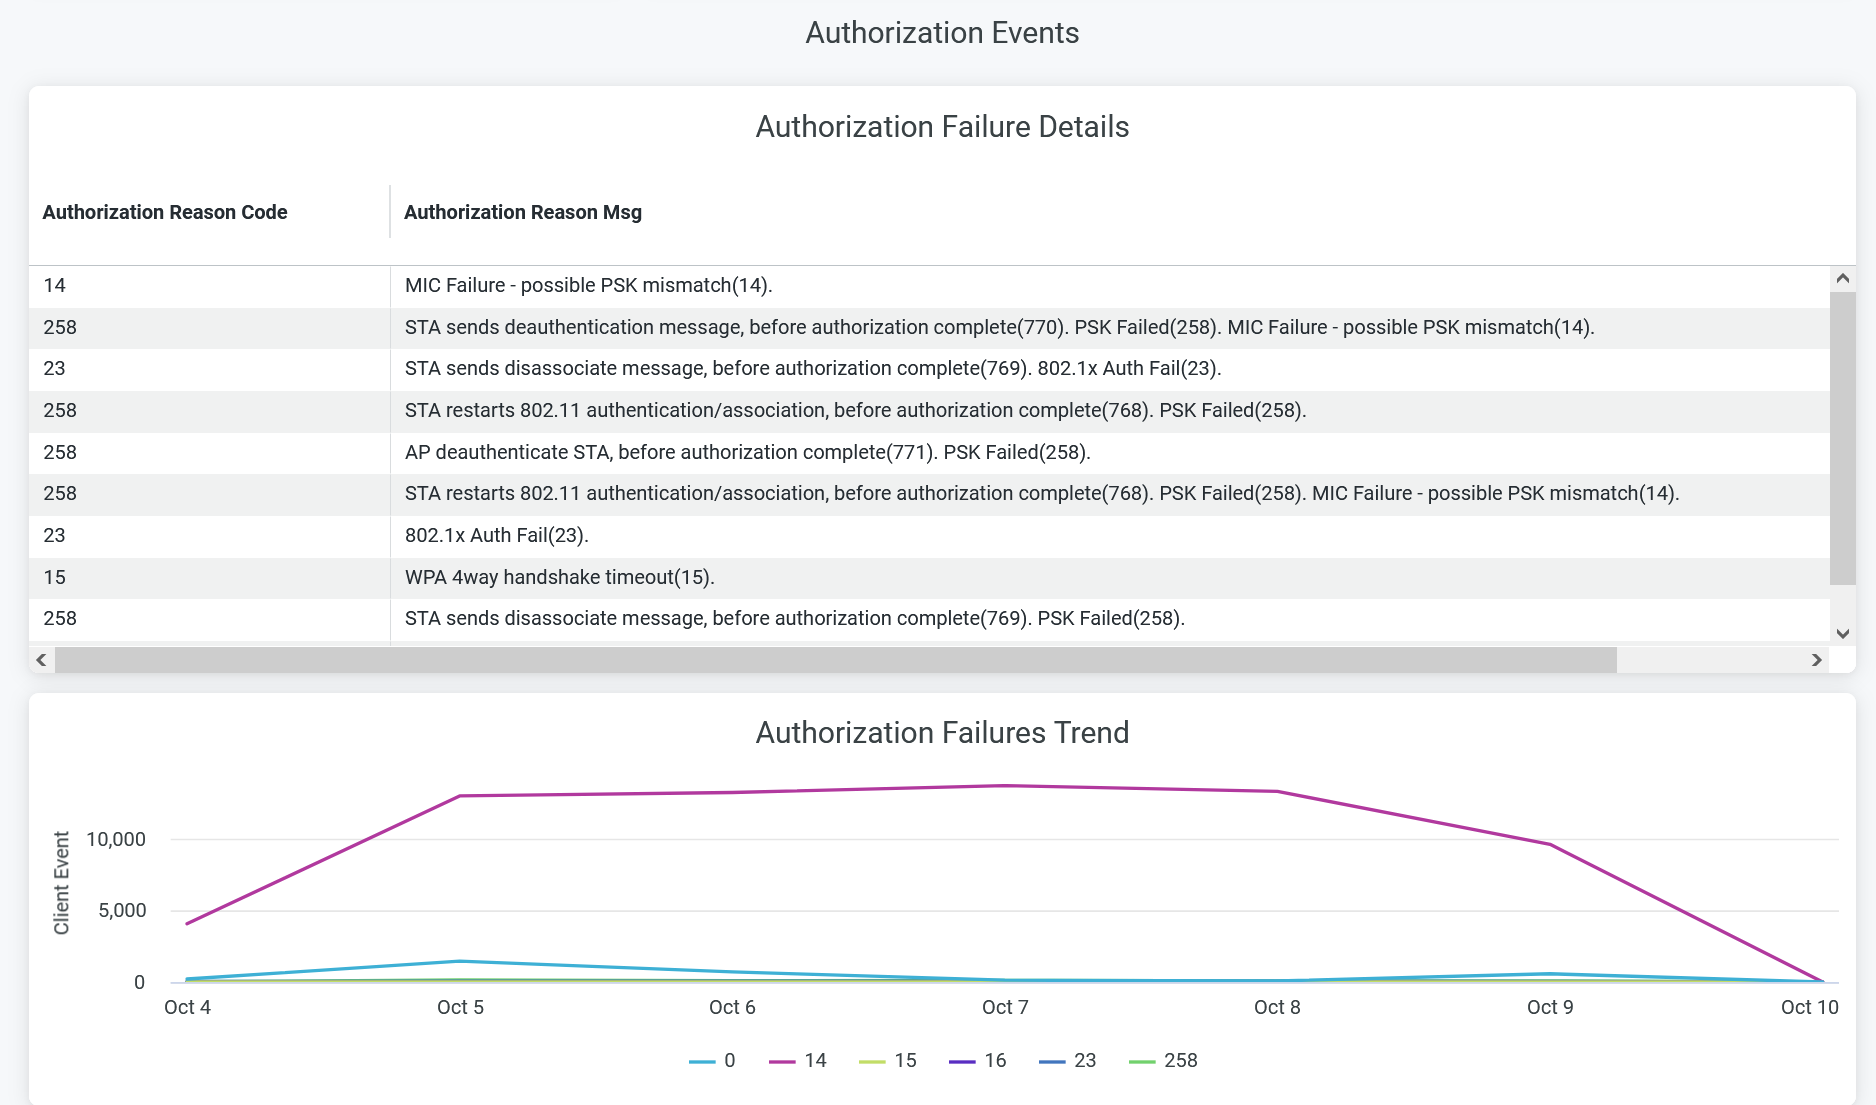
You can view the following details on the chart:
- Authorization Failure Details—The list of authorization failure reason code, authorization reason message with the count of corresponding failure incidents. Click on the chart to open a new window to display the list of unique client devices along with the count of failure events for each device.
- Authorization Failures Trend—Authorization failure trends classified by the failure reason code. Place your cursor on a point in a line graph to see the exact number of failure event in the selected code. To hide information about a failure code from the chart and see information only about the remaining codes, click the failure code in the legend.
Association Events
The tile shows number of failure events caused during association process.
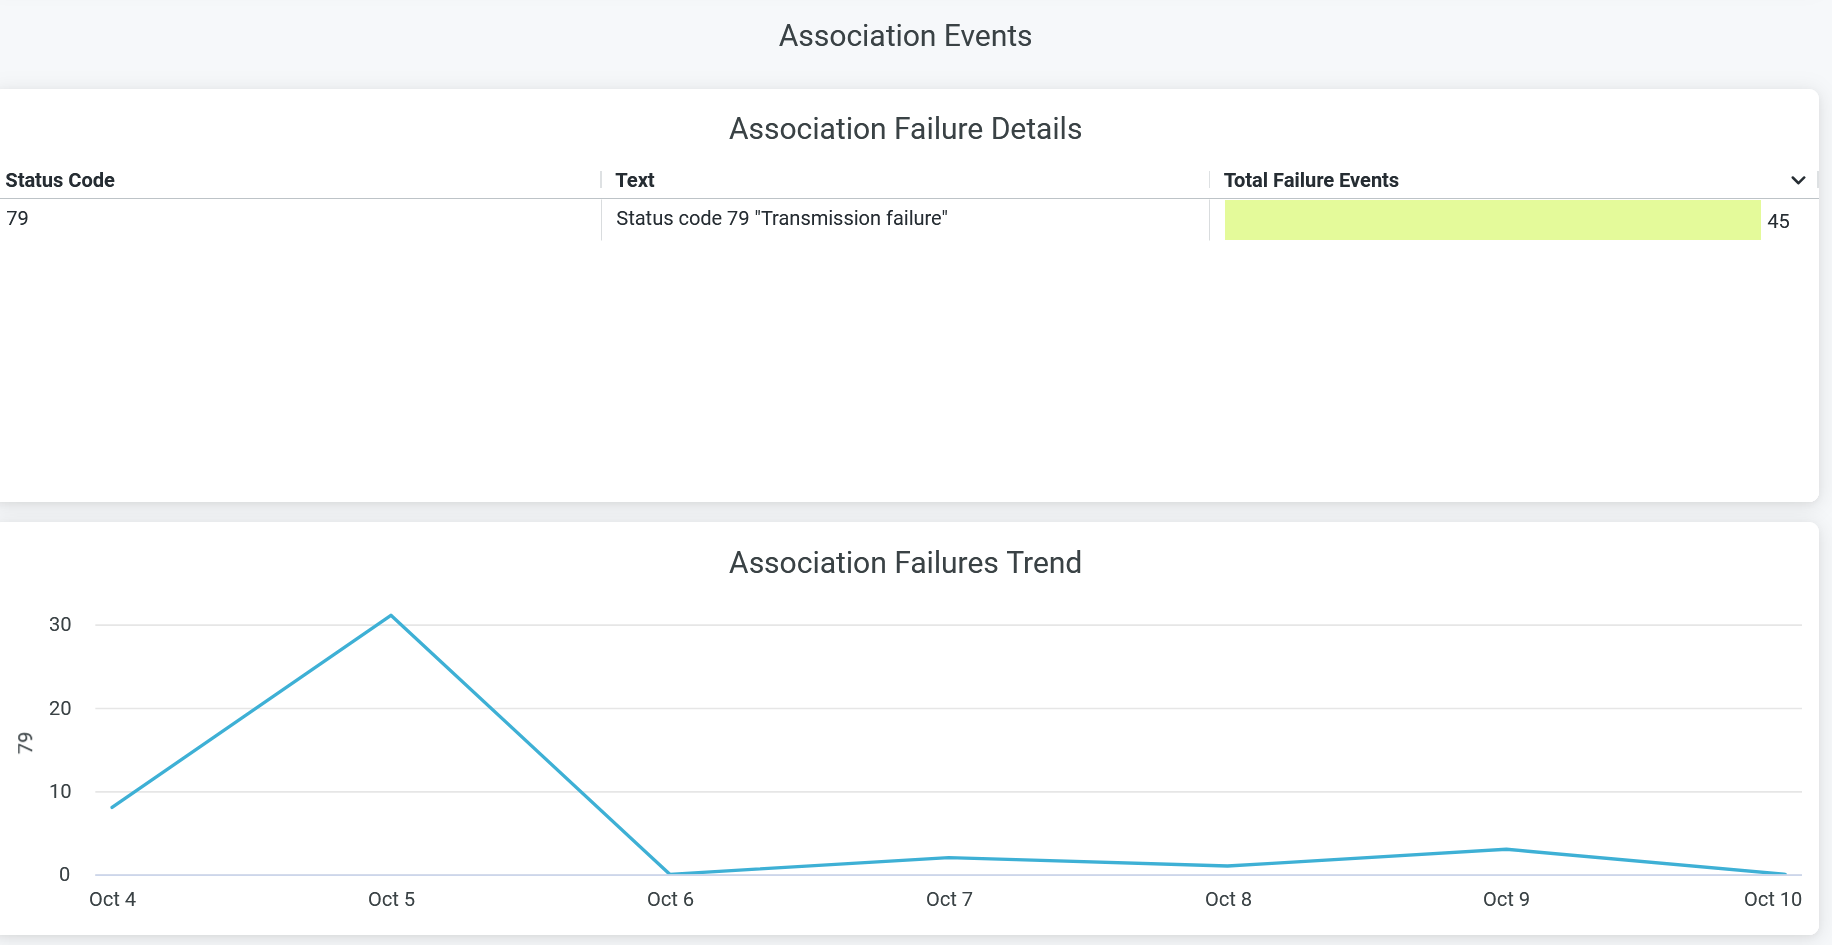
You can view the following details on the chart:
- Association Failure Details—The list of authorization status code, text message with the count of corresponding failure incidents. Click on the chart to open a new window to display the list of unique client devices along with the count of failure events for each device.
- Association Failures Trend—Association failure trends over a period of time. Place your cursor on a point in a line graph to see the exact number of failure event in the selected code. To hide information about a failure code from the chart and see information only about the remaining codes, click the failure code in the legend.
Client Events - Raw Data
The tile shows the summary of all failure events with failure reasons and code.

You can view the following details:
- Name—Reason for failure event.
- Site Name—Name of the site where the failure occurred.
- Status code—Status code associated with failure event.
- Reason code—Reason code associated with failure event.
- Text—Message associated with failure event.
- Client Hostname—Hostname of a client.
- SSID—SSID to which a client device is connected.
- MAC—MAC address of a client device.
- Client Family—Type of a client device.
- Client model—Model of a client device.
- Client OS—Operating system running on a client device.
- Client manufacturer—Manufacturer of a client device.

