Mist Premium Analytics Dashboards
Get familiar with the Premium Analytics features, dashboard, and reporting options.
Juniper Mist™ Premium Analytics is an advanced, cloud-based analytics service that provides enterprises with end-to-end network observability. You can gain insights from client to cloud that enable you to effectively identify and solve any issues. You can use client and traffic utilization data for better planning, resource management, and network security.
Premium Analytics allows you to run reports over data sets at a more granular level and can store up to 13 months (or more) of data. This feature extends observability of historical data beyond the 30 days available with the standard Juniper Mist analytics service, enabling users to perform long-term historical time series analyses of network, applications, visitor, and employee behavior to enhance business decision-making
Watch the video for additional details—Juniper Mist Premium Analytics Overview.
Features and Benefits
- Stores up to 13 months+ of data
- Enables report scheduling
- Supports ingestion of Mist AI-driven data
- Supports optional 3rd-party data ingestion
- Provides ability to mix and match data sets
- Offers simple, easy-to-use, preconfigured dashboards
View Available Dashboards in Premium Analytics
-
In the left menu of the Juniper Mist portal, click
Analytics > Premium
Analytics.
Figure 1: Access Premium Analytics
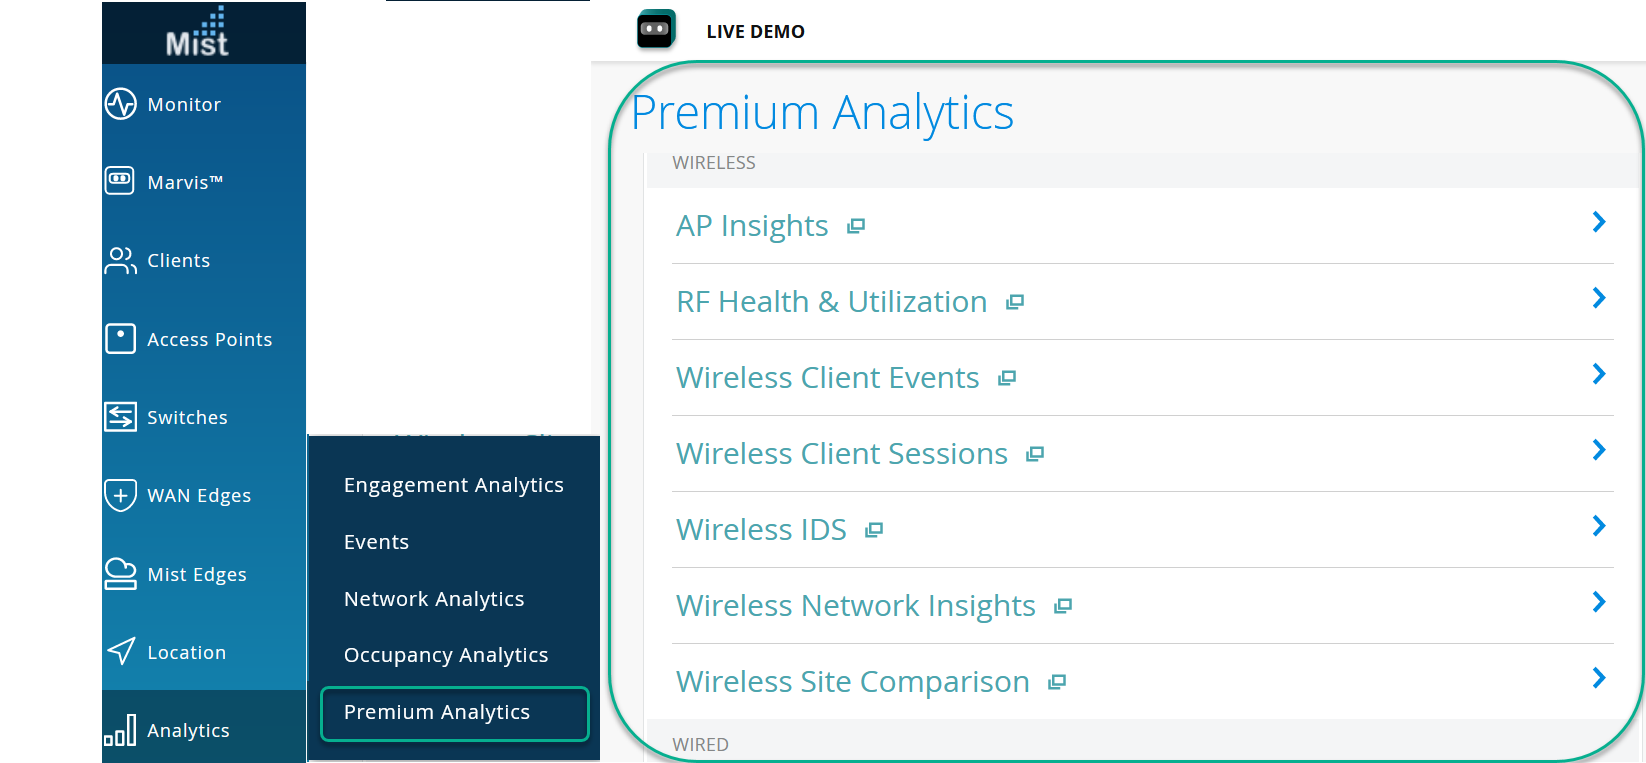
Table 1 shows available dashboards in Premium Analytics.
Table 1: Premium Analytics Dashboards Category Dashboards Insights Available on Dashboards Wireless AP Insights AP-specific insights for traffic and clients
RF Health and Utilization - Channel Utilization analytics for RF bands
- Interference, Neighbor count and co-channel metrics
- -RM and DFS information
Wireless Client Events - Organization wide client-failure analysis
- Failure types and distribution by Site, WLAN, AP, Client type, OS
- Failure analysis for clients, Dynamic Host Configuration Protocol (DHCP), Domain Name System (DNS), authorization, association, and roaming
Wireless Client Sessions - Client sessions and guest session details and trends
- Session distribution views for top APs, WLANs, Client OS's
Wireless IDS Long term storage of Rogue and IDS events
Wireless Network Insights -
Organization wide SLE and traffic trends
-
Client distribution by device-type, OS, 802.11 protocols
-
Traffic and application insights by SSID and clients
-
Busiest AP and SSID
Executive Summary - Wireless Usage of the wireless network, client devices, applications, and traffic Wireless Site Comparison Comparison of up to three sites or site groups across various wireless metrics such as SLE, client, traffic, and application
Wired PoE Switch Details Switch-specific insights for Power over Ethernet (PoE) ports, power draw and consumption trends Sustainability Analytics PoE usage, ports, power draw, PoE budget (total power output available to PoE ports), and consumption trends. Switch Insights AP-specific insights for traffic and clients Wired Network Insights - Switch SLE metrics
- Traffic metrics of wired network by site, switch, port, and VLAN
- Port utilization trends
Wired Site Comparison Comparison of up to three sites across various wired metrics such as SLEs, interfaces, traffic, and PoE WAN - WAN Network Insights-SRX
- WAN SLE metrics
- Application distribution by users
- Traffic metrics by site, devices, and zones
- WAN Network Insights-SSR
- WAN SLE metrics
- Application distribution by users
- Traffic metrics by site and devices
WAN Security - SSR IDP and URL events Events Wireless Client Events - Organization-wide client-failure analysis
- Failure types and distribution by site, wireless LAN (WLAN), AP, client type, OS
- Detailed failure analysis
- Information about DHCP, DNS, authorization, association, and roaming
Location Engagement Analytics - Visitor footfall metrics and trends
- Dwell time metrics and trends
- Zone ranking and zone movement analytics
Occupancy Analytics - Occupancy and dwell-time details of sites, floors, and zones
- Details about wireless functions, Bluetooth Low energy (BLE) tags, and BLE app clients
- Visitor footfall metrics
Occupancy Analytics Zone Zone-specific occupancy insights on device trends, device visits, and dwell times Proximity Tracing and Occupancy Compliance User journey map and proximity tracing Other Audit - Long-term storage of audit logs
- Top actions grouped by type and user
Inventory - Organization-wide inventory report
- Firmware and model details
Subscription Management for Premium Analytics Dashboards
Juniper Mist provides Premium Analytics dashboard types for different technology stacks such as Wireless & Location, Wired, and WAN. Depending on the number of subscriptions you have, you can select all dashboard types or specific dashboard types that belong to a particular stack.
Based on your selection, the Premium Analytics subscriptions are counted against the associated device types. For example, if you select the Wireless & Location dashboard type, only the number of APs and beacon points is considered against the Premium Analytics subscriptions. If you select Wired, then only the number of switches is considered. Likewise, if you select WAN, then only the number of WAN Edges is considered.
You can select the dashboard types from the Organization > Subscriptions > Premium Analytics page. When you select the dashboard types, only the relevant dashboards are displayed. Table 2 lists the dashboards that are visible for each dashboard type.
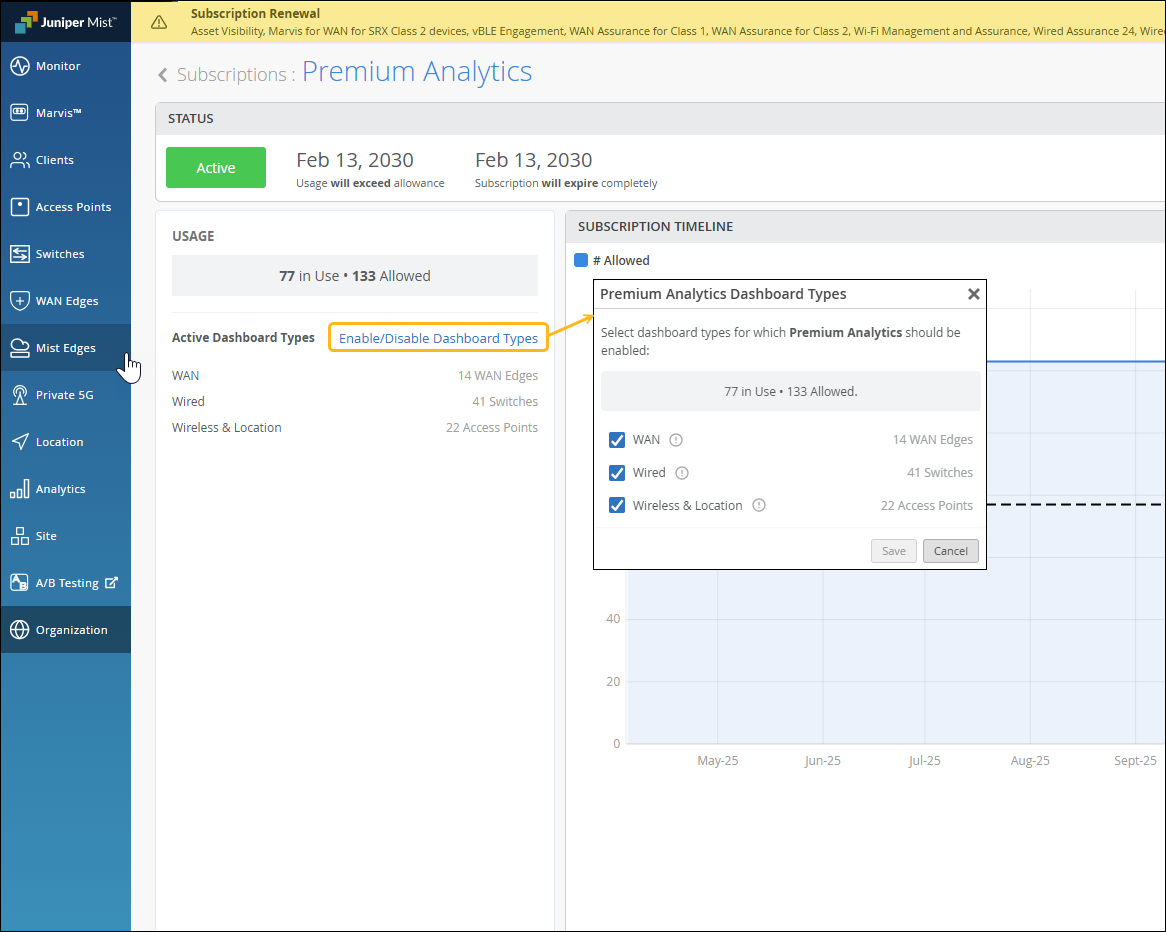
If you do not select a dashboard type, the dashboards under the Wireless category are enabled by default, and the Premium Analytics subscriptions are counted against the Access Points. For existing deployments, we recommend that you select the dashboard types to comply with the subscription count.
| Category | Dashboard Name | Dashboard Type (for Which Premium Analytics Subscriptions Are Applied) | Additional Prerequisites |
|---|---|---|---|
| Wireless | Wireless Network Insights | Wireless & Location | - |
| AP Insights | - | ||
| Wireless IDS | - | ||
| RF Health and Utilization | - | ||
| Wireless Client Events | - | ||
| Wireless Client Sessions | - | ||
| Executive Summary Wireless | - | ||
| Wireless Site Comparison | - | ||
| Wired | Wired Network Insights | Wired | - |
| Switch Insights | - | ||
| Wired Site Comparison | - | ||
| Sustainability Analytics | - | ||
| PoE Switch Details | - | ||
| WAN | Security Assurance | WAN | - |
| WAN Insights - SRX | - | ||
| WAN Insights - SSR | - | ||
| WAN Speedtest Insights | - | ||
| Peer Path Insights | - | ||
| Other | Audit Logs | Included by default | - |
| Inventory | Included by default | - | |
| Access Assurance | Included by default | SUB-CLNT | |
| Location | Engagement Analytics | Wireless & Location | - |
| Occupancy Analytics | - | ||
| Occupancy Analytics by Zone | - | ||
| Occupancy Analytics by Users | - | ||
| Proximity Tracing |
See View Available Dashboards in Premium Analytics for more information about the dashboards.
Premium Analytics Dashboard Overview
Juniper Mist Premium Analytics provides easy-to-use dashboards that you can use to generate a report by specifying some criteria and using filters. You can use the report to identify issues and trends and generate, schedule, and deliver customized reports through e-mails.
Figure 2 shows a Premium Analytics dashboard, which displays wireless client sessions.
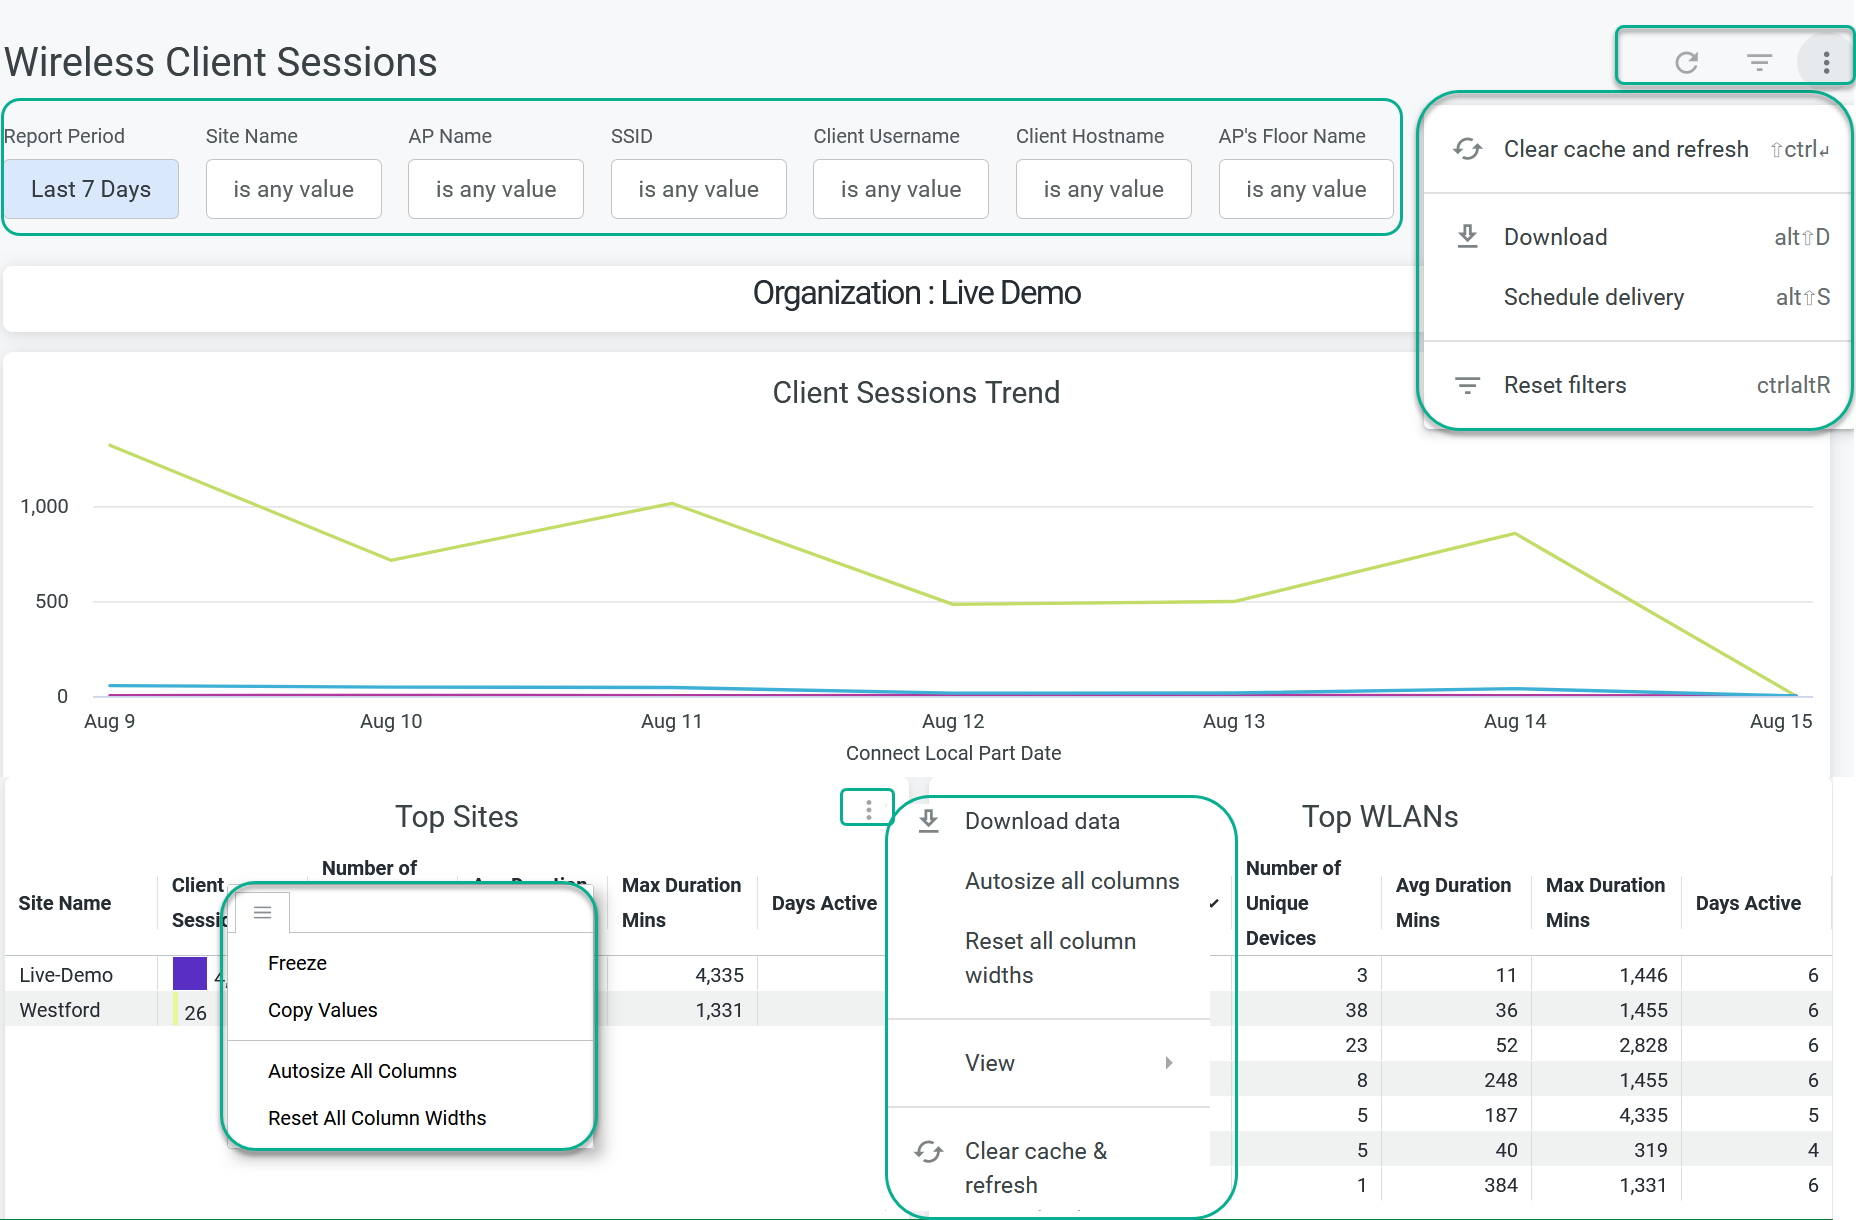
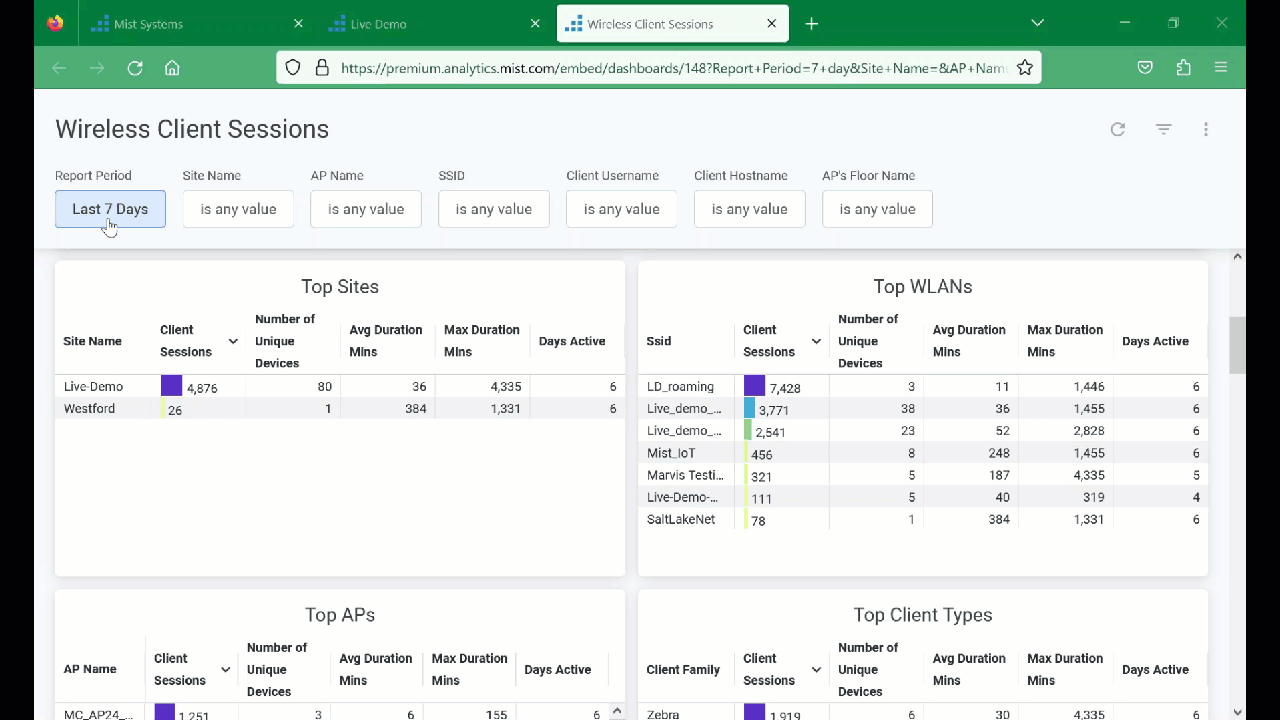
Table 3 shows you the different options that you can use on the dashboard to work with the report.
| Dashboard Options | Description |
|---|---|
| Filter | Depending on the analytics dashboard that you select, the available filters are site, AP, SSID, and other network elements. On all the dashboards, you can specify a period for which you want to generate an analytics report. |
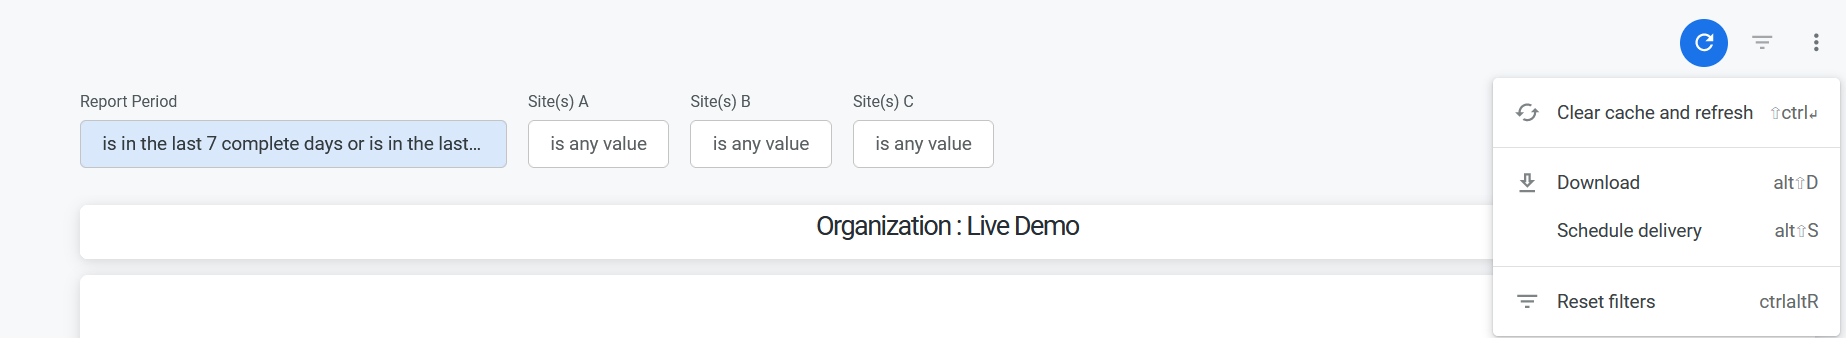
| Dashboard actions |
On the top-right corner of the page, you can see the dashboard actions menu (ellipsis icon). You can use the menu options to perform various actions for the report at the dashboard level such as:
|
| Tile actions |
On the top-right corner of each tile, you can see the tile actions menu (ellipsis icon). You can use the menu options to perform tile-level actions such as:
|
| Column options | On the top-right corner of each column in a tile, you can see the
column options menu. You can use the menu options to perform
tile-level actions such as:
|
Download Dashboards Reports
To download the report:
-
Click the Dashboard Actions menu (ellipsis icon) and
select Download
Figure 4: Download Dashboard Report
 The Download Report window appears.Figure 5: Report Download Window
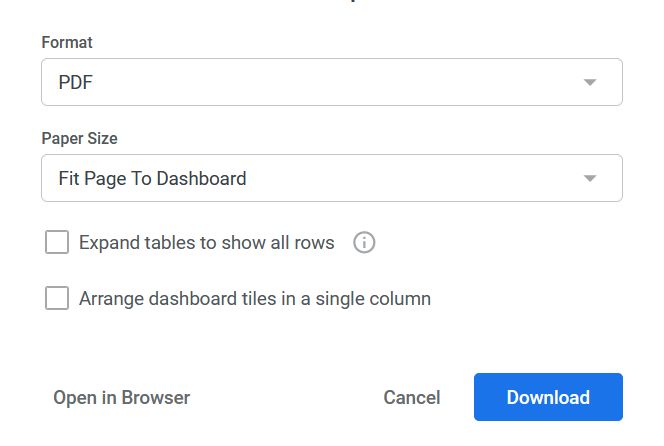
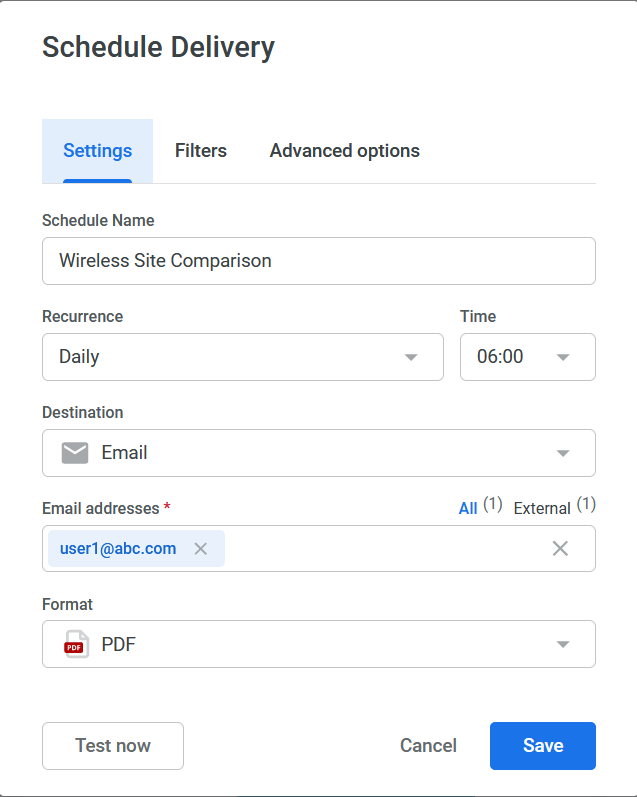
Schedule Report Generation and Delivery
To schedule report generation and delivery:
-
On the dashboard, click the Dashboard Actions menu
(ellipsis icon) and select Schedule Delivery.
The Schedule Delivery window appears.Figure 6: Schedule Report Delivery
Download Tile-Specific Report
You can expand, download, or view a visualization for specific tiles within the dashboard. In the tile, click the tile actions icon on the right-side corner of the tile as shown in the figure:
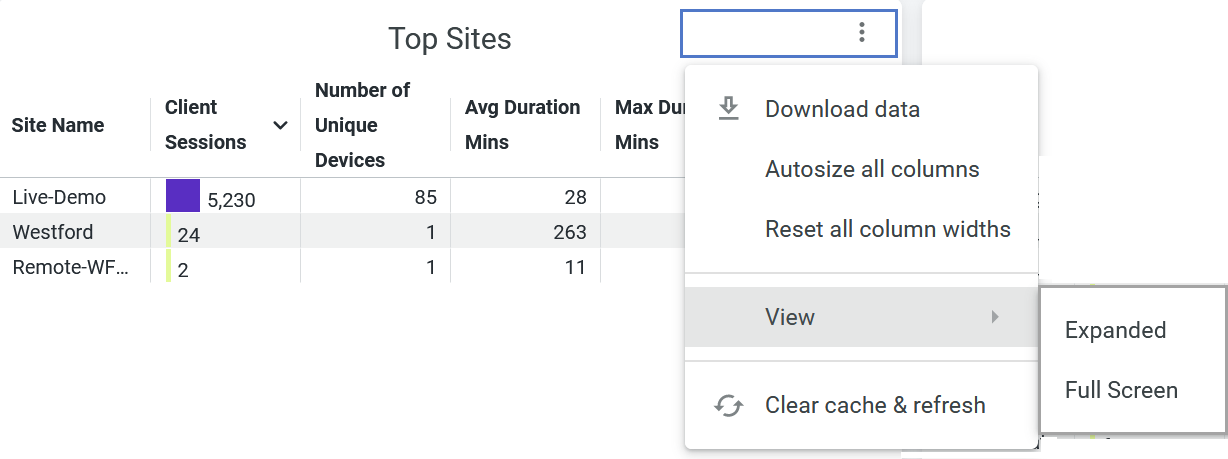
You can perform the following tasks:
-
Download data
-
Autosize all columns
-
Reset all column widths
-
View (expanded or full-screen)
-
Clear cache and refresh
To download the tile-specific details, complete the following steps:
See Also
Cross-Launch Analytics Dashboards
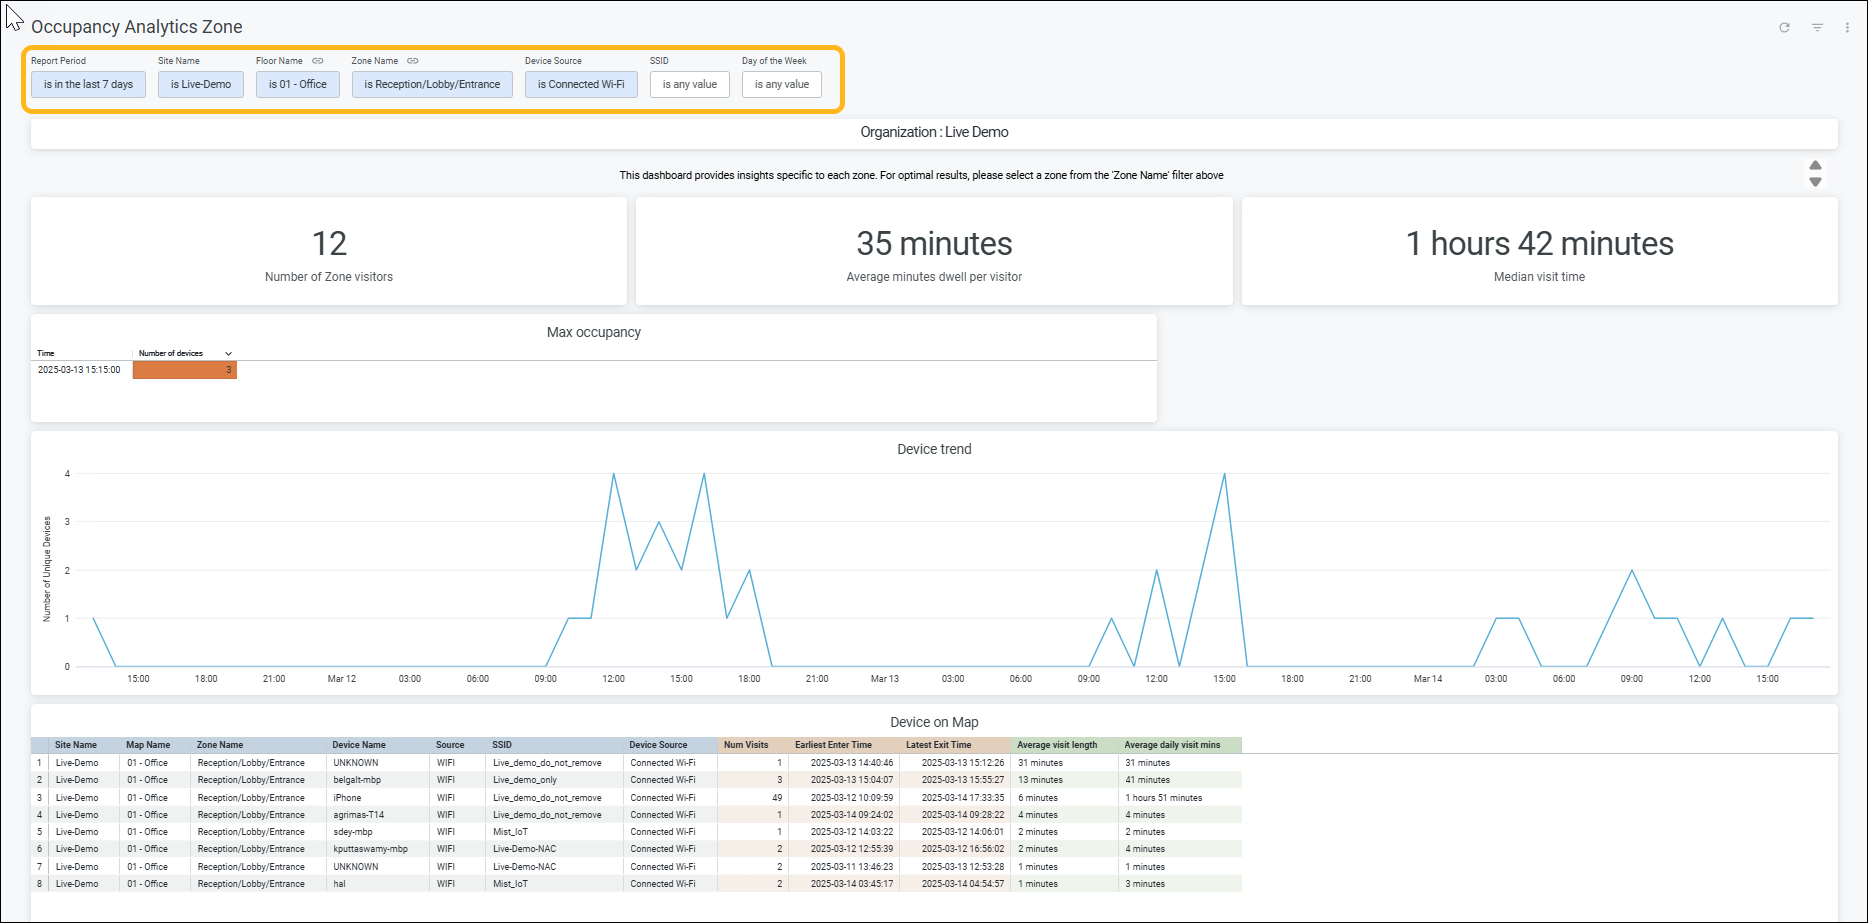
The Zone Occupancy Insights section of the Occupancy Analytics dashboard provides details for zone-level occupancy as shown in the following example. A zone name in blue in the Zone Name column indicates that you can cross-launch the dashboard for that zone. You can then quickly view the details for a specific zone from the organization-level dashboard instead of navigating to the Occupancy Analytics Zone dashboard.
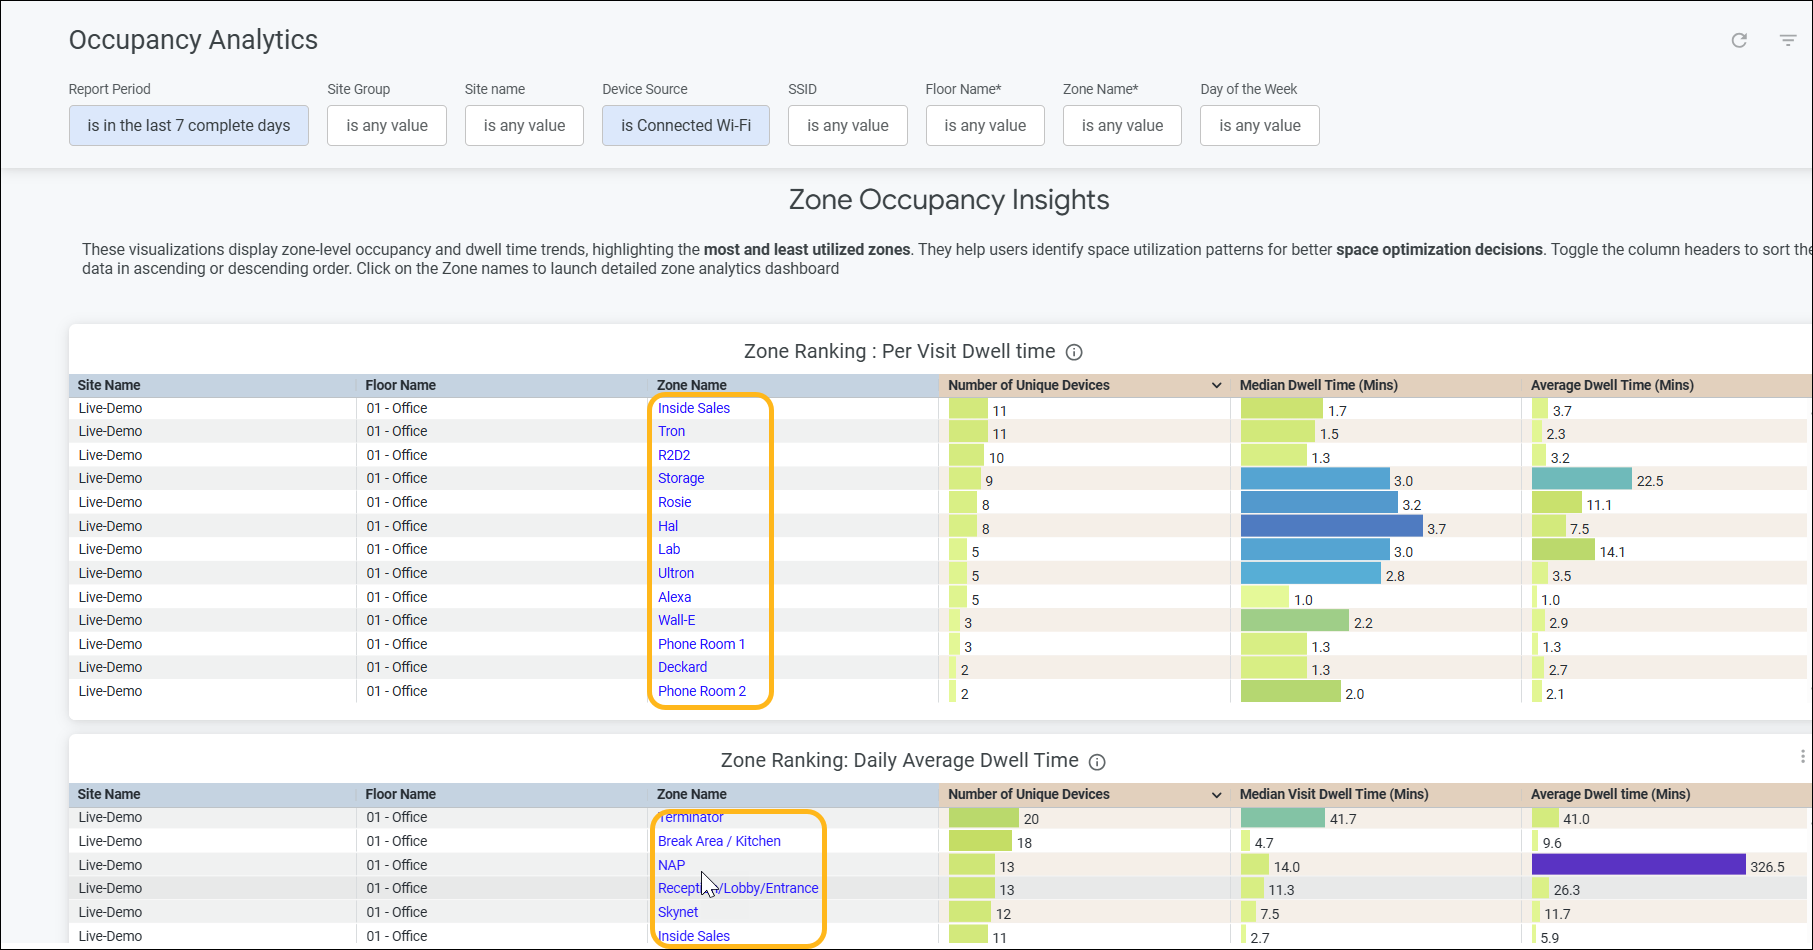
Here's the zone level dashboard for the Reception/Lobby/Entrance zone launched from the Occupancy Analytics dashboard. You can use the filters to drill down to specifics.