Security Assurance Analytics (IDP, URL Filtering)
Monitory security events based on URL filtering and the Intrusion Detection and Prevention System.
With a Juniper Mist™ Premium Analytics subscription, you can use the Security Assurance Dashboard to gain crucial security insights for Juniper Session Smart™ Routers and SRX Series Firewalls deployed at the WAN Edge. These insights are derived from the URL Filtering and Intrusion Detection and Prevention System (IDS/IPS) events that are generated by Session Smart™ Routers and SRX Series Firewalls.
Features and Benefits
-
Provides insight into IDP and URL Event Trends.
-
Provides top IDP threats with source and Destination IPs.
-
Provides top URL Blocked events with Source and Destination IPs.
-
Generates details about the devices and applications that use the network's bandwidth.
Before You Begin
-
Refer to the Juniper Mist WAN Configuration Guide for the WAN configuration details.
-
See Mist Premium Analytics Trial License to know about license requirements for the Juniper Mist Premium Analytics dashboard.
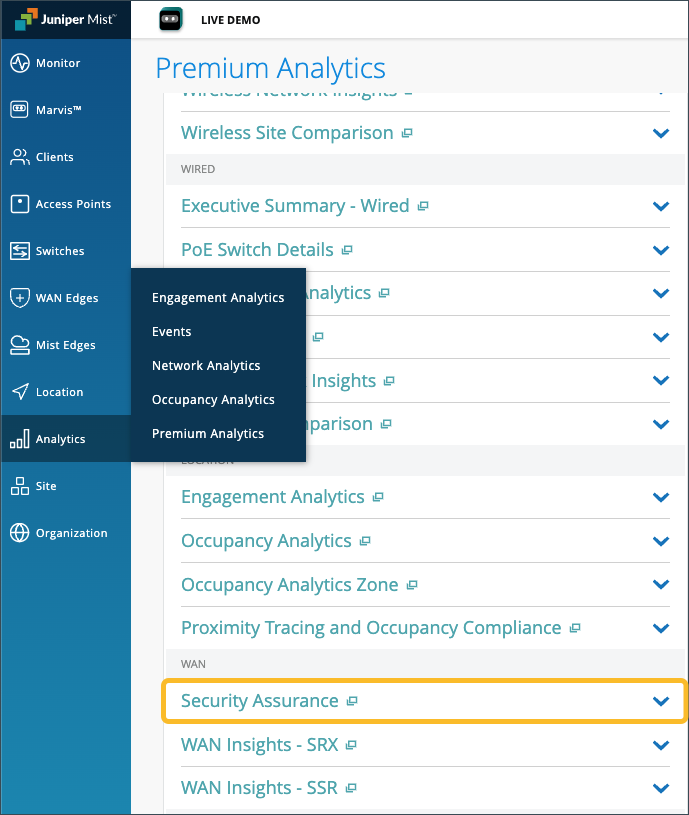
- Become familiar with the options available on the Juniper Mist Premium Analytics dashboard. See Figure 3.
Access Security Assurance Dashboard
You can access the Security Assurance Dashboard by navigating to the Juniper Mist portal, then click Analytics > Premium Analytics > Security Assurance (IDP, URL Filtering).
You can use the filter options available at the top of the page to view specific information.
-
Click Timeframe and select a time range.
-
Filter by Site Name, Hostname, and Attack Name.
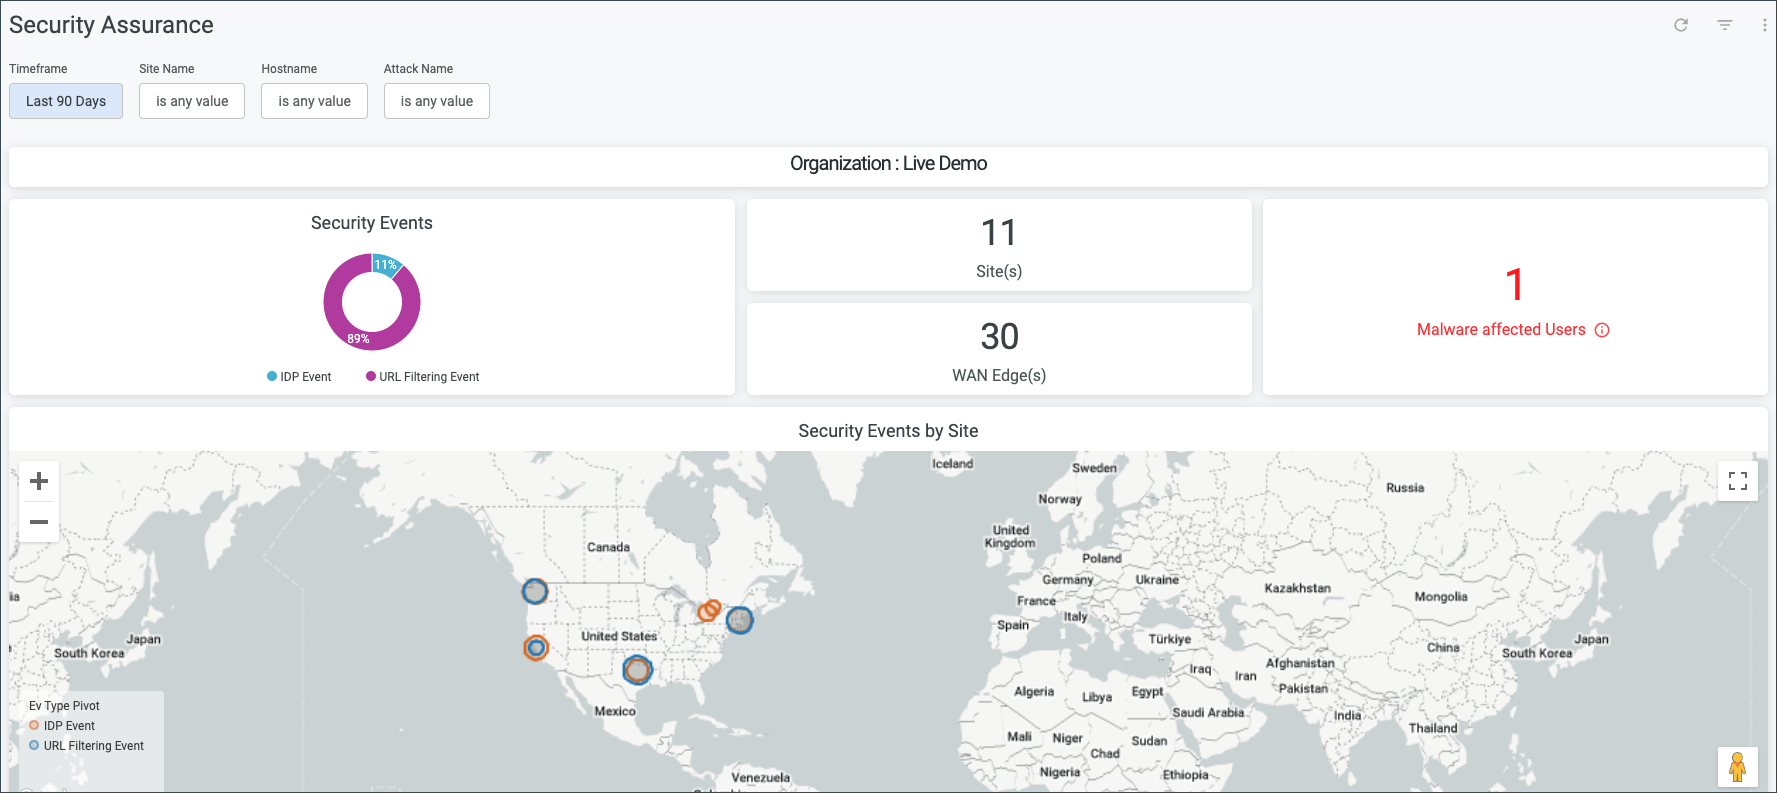
Security Assurance - Tiles
The Security Assurance dashboard includes various tiles to provide an overview of security insights by displaying the percentage of Security Events by type, number of deployment sites, number of deployed WAN Edge devices, number of Malware affected Users, and Security Events by Site.
You can also use the filter options available at the top of the page to view specific information.
-
Click Timeframe and select a time range.
-
Filter by Site Name, Hostname, and Attack Name.
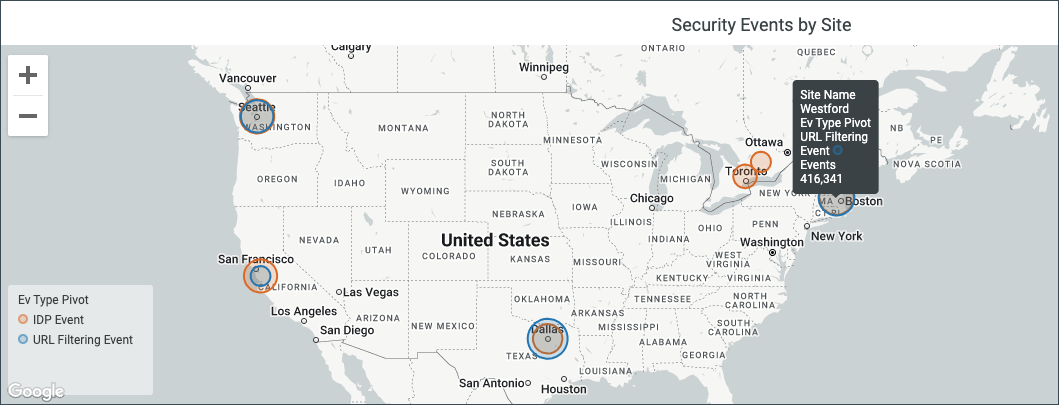
Hover over a location on the Security Events by Site map to see more detailed security information about the site. You can use the plus and minus sign buttons in the top left corner of the map, or double-click the map to zoom in, which will give you a more detailed view of the map.
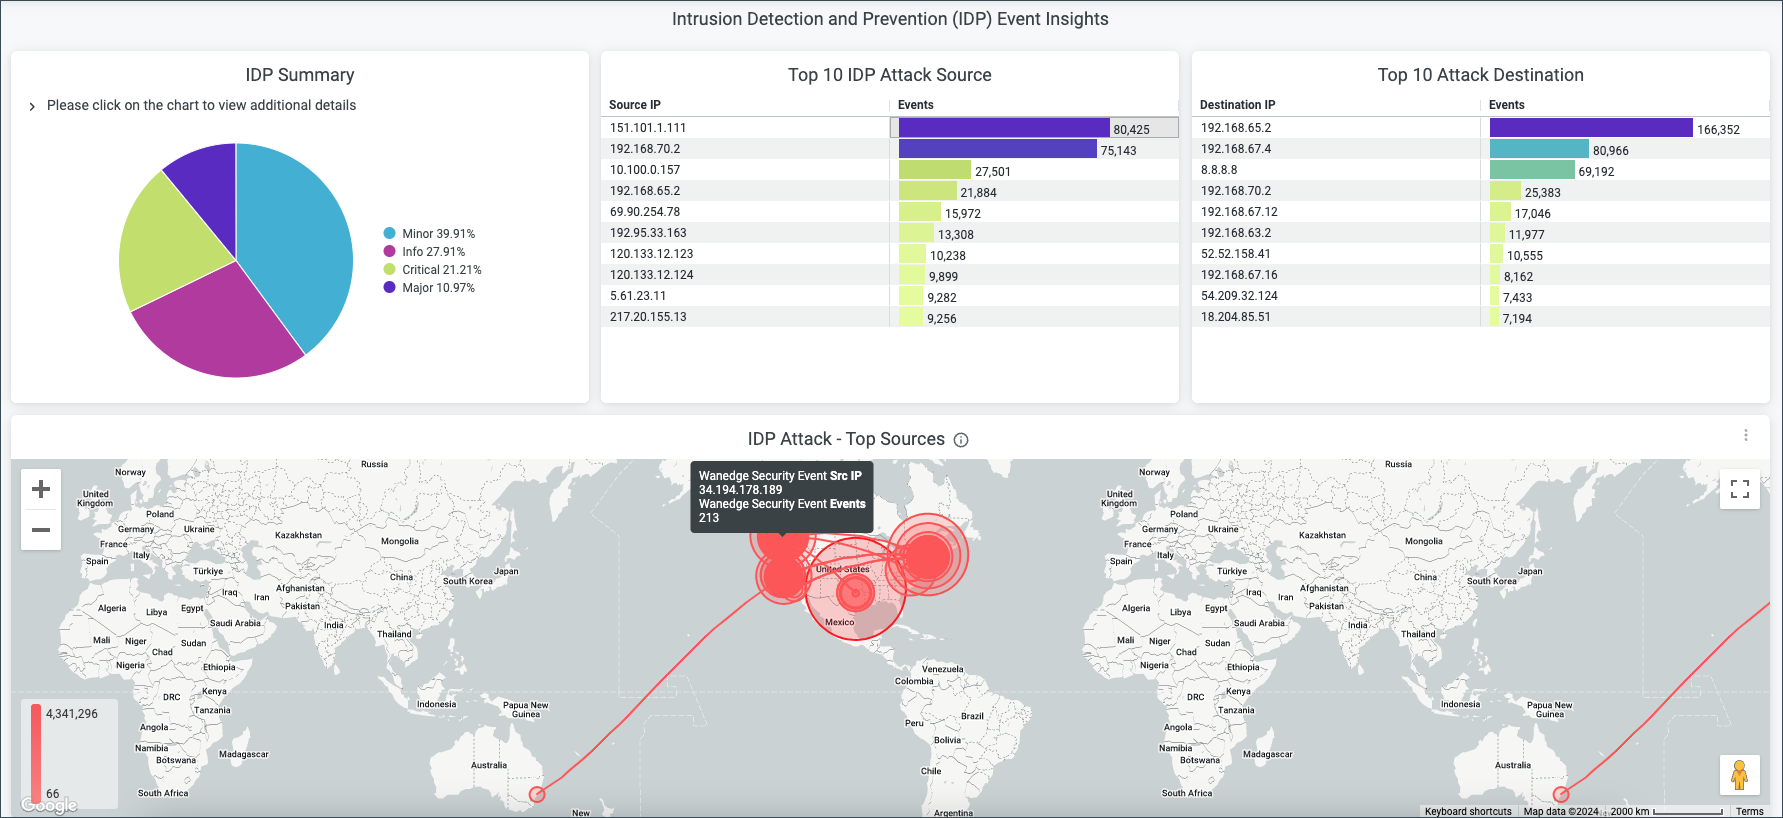
Intrusion Detection and Prevention (IDP) Event Insights
Intrusion detection monitors events in your network and analyzes them for indications of potential incidents or threats to your security policies. Intrusion prevention is the process of performing intrusion detection and then stopping any detected incidents. For more information, see the following:
The Intrusion Detection and Prevention (IDP) Event Insights section displays the following information:
-
IDP Summary — A pie chart that displays the percentage of IDP event types. You can click on the chart to see the number of events contributing to the percentage.
-
Top 10 IDP Attack Source — This displays the top 10 attack sources (shows the source IP address of the IDP attacks) as well as the number of IDP events caused by the source.
-
Top 10 Attack Destination — This displays the top 10 attack destinations (shows the destination IP address of the attacks) as well as the number of IDP events for a given destination.
-
IDP Attack Top Sources — The map displays the locations of the top sources of IDP attacks. Hover over a location on the map to see more detailed security information about the attack such as the source IP address and number of events.
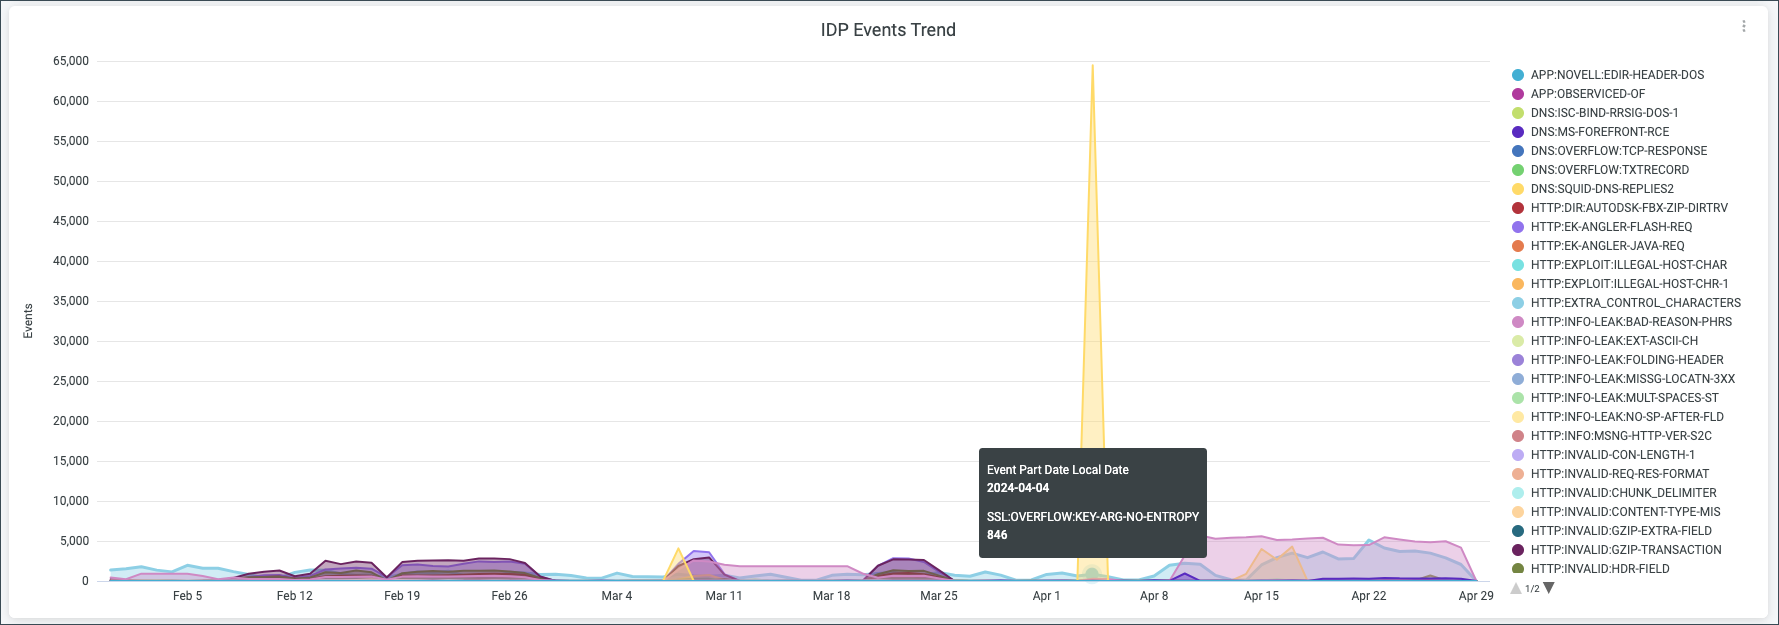
IDP Events Trend
The IDP Events Trend tile displays a graph for the IDP events that have occurred over a period of time. You can hover over the graph to get more details about the event that occurred at a particular time and date. On the right hand side of the chart, you can see the attack name. The color next to the attack name is also represented on the graph.
IDP Event Details and URL filtering Event Insights
The IDP Event Details tile displays detailed information about an attack such as the Attack Name, Severity, Application name, Action, transport layer protocol, and number of events.
The URL filtering Event Insights section displays the following information:
-
Top URL Blocked Events by Application — A pie chart that displays which applications are accounting for the largest percentage of URL blocked events. You can click on the chart to see more details such as the name of the application responsible and the number of events. You can also look to the right of the chart to see the application names and what percentage of URL Blocked Events they account for.
-
Top 10 Source IPs for URL Blocked Events — This displays the top 10 source IP addresses for URL Blocked Events as well as the number of URL Blocked Events for each source.
-
Top 10 Destination IPs for URL Blocked Events — This displays the top 10 destination IP addresses for URL Blocked Events and also shows the number of IDP events for each destination.

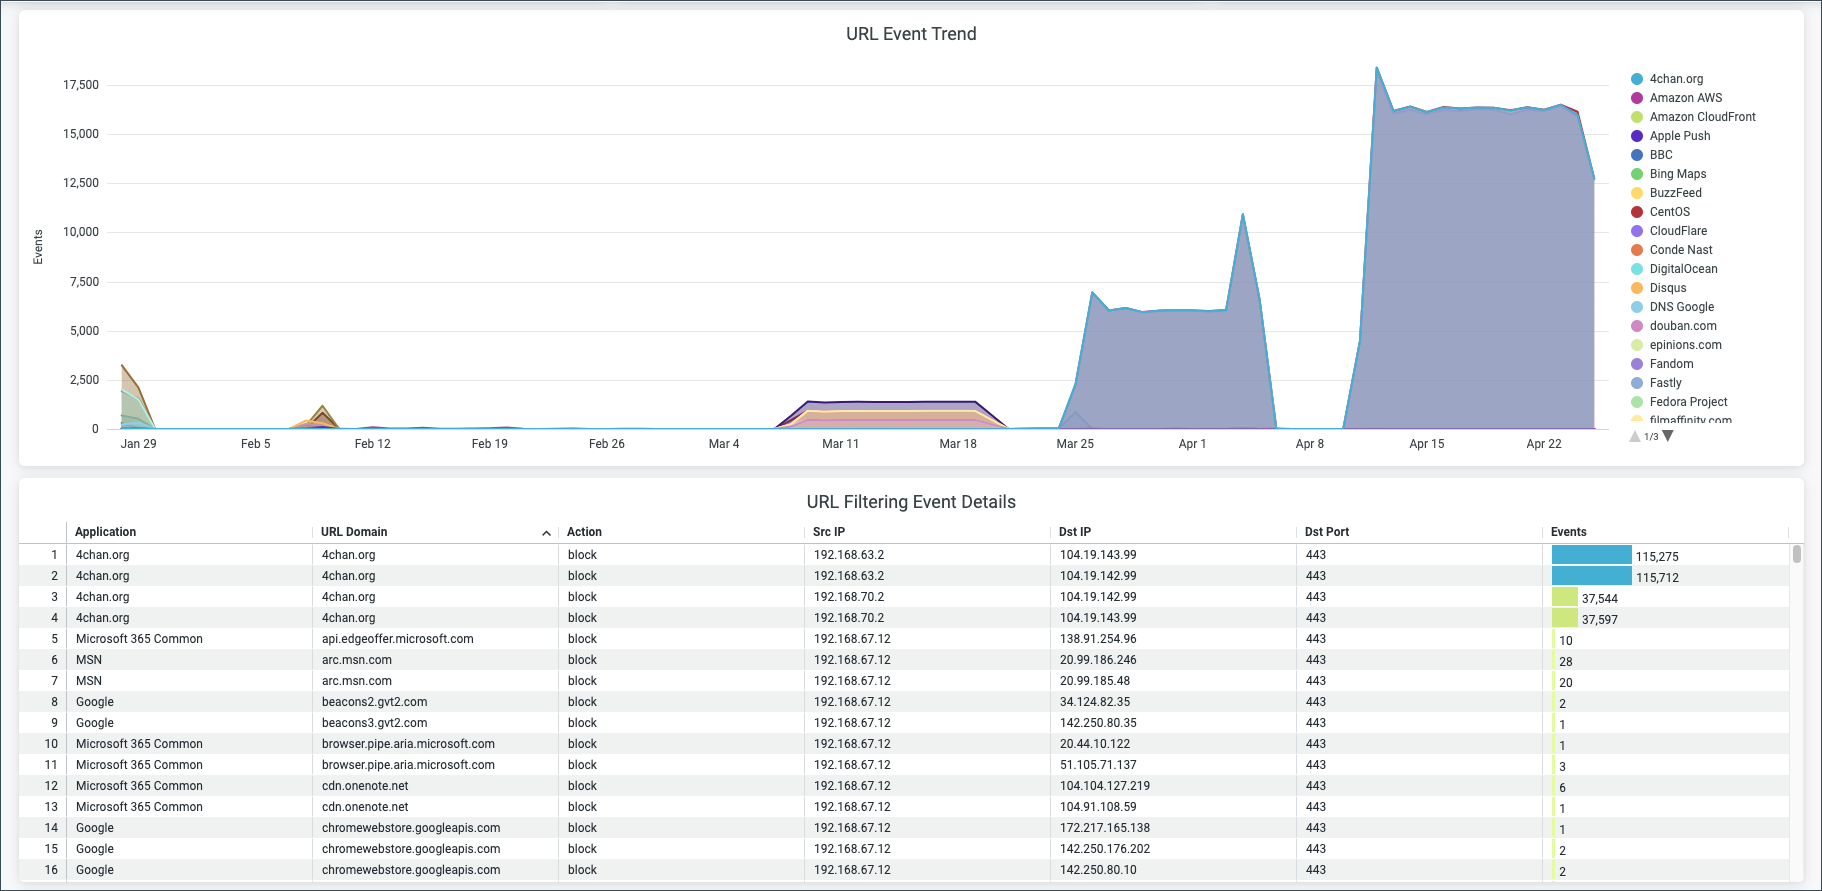
URL Events
The URL Event Trend tile shows the number of URL events over a period of time. You can hover over the graph to get more details about the event that occurred at a particular date. On the right hand side of the chart, you can see the application name. The color next to the application name is also represented on the graph.
The URL Filtering Event Details tile displays detailed information about a URL Filtering Event such as the Application name, URL Domain, Action, Source IP, Destination IP, Destination Port, and number of events.
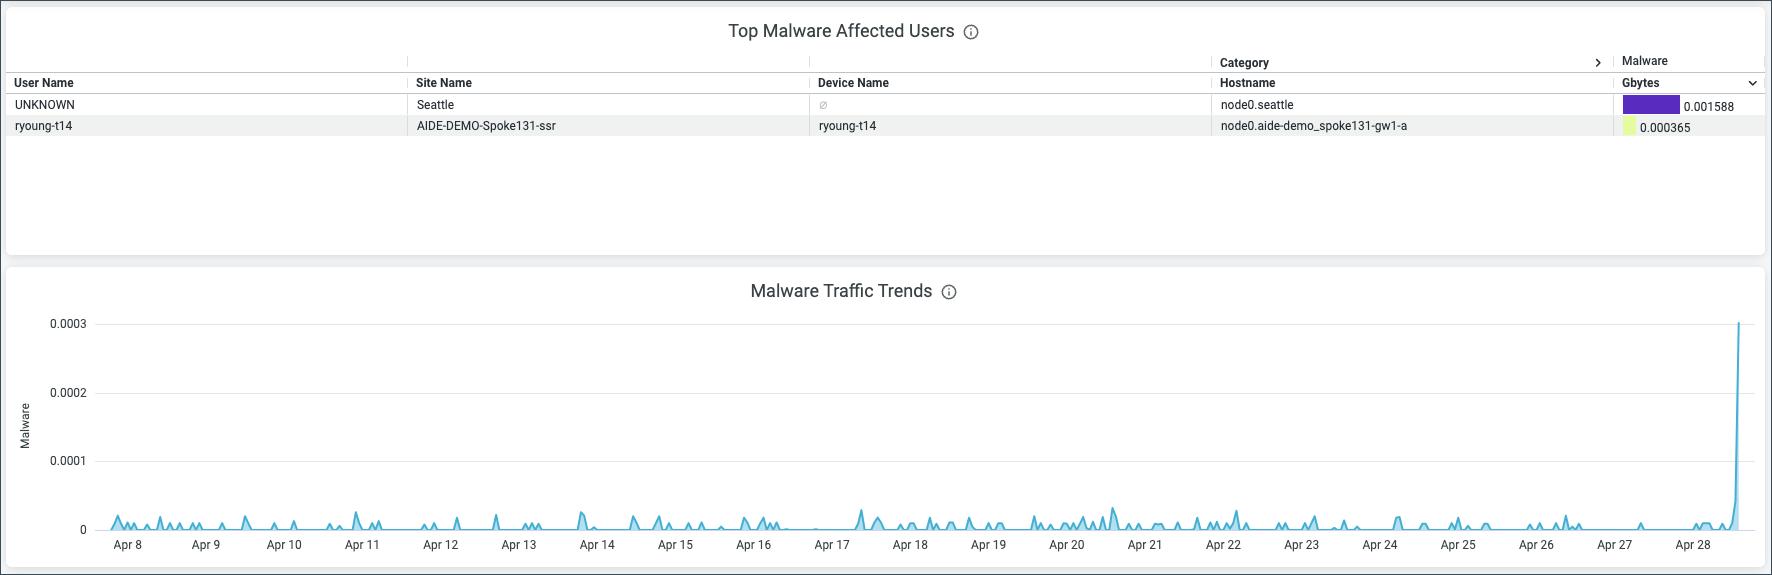
Top Malware Affected Users and Malware Traffic Trends
The Top Malware Affected Users tile displays the User Name, Site Name, Device Name, Category/Hostname, and the amount of data consumed by the malware.
The Malware Traffic Trends tile displays a graph of malware traffic trends over time. You can hover over the graph to get more details about the malware traffic that occurred at a particular time and date.
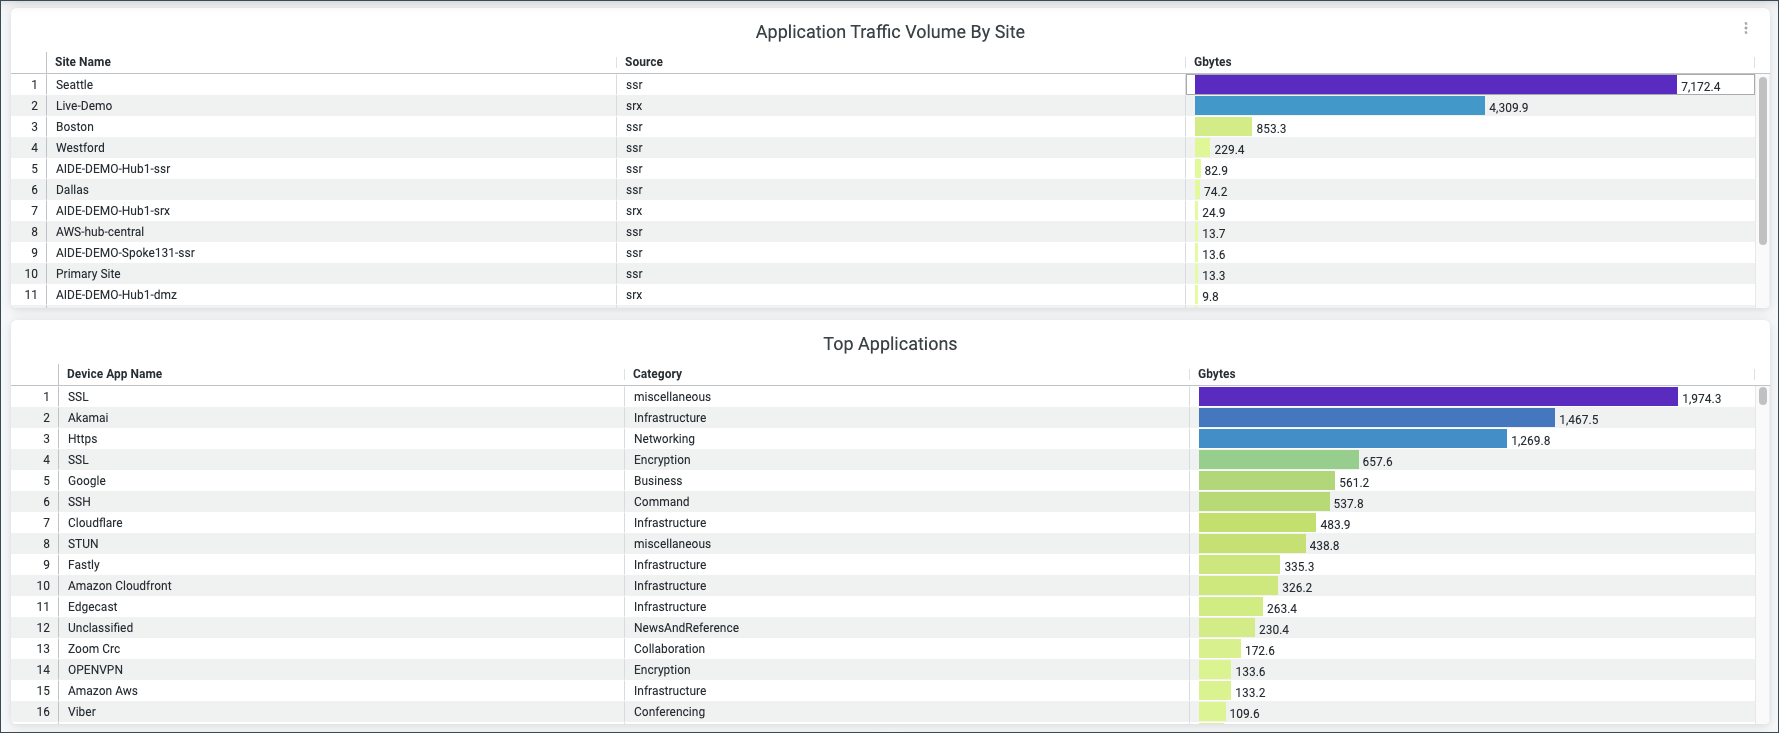
Application Traffic Volume By Site and Top Applications
Application Traffic Volume
The Application Traffic Volume By Site tile displays information pertaining to application traffic volume such as Site Name, Source (Session Smart Router or SRX), and Gbytes (gigabytes) to represent the volume of the traffic.
The Top Applications tile displays the bandwidth usage by all the applications in a site.
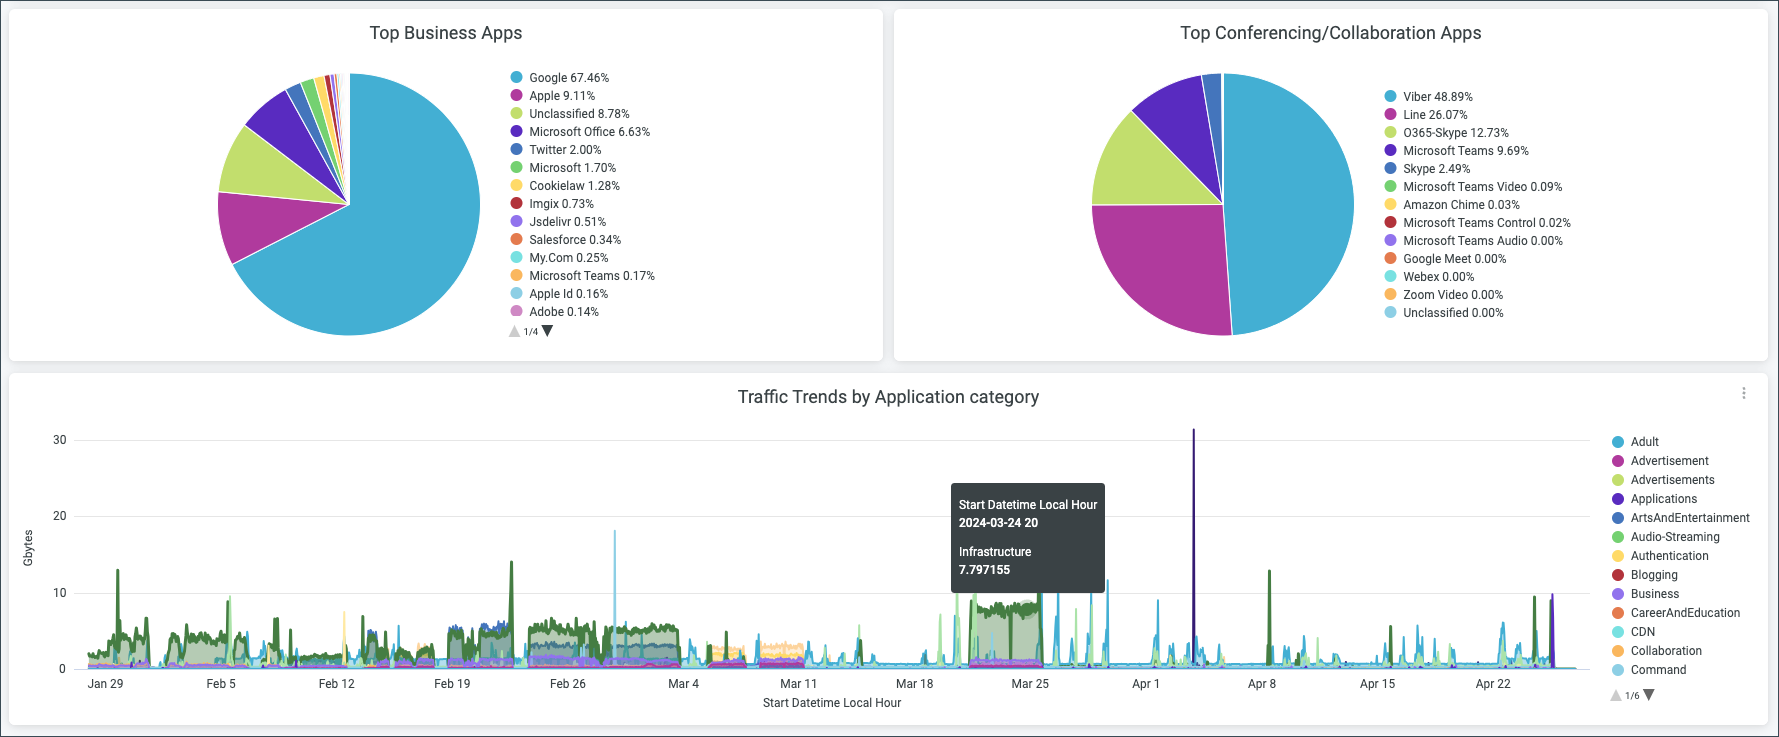
Top Business Apps, Top Conferencing/Collaboration Apps, and Traffic Trends by Application Category
The following tile display application insight information about bandwidth consumed by a particular application or application category. You can spot the top applications in terms of various metrics by viewing these charts:
- The Top Business Apps — This chart displays the bandwidth usage by all the applications belonging to a category of business.
- The Top Conferencing/Collaboration Apps — Displays a chart for the bandwidth usage by all the applications belonging to a category of collaboration.
- The Traffic Trends by Application category — This chart displays
the bandwidth usage by all the application categories. Hover over the chart to get more
detailed information.