AP Insights
Analyze AP usage by viewing client device information and statistics about access point (AP) traffic and client connection trends.
Features and Benefits
-
Generates insights about client session trends and session distribution across all APs in your site. With these insights, you can spot the APs that experience problems.
-
Provides data on the amount and types of traffic passing through AP.
-
Reports on the clients attached to the AP along with client device details.
Before you Begin
- Familiarize with the options available on your dashboard. See Figure 3.
-
See Juniper Mist Wireless Configuration Guide for wireless configuration details.
-
You need a license for using the Juniper Mist Premium Analytics dashboard. See Mist Premium Analytics Trial License.
Access Wireless Network Insights Dashboard
To access the AP Insights dashboard:
-
In the Premium Analytics page, click AP
Insights.
Figure 1: AP Insights
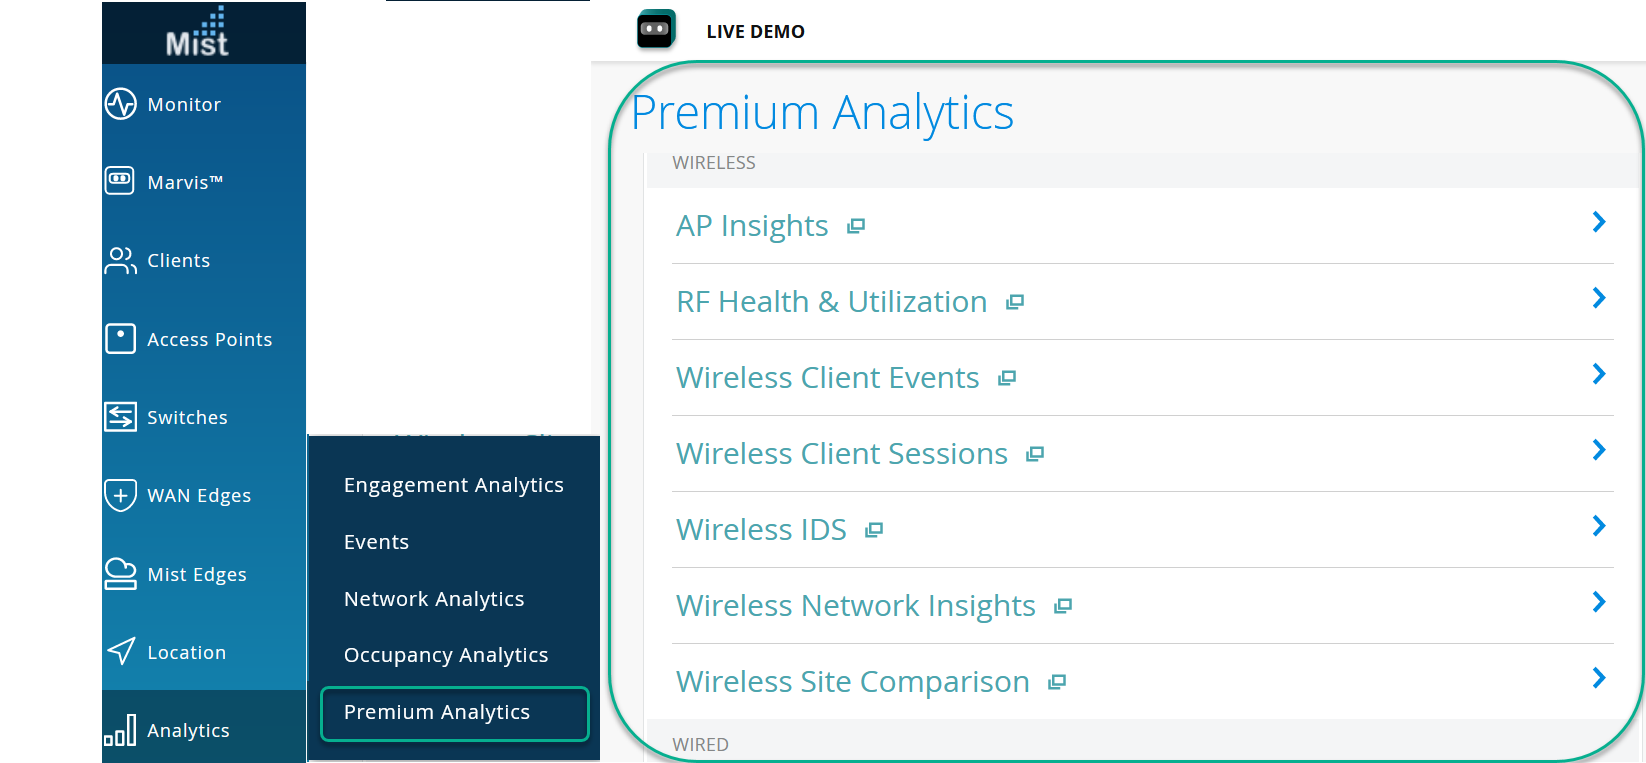 The AP Insights page appears.
AP Insights Tiles
Traffic by AP
The Traffic by AP tile shows the volume of traffic usage by APs for the selected duration.
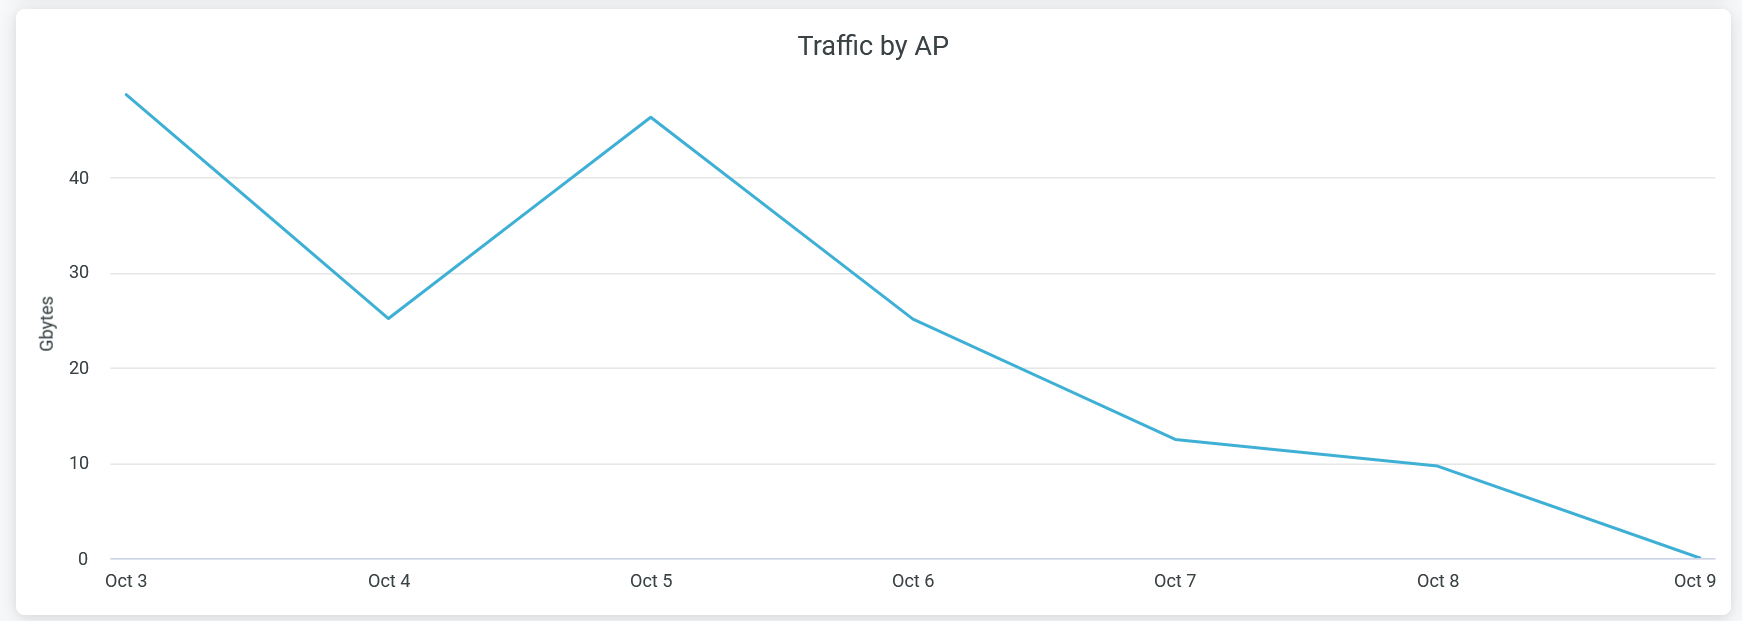
Hover over the chart to view the volume of traffic usage by APs at a given time.
Click the chart to open a new window that displays the table listing all APs with their traffic usage details. You can download the table using the Download option.
Clients by AP
The Clients by AP tile shows the client connection trends for the selected duration.
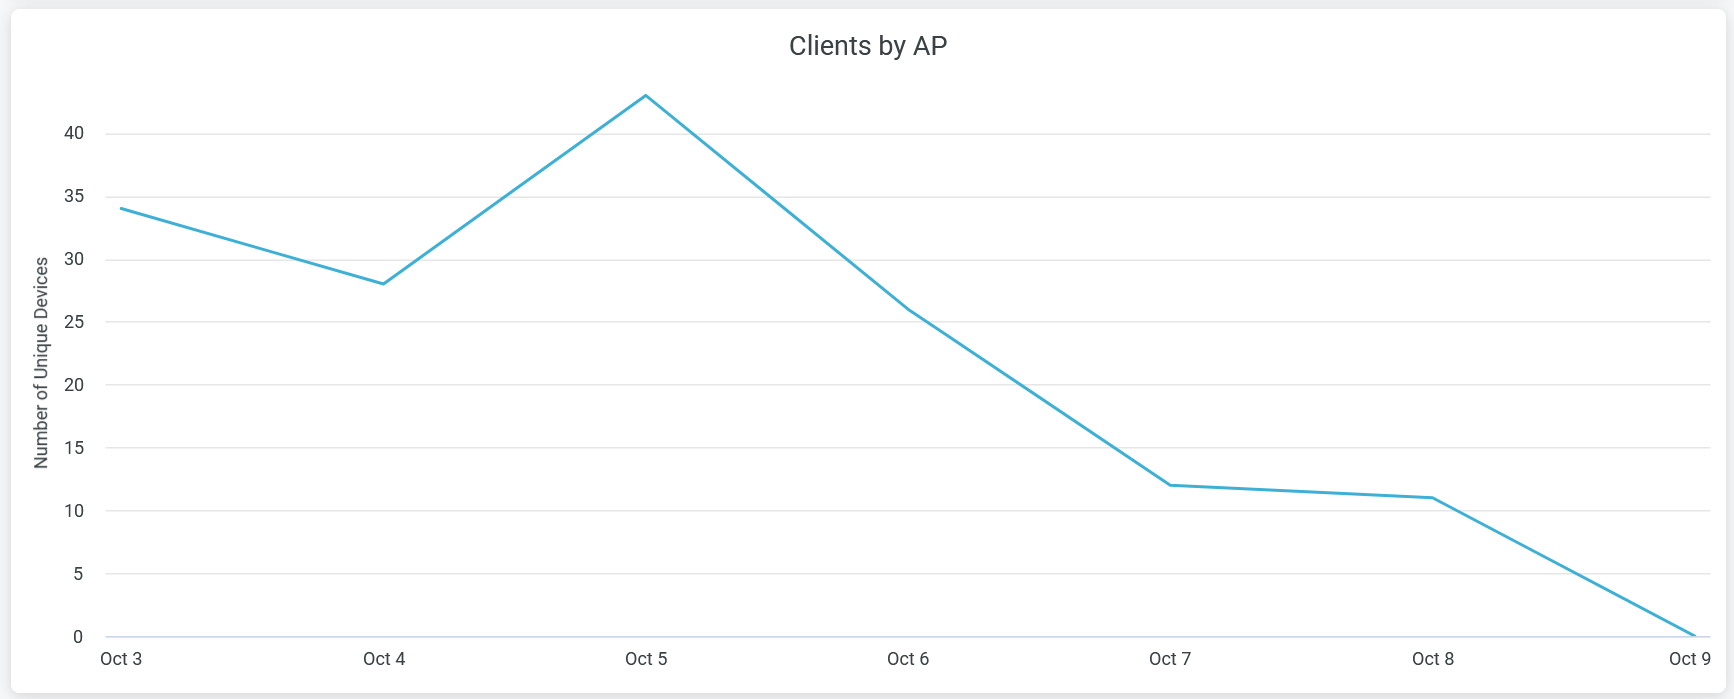
Hover over the chart to view the number of unique client devices connected to APs at a given time.
Click the chart to open a new window that displays the table listing all client devices names, VLAN, service set identifier (SSID), and APs details. You can download the table using the Download option.
Client Statistics
The tile displays analytics for client devices, ranking according to the volume of traffic.
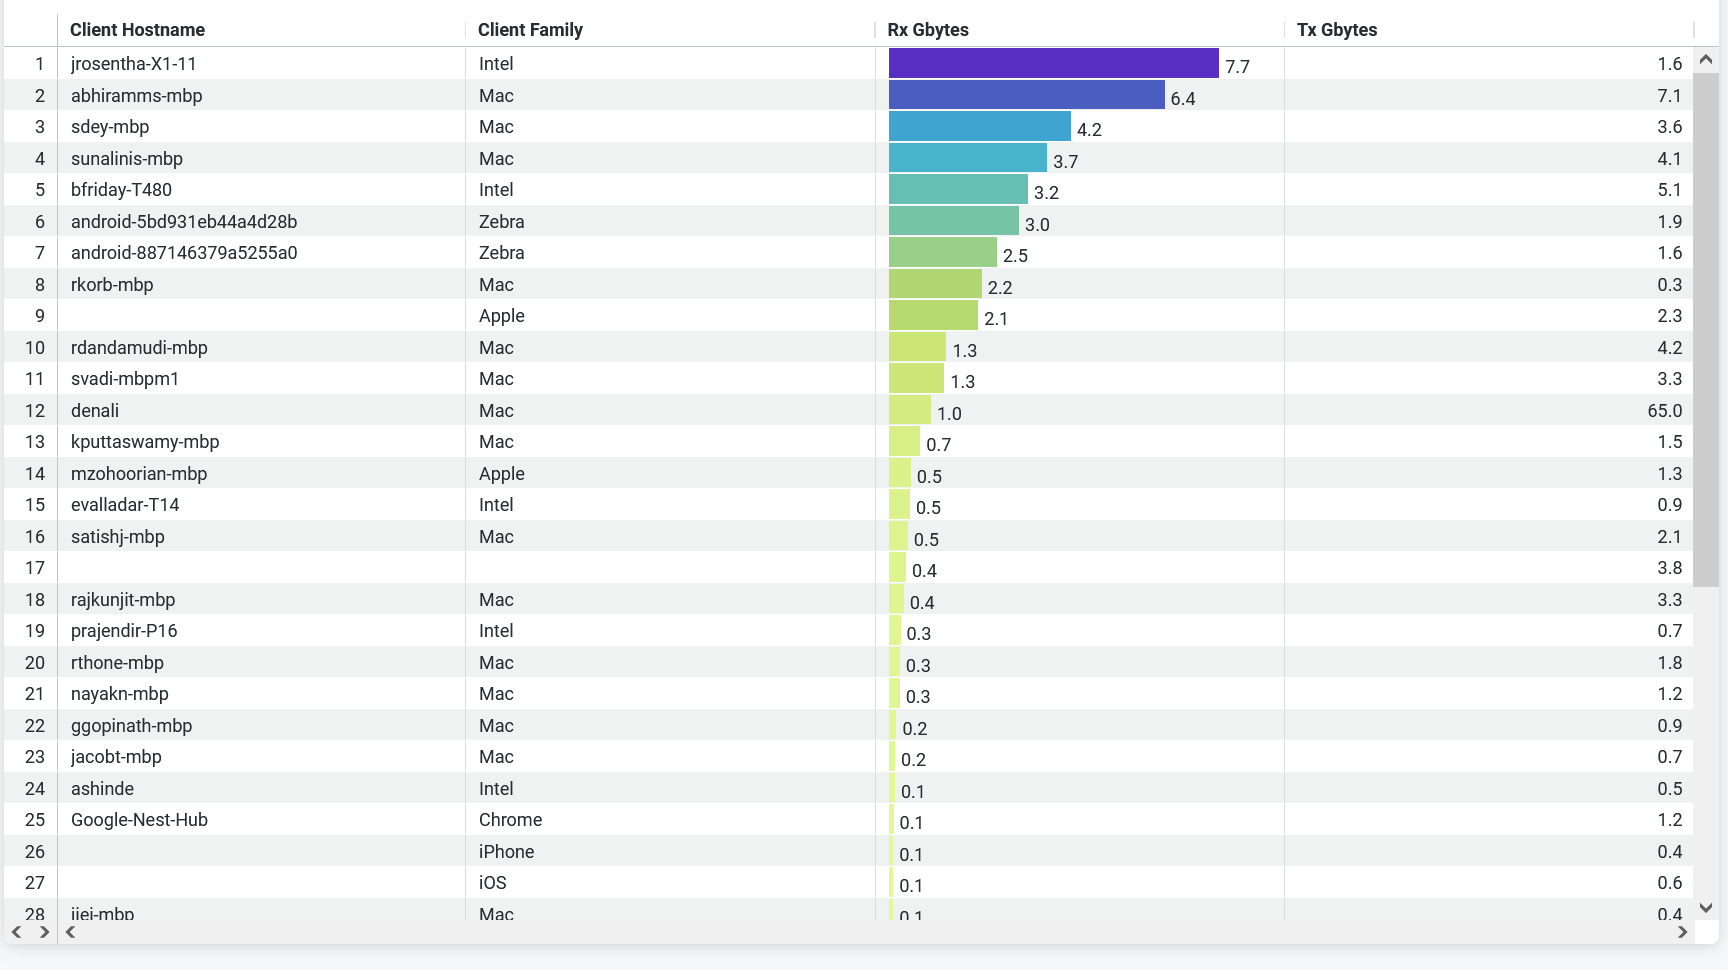
You can view the following details on the tile:
- Client Hostname—Hostnames of client devices.
- Client Family—Device type, model, manufacturer, and operating system of the device.
- Rx Bytes (Gbps)—Volume of the transmitted traffic.
- Tx Bytes (Gbps)—Volume of the received traffic.