Wireless Client Session
View information about wireless traffic and related performance trends.
You can also see analytics about sites, service set identifiers (SSIDs), client connections, access points (APs), and guest connections of your network. You can use the information to monitor a specific site, wireless LAN (WLAN), client, access point, or SSID and identify issues in the wireless network of your organization.
Features
-
Generates insights on organization-wide client session trends and session distribution views by site, WLAN, AP, client type, and operating system (OS) You can use these insights to spot the network areas that experience problems.
-
Provides guest session details including registration data.
-
Gives visibility on the devices and applications that use the network's bandwidth.
Before you Begin
-
Refer to the Juniper Mist Wireless Configuration Guide for wireless configuration details.
-
Refer to Mist Premium Analytics Trial License to know about license requirements for the Premium Analytics dashboard.
- Become familiar with the options available on the Juniper Mist Premium Analytics dashboard. See Figure 3.
Access Wireless Client Session Dashboard
Wireless Client Session Reports
The Wireless Client Sessions dashboard includes various tiles that provide graphical representations of analytics at a granular level. On the tiles, you can see the total number of clients over the selected time period and information about:
- Clients with the highest number of sessions
- APs that support the highest number of client sessions
- Devices grouped by client session counts
- WLANs
- Sites
- Wireless Client Sessions Chart
- Top Sites
- Top WLANs
- Top APs
- Top Client Types
- Client Session Details
- Guest Client Login Details
- Application Trend
- Application by Clients
Wireless Client Sessions Chart
The tile displays analytics about a wireless client connection in a graphical format for the selected period of time.
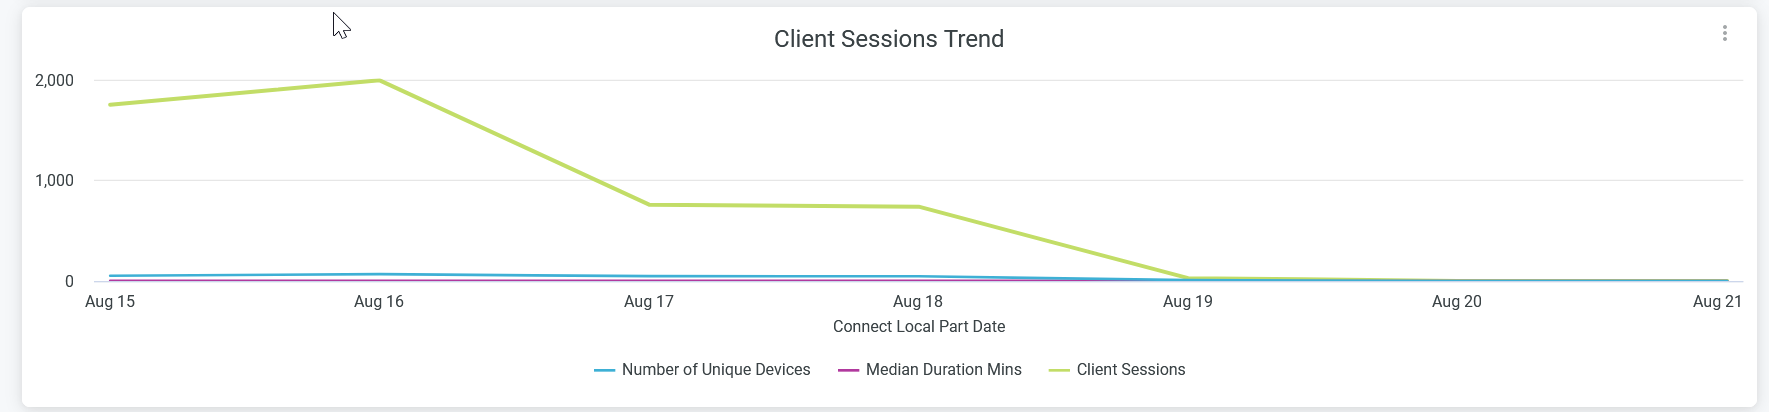
When you hover over the chart, you see a pop-up message with the actual values of the sessions at the given time. When you click the chart, you see the list of hostnames associated with the session. Use this option to instantly get the details of all the wireless clients connected in your organization.
Top Sites
The tile displays analytics of sites, arranged according to the number of client sessions.
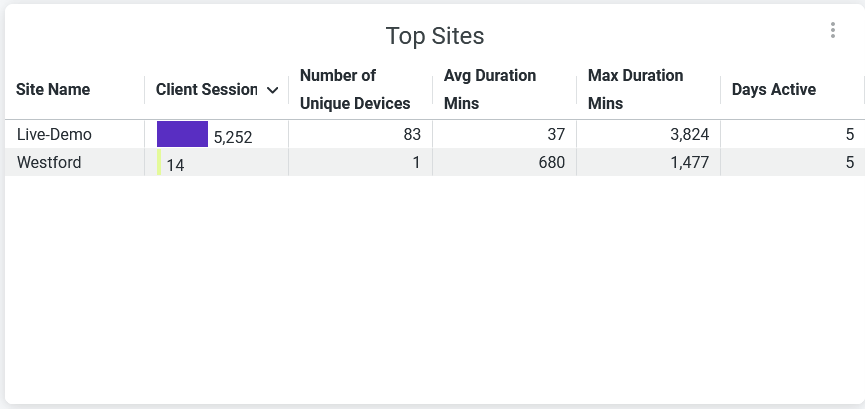
The Top Sites tile provides:
- Number of client sessions for a site.
- Number of unique client devices connected to a site.
- Average duration of client sessions for a site.
- Maximum duration of client sessions for a site.
- Number of days for which a site experiences active client sessions.
Top WLANs
The tile displays analytics of SSIDs, arranged according to the number of client sessions.
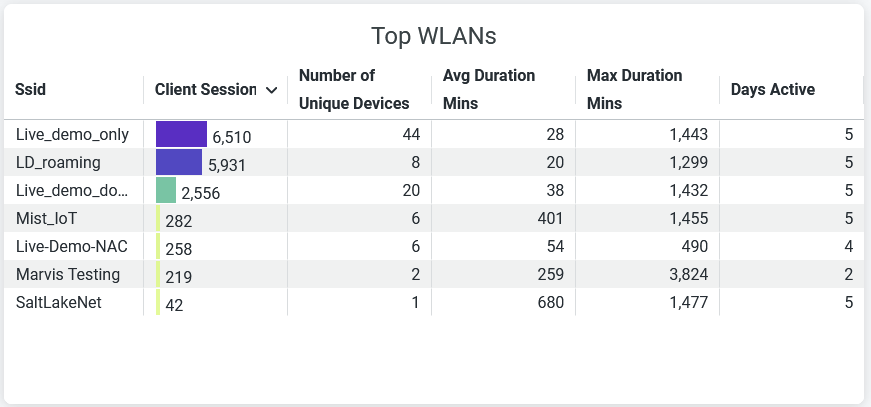
The Top WLANs tile provides:
- Number of client sessions for an SSID.
- Number of unique devices connected to an SSID.
- Average duration of client sessions for an SSID.
- Maximum duration of client sessions for an SSID.
- Number of days for which an SSID experiences active client sessions.
Top APs
The tile displays analytics for APs that you can sort based on the number of client sessions.
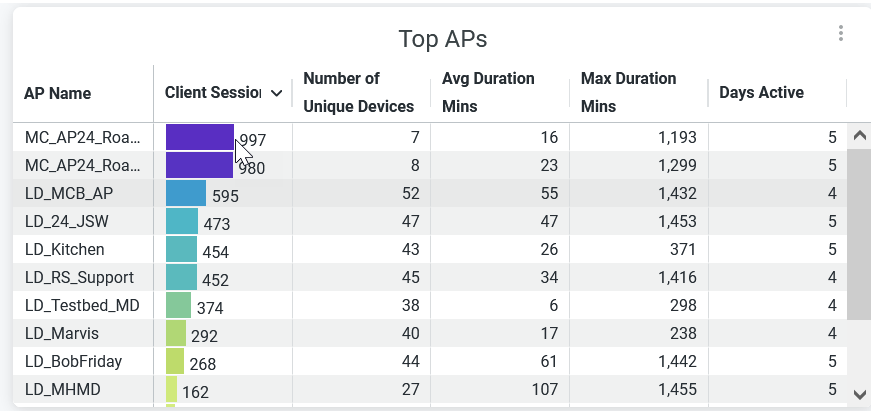
The Top APs tile provides :
- Number of client sessions for an AP.
- Number of unique devices connected to an AP.
- Average duration of client sessions for an AP.
- Maximum duration of client sessions for an AP.
- Number of days for which an AP experiences active client sessions.
Top Client Types
The tile displays analytics for client device types that you can sort based on the number of client sessions.
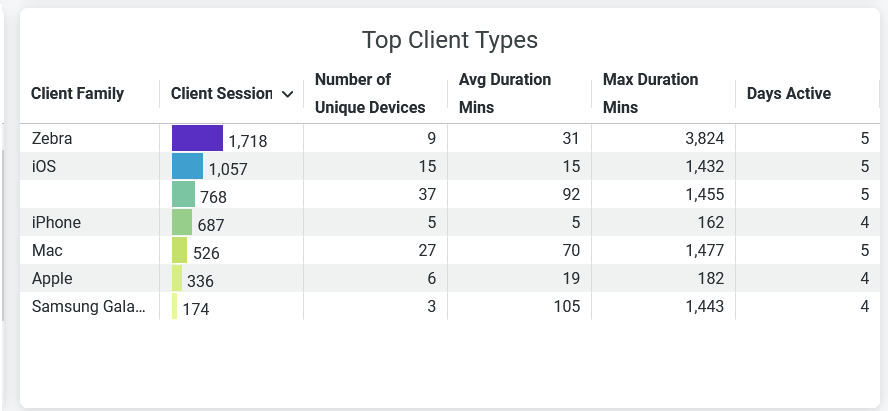
The Top Client Types tile provides:
- Number of client sessions for a client family
- Number of unique devices connected to a client family
- Average duration of client sessions for a client family
- Maximum duration of client sessions for a client family
- Number of days for which a client family experiences active client sessions
Client Session Details
The tile displays information about client sessions that run on a site. You can use this tile to quickly access client device information, such as location, connectivity, and device details.
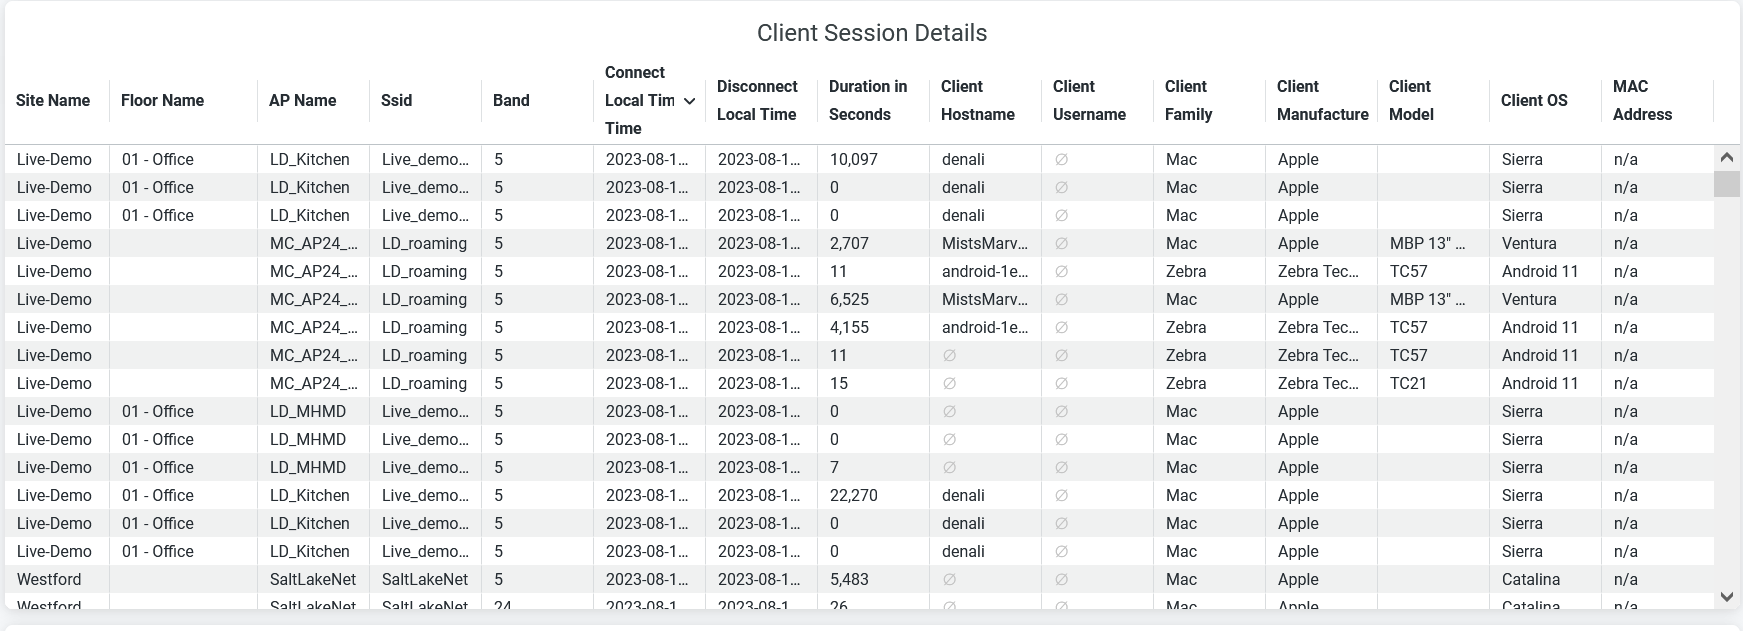
The Client Sessions Details tile provides:
- Site Name—Name of the site where a client device is located.
- Floor Name—Name of the floor where a client device is located.
- AP Name—Name of the AP to which a client device is connected.
- SSID—SSID to which a client device is connected.
- Band—Channel to which a client device is connected.
- Connect Local Time—Time of connection by a client device.
- Disconnect Local Time—Time of disconnection by a client device.
- Duration—Duration for which a client device was online.
- Client Username—Username of a client device.
- Client Hostname—Hostname of a client.
- Client Family—Type of a client device.
- Client manufacturer—Manufacturer of a client device.
- Client model—Model of a client device.
- Client OS—Operating system running on a client device.
- MAC Address—MAC address of a client device.
Guest Client Login Details
This tile displays information about guest wireless connections.. The details include site name, AP name, guest login event time, authorization time, authentication method used, connected SSID, and guest details such as name, e-mail address, and company.
The Guest Client Login Details tile provides:
- Site Name—Network site to which a guest client is connected.
- Floor Name—Floor in a site to which a guest client is connected.
- Event Date/Time—Date and time when the guest client established connection.
- Authorized expiring—Time when authorization expired for a guest client.
- SSID—SSID to which a guest client is connected
- Auth Method—Method used to authorize a guest client.
- Company—Organization name of a guest client.
- Email—E-mail address of a guest client.
- Name—Name of a guest client.
- Mobile—Mobile number of a guest client.
- Sponsor email—E-mail address of the sponsor who provides access to a guest user.
- Access code e-mail—E-mail address to which Juniper Mist sends the access authorization code to a guest user.
Application Trend
This tile displays analytics about client traffic grouped by application categories.
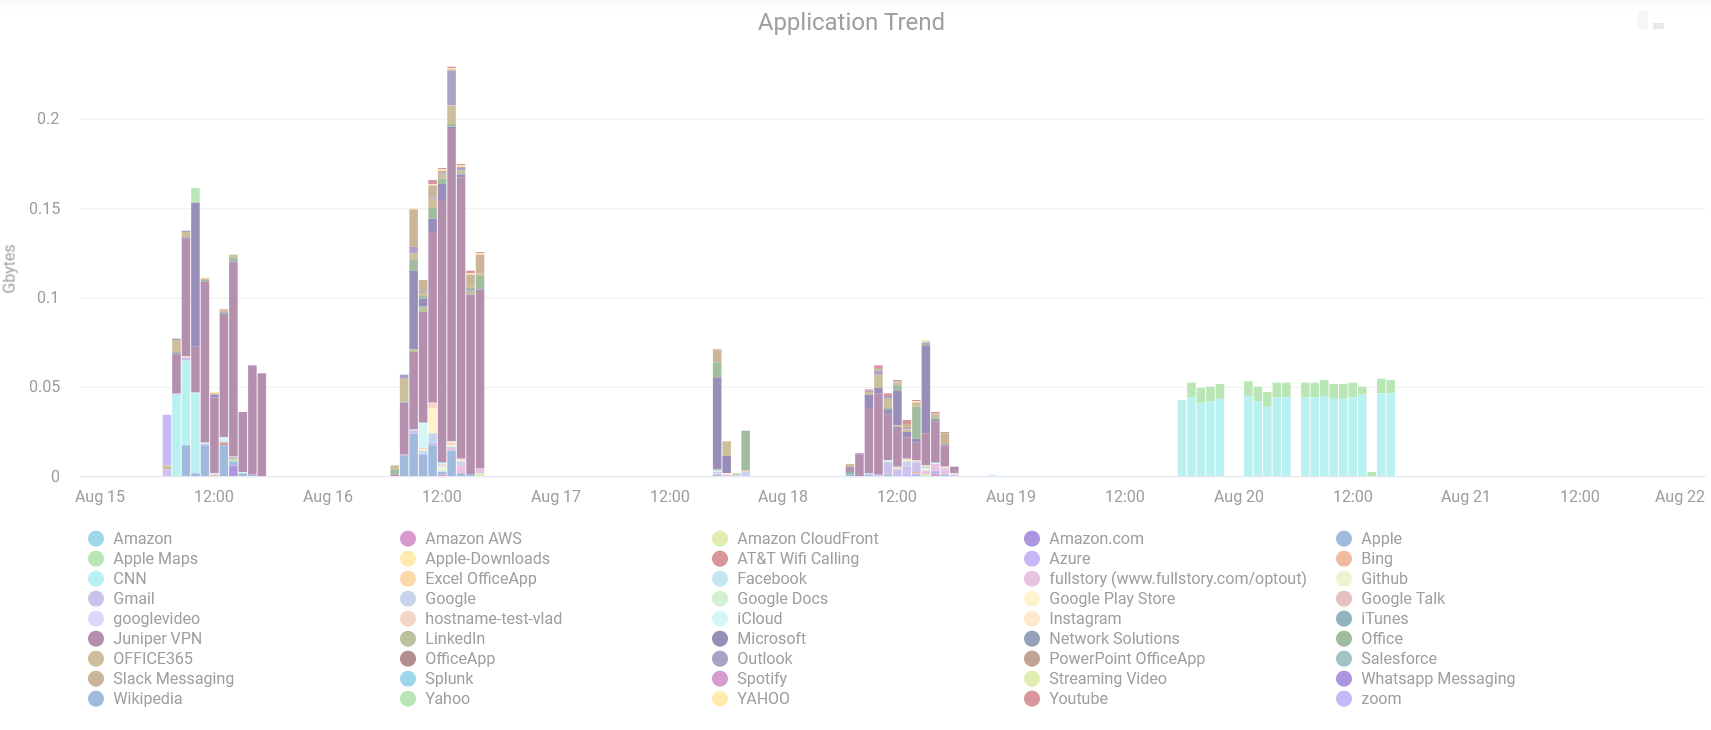
You can place the cursor on the chart to see the application category and the percentage of client traffic that the application receives.
Clicking on an application category in the chart, the system displays the client devices that is using the application and the usage (in gigabytes). When you click an application in the chart, you can see the client devices that use the application and the usage in gigabytes (GB). You can view this information as a graph or as a table. You can click Download to download the table or graph.
Application by Clients
This tile displays analytics about client traffic flow to each of the applications.
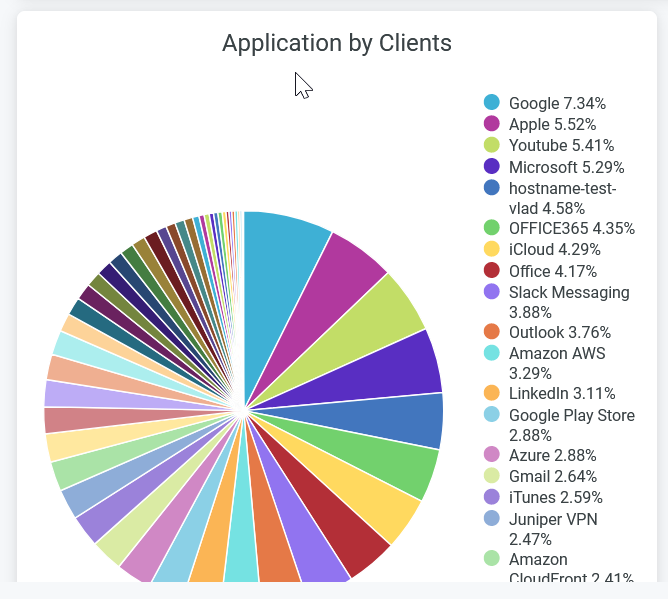
You can place the cursor on the chart to see the application and the percentage of traffic that the application receives.
When you click an application or an application category in the chart, you can see the client devices that use the application or the application category and the usage in gigabytes (GB). You can view this information as a graph or as a table. You can click Download to download the table or the graph.
The chart legend also displays the percentage of traffic that an application receives. To hide an application from the chart and see only the remaining categories, click the application name in the legend.