WAN Insights for SRX Series Firewalls
Monitor metrics for performance, utilization of links, and applications for your SRX Series Firewalls.
Juniper Mist™ WAN Assurance is a cloud service that brings automated operations and service levels to the enterprise access layer at the WAN edge. This cloud service also provides WAN insights for Juniper Networks® SRX Series Firewalls. You can view comprehensive insights about WAN link service-level expectation (SLE) metrics, performance and utilization of links, and application metrics. You can continuously analyze performance and the SLE success rate and avoid any possible experience degradation or outages.
Features and Benefits
-
Provides operational visibility into user experiences with WAN SLEs
-
Generates insights on WAN visibility for link and application quality of experience (QoE)
-
Provides traffic metrics for WAN edge devices, interfaces, or WAN zones.
-
Generates details about the devices and applications that use the network's bandwidth
Before You Begin
-
Refer to the Juniper Mist WAN Configuration Guide for the WAN configuration details.
-
Understand about WAN Service Level Experience (SLE).
-
See Mist Premium Analytics Trial License to know about license requirements for the Juniper Mist Premium Analytics dashboard.
- Become familiar with the options available on the Juniper Mist Premium Analytics dashboard. See Figure 3.
Access WAN Insights-SRX Dashboard
-
On the Premium Analytics page, click WAN Insights -
SRX.
Figure 1: WAN Insights- SRX
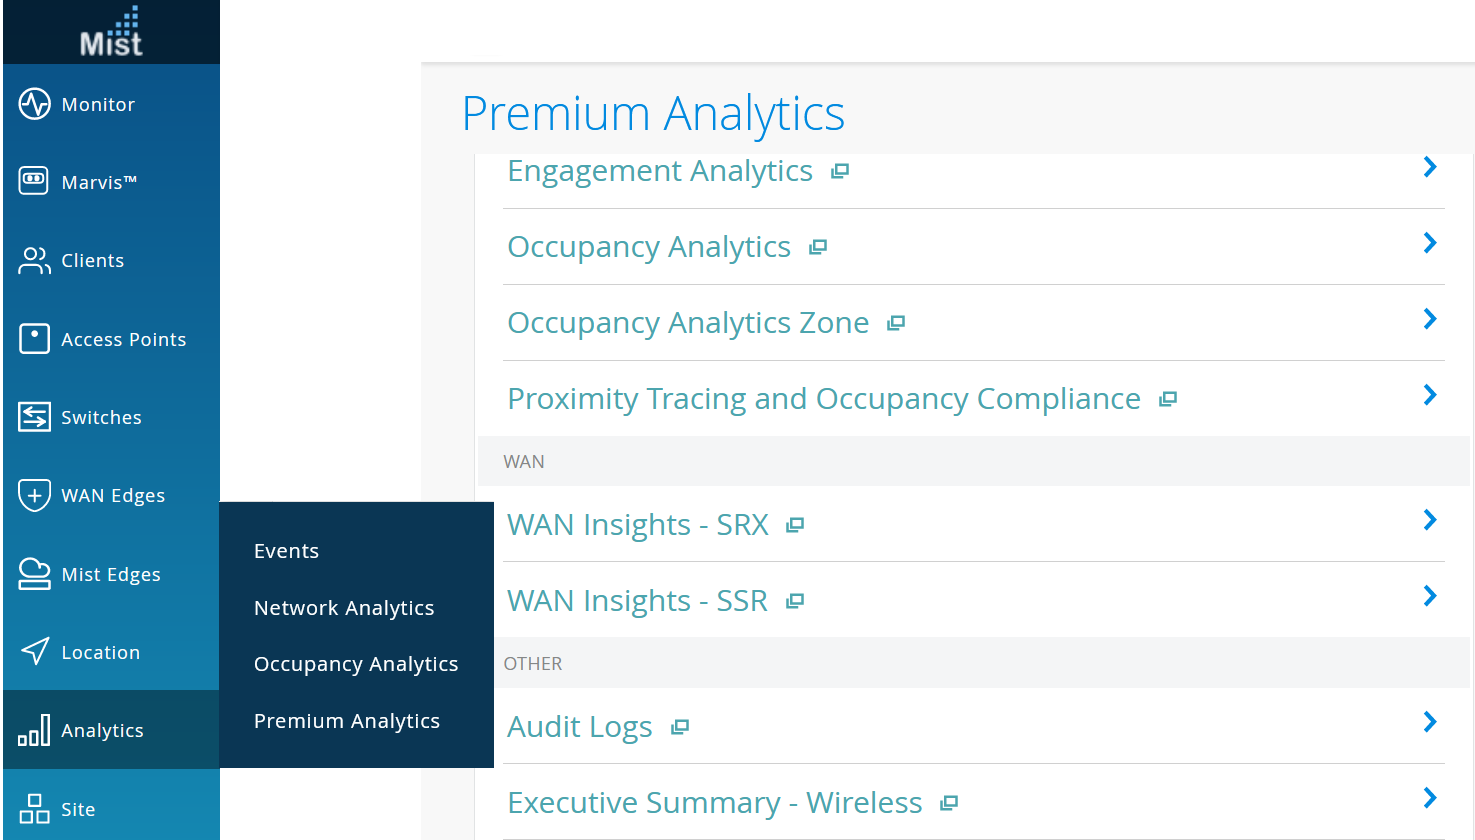 The WAN Insights - SRX page appears.
WAN Insights - SRX Tiles
The WAN Insights - SRX dashboard includes various tiles that provide WAN performance data in graphical formats. You can use the dashboard to get an overview of the deployed WAN edge devices.
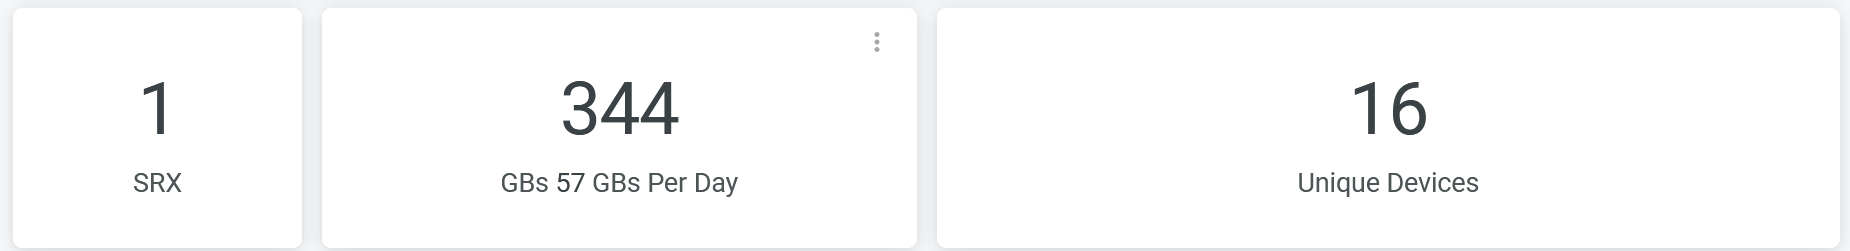
The tile displays a summary of the deployed WAN edge devices and traffic performance.
According to Figure 2, the WAN configuration includes one SRX Series Firewall deployed as a WAN edge device in the MAP. A total of 16 interfaces are active and traffic traversing the network is 344 GB. Hover over the SRX section or the Unique Devices section of the tile to see the interface statistics.
- Sites
- SLE Summary
- Link Utilization
- Link Metrics
- Link Metrics Trend
- Traffic Insights
- Applications Insights
- Devices By Zone
Sites
Figure 3 shows location of WAN edge device site.
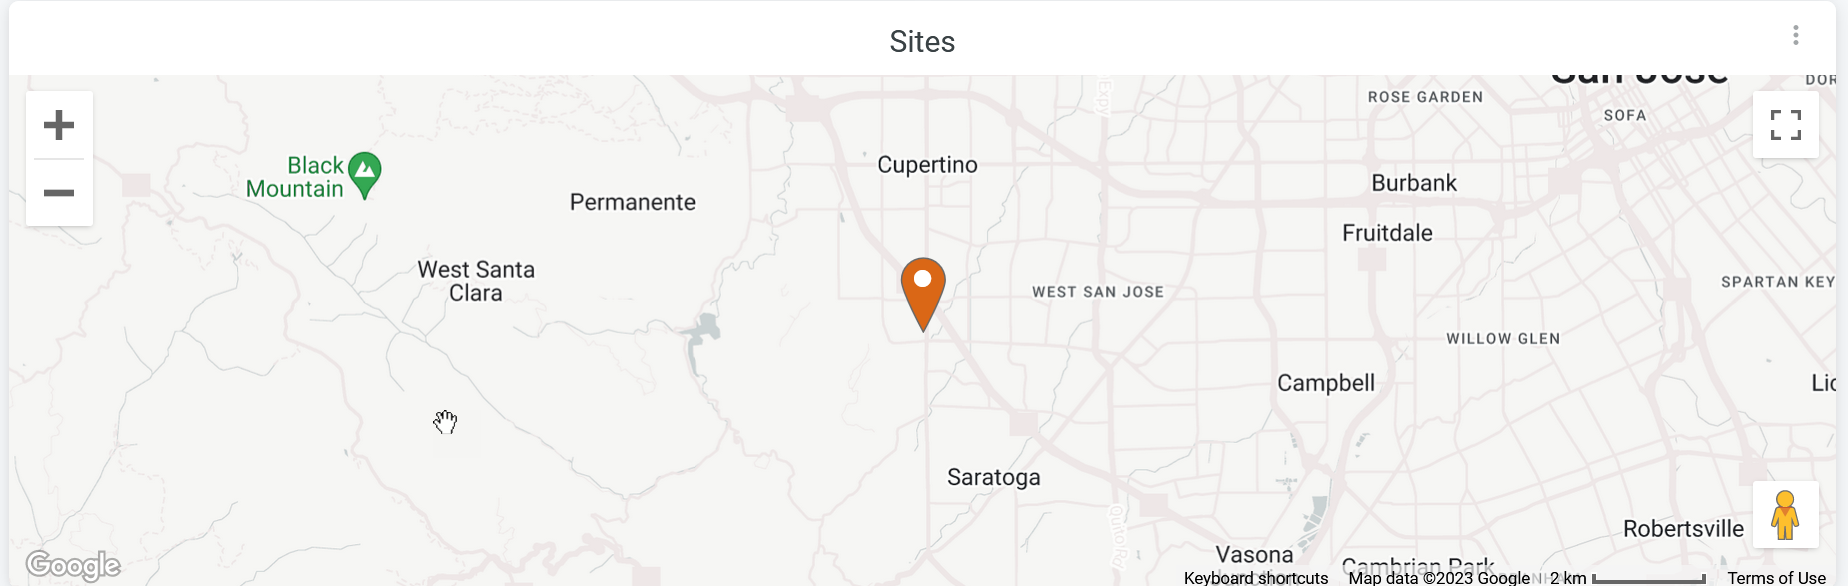
You can place the cursor on the map to display the site location. Double-click the map to zoom in—you'll see a detailed view similar to Figure 3.
SLE Summary
Figure 4 shows WAN service-level expectation (SLEs) details.
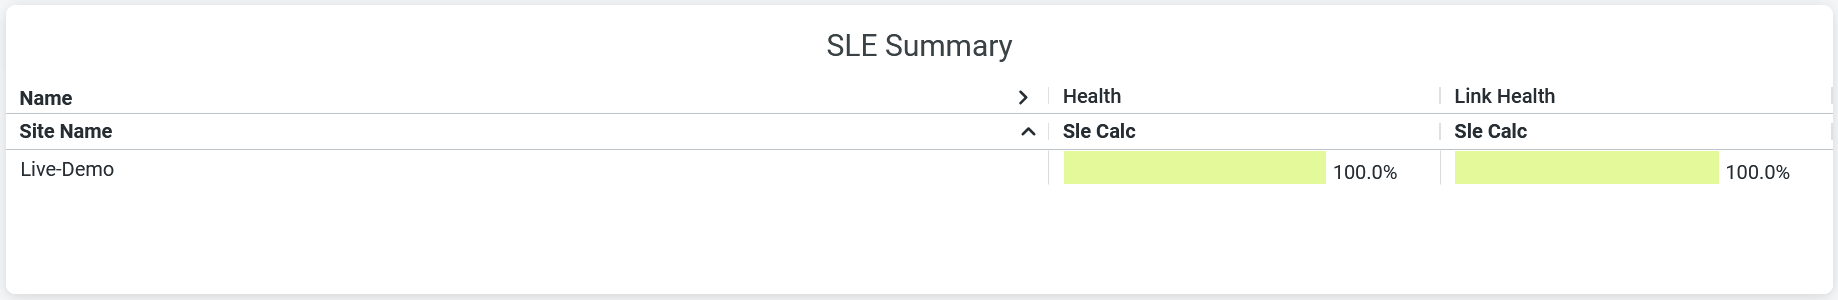
WAN SLE metrics indicate the performance of devices that serve the WAN functions in your network. WAN SLE metrics provide insights about the ability of a device to pass traffic. Therefore, these metrics are important to understand the experience of clients connected to a device.
The Juniper Mist portal displays each SLE metric as a percentage that represents the success rate of the metric.
You can view:
- Health—Indicates the health or performance of the WAN edge device as a percentage. In the above sample, a value of 100 percent for the Live-Demo site indicates that the WAN edge device performs at an optimal level.
- Link Health—Indicates the link health. In the above sample, a link health value of 100 percent for the Live-Demo site indicates that the WAN link performance meets the specified SLE.
Link Utilization
Figure 5 shows the Link Utilization tile.
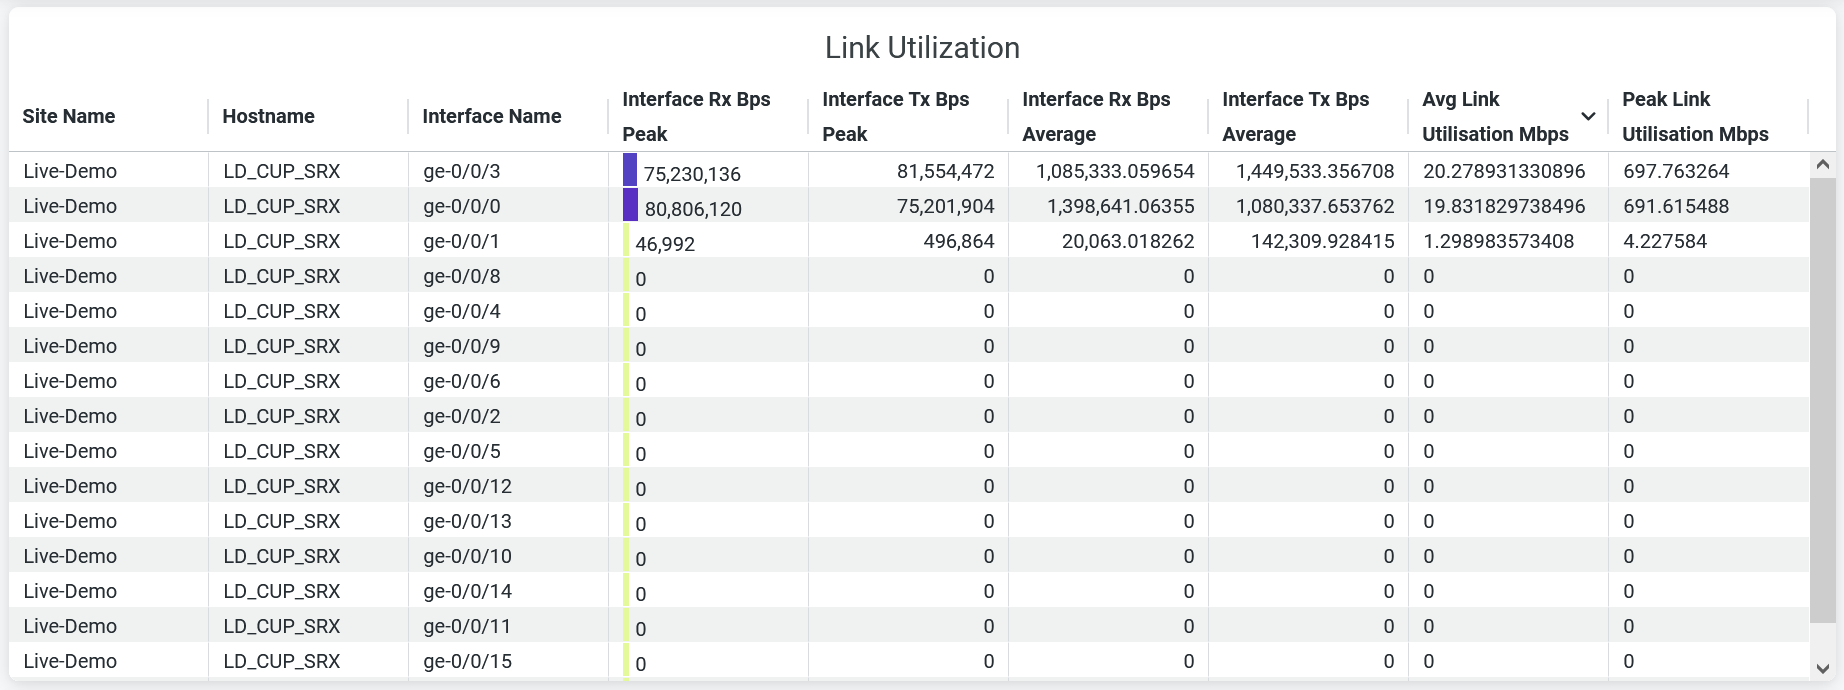
The Link Utilization tile displays the following parameters that indicate the data transfer volume on the network interfaces:
-
Site Name—Name of the site where a WAN edge device is located.
-
Hostname—Hostname of a WAN edge device.
-
Interface Name—Interface that a device uses for a WAN connection. Or Interface that a network uses for a WAN connection.
-
Interface Rx Bps Peak—Peak traffic volume that an interface receives.
-
Interface Tx Bps Peak—Peak traffic volume that an interface transmits.
-
Interface Rx Bps Average—Average traffic volume that an interface receives.
-
Interface Tx Bps Average—Average traffic volume that an interface transmits.
-
Average Link Utilization (Mbps)—Average traffic volume on an interface.
-
Peak Link Utlization (Mbps)—Peak traffic volume on an interface.
Link Metrics
Figure 6 shows the Link Metrics tile.
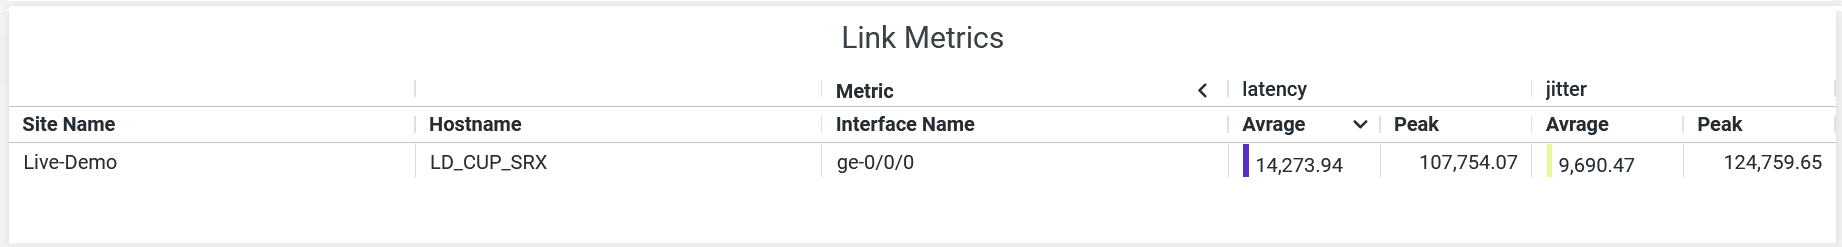
The Link Metrics tile displays the SLE metrics for jitter and latency that the WAN link experiences on the network interfaces. The dashboard displays the following details:
-
Site Name—Name of the site where a WAN edge device is located.
-
Hostname—Hostname of a WAN edge device.
-
Interface Name—Interface that the device uses for the WAN connection. Or Interface that a network uses for a WAN connection.
-
Jitter—Average and peak values of jitter in microseconds. Jitter is the inconsistency of data packet arrival intervals. Jitter is calculated using the variation (standard deviation) of round-trip time (RTT) within a period of 5 through 10 minutes for a particular WAN link.
-
Latency—Average and peak values of latency in microseconds. Latency indicates a delay in data transmission. Latency is calculated using the average RTT for traffic over a period of time.
Link Metrics Trend
Figure 7 shows the Link Metrics Trend tile.
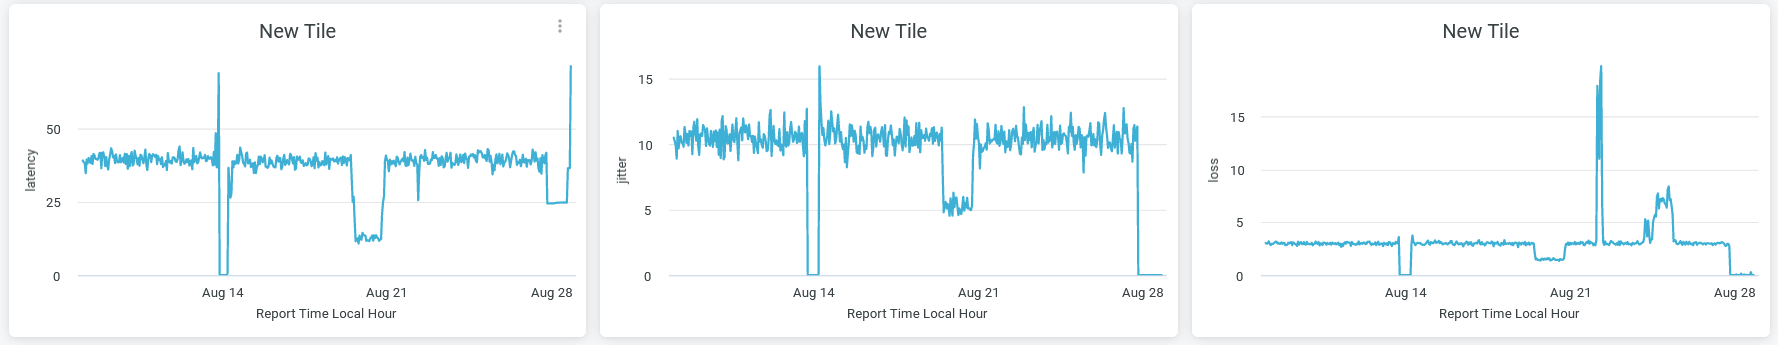
The tile displays overall jitter, latency, and packet loss over a period of time. You can hover over the chart to see jitter, latency, and packet loss data at a particular time and date.
You can identify the jitter, latency, and packet loss trends from these graphs.
Traffic Insights
Figure 8 shows different graphs available on Traffic Insights tile.
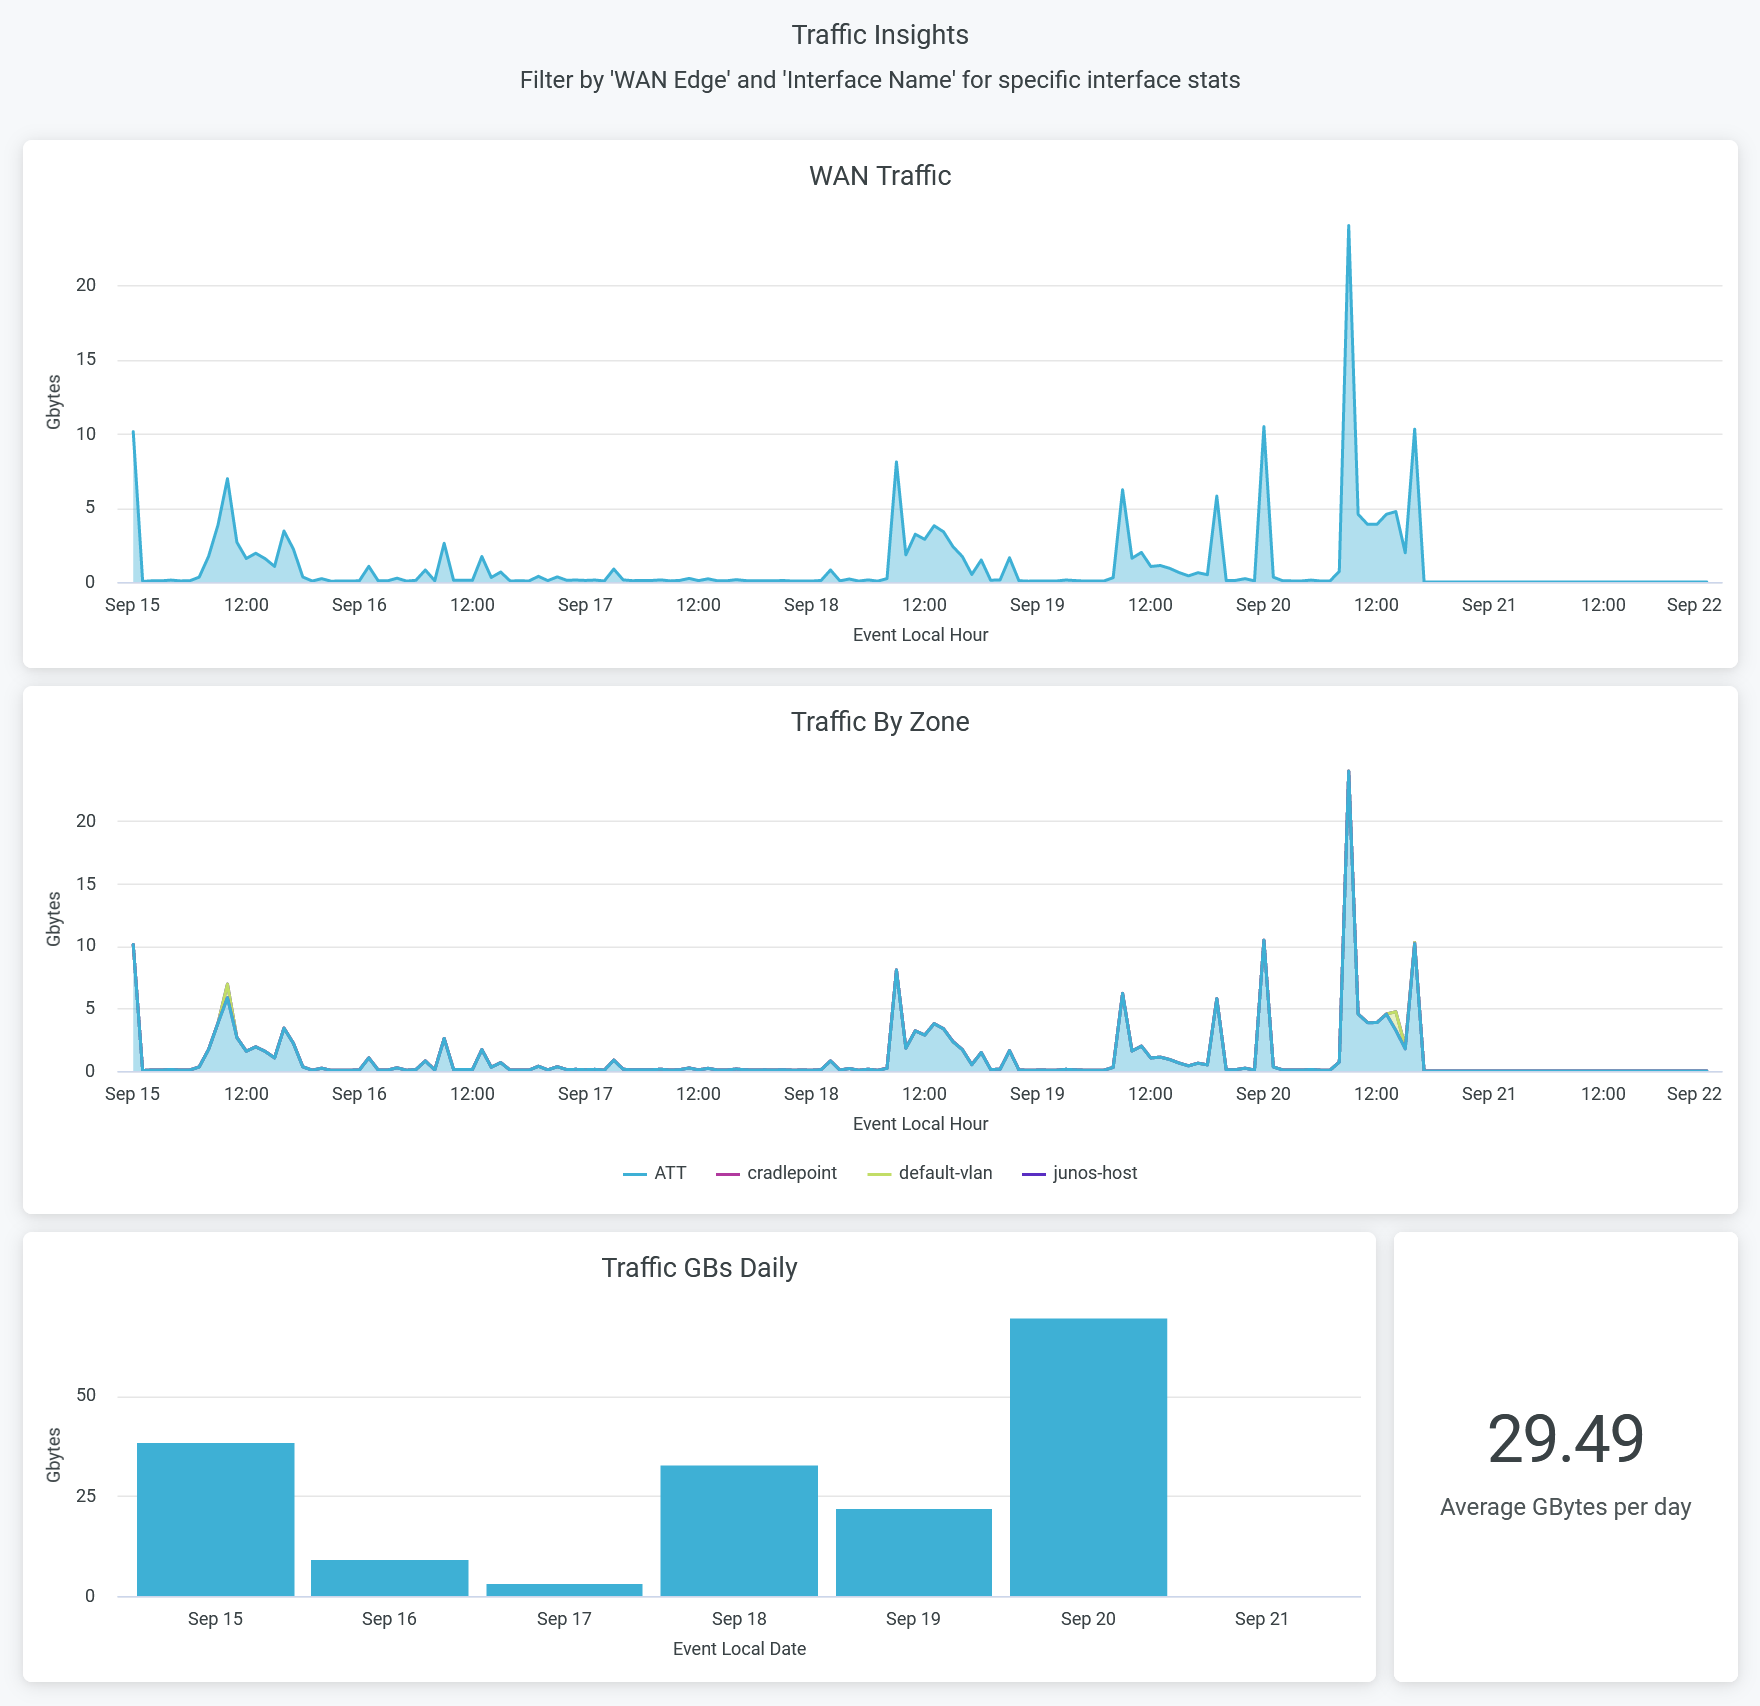
- The WAN Traffic graph displays the volume of WAN traffic flow over a period of time.
- The Traffic by Zone graph displays traffic flows through different zones in
WAN edge devices for a specific period of time.
To hide a zone from the chart and show only the remaining zones, click the zone name in the legend below the chart.
- The Traffic GBs Daily graph displays the volume of traffic that a WAN edge device manages over a period of time.
- The Average GBytes per Day tile displays the volume of average traffic flow per day.
Applications Insights
Figure 9 shows the Applications Insights tile.
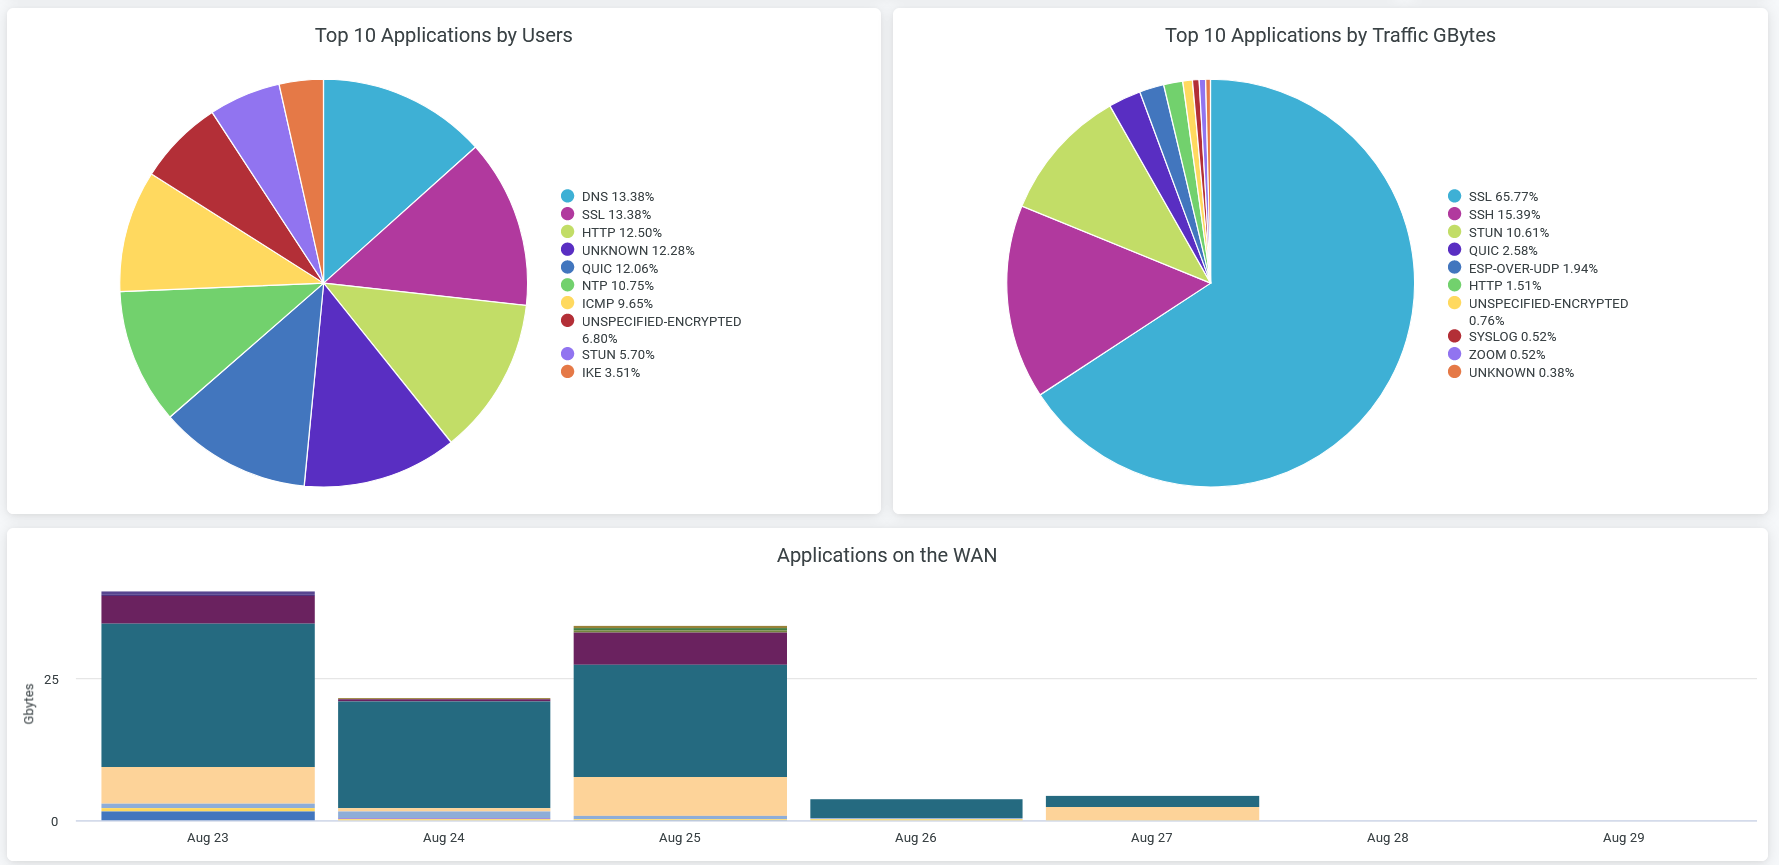
The Application Insights tile displays information about bandwidth consumed by a particular application or application category. You can spot the top applications in terms of various metrics by viewing these charts:
- The Top 10 Applications By Users chart displays bandwidth usage by the top 10 protocol types.
- The Top Business Applications by Traffic GBytes chart displays bandwidth usage by top 10 applications.
- The Applications on the WAN chart displays bandwidth usage by all the application categories.
Devices By Zone
The Devices by Zone graph displays the number of unique devices connected in different zones in WAN edge devices for the past 7 days as shown in Figure 10.
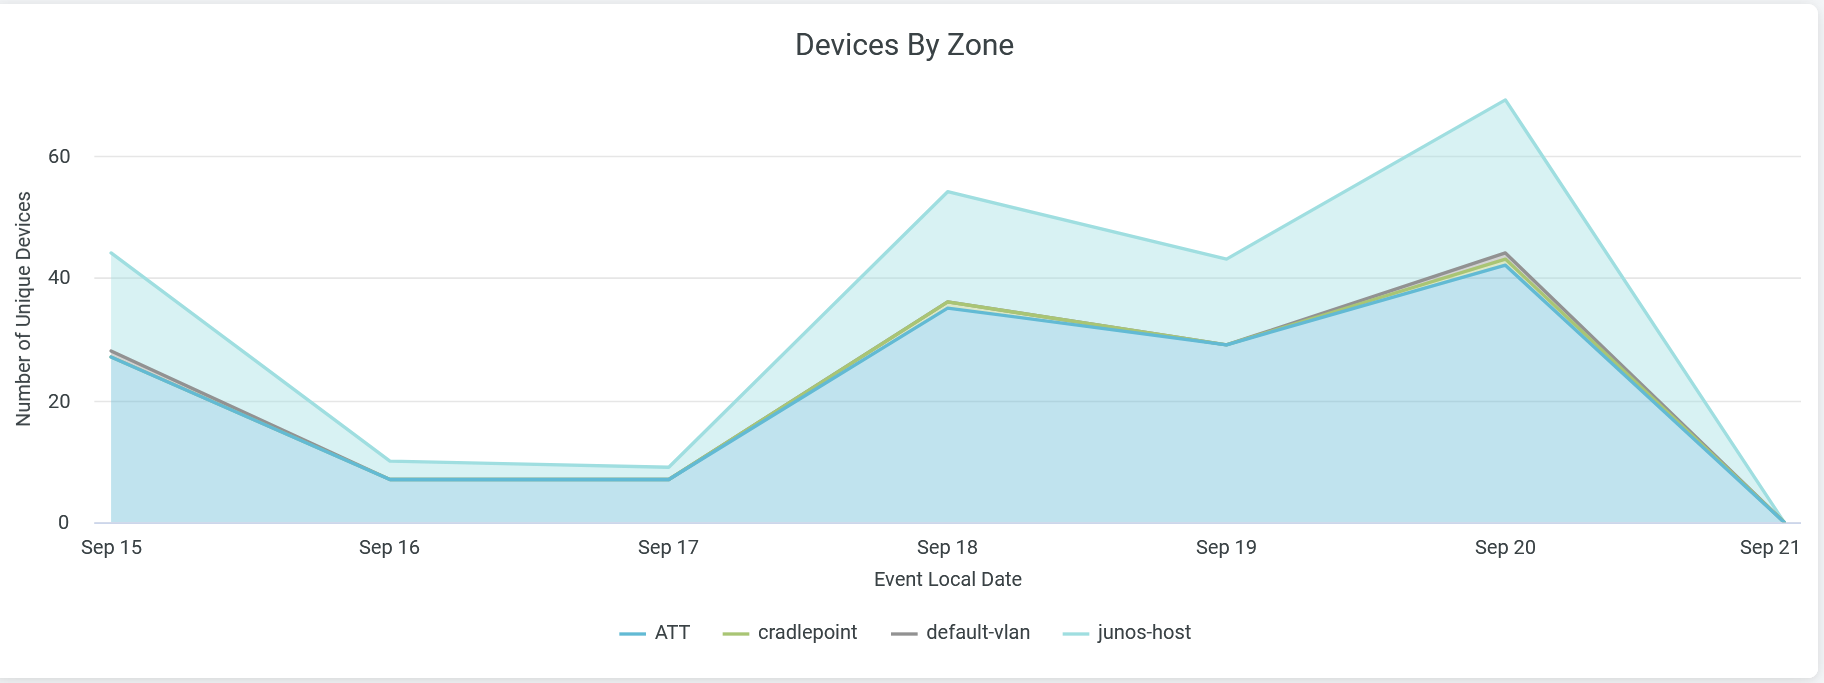
To hide a zone from the chart and show only the remaining zones, click the zone name in the legend below the chart.