ON THIS PAGE
Events
Get a high level view of the events that occurred over a specific time period within a selected site in your organization.
Features
-
- Real-time observation details help you to detect connectivity issues and respond in real-time
- View granular-level details of each event and quickly identify the problematic areas for further observations.
Before You Begin
-
Refer to Mist Premium Analytics Trial License to know about license requirements for Juniper Mist™ Premium Analytics.
- Become familiar with the options available on the Juniper Mist Premium Analytics dashboards. See Figure 3.
Access Events Analytics
Events Dashboard
Events page displays a log of a specific site's events for the selected tie period.
Figure 1: Events
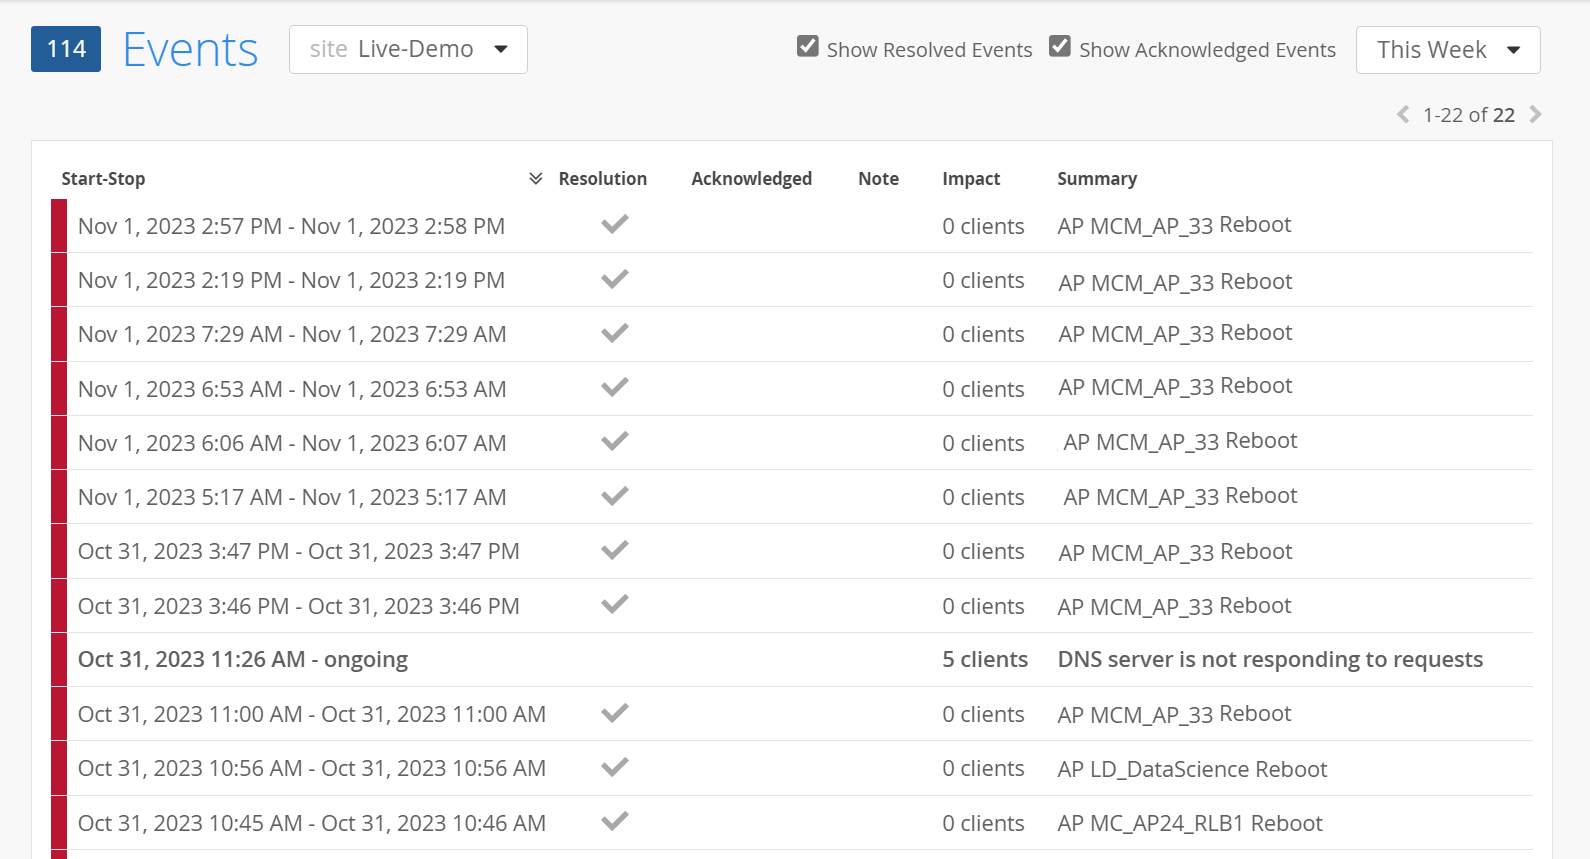
You can view the following details:
- Start-Stop—Timestamp of the event’s occurrence.
- Resolution—Resolution status of the event. (if the event is resolved or not)
- Acknowledged—Acknowledgment status of the event.
- Notes—Note for the particular event.
- Impact—Number of clients impacted by the event.
- Summary—Brief description of the event.
Click on any of the events to open the detail description of the event in a new page.
Figure 2: View Additional Details for Audit Log
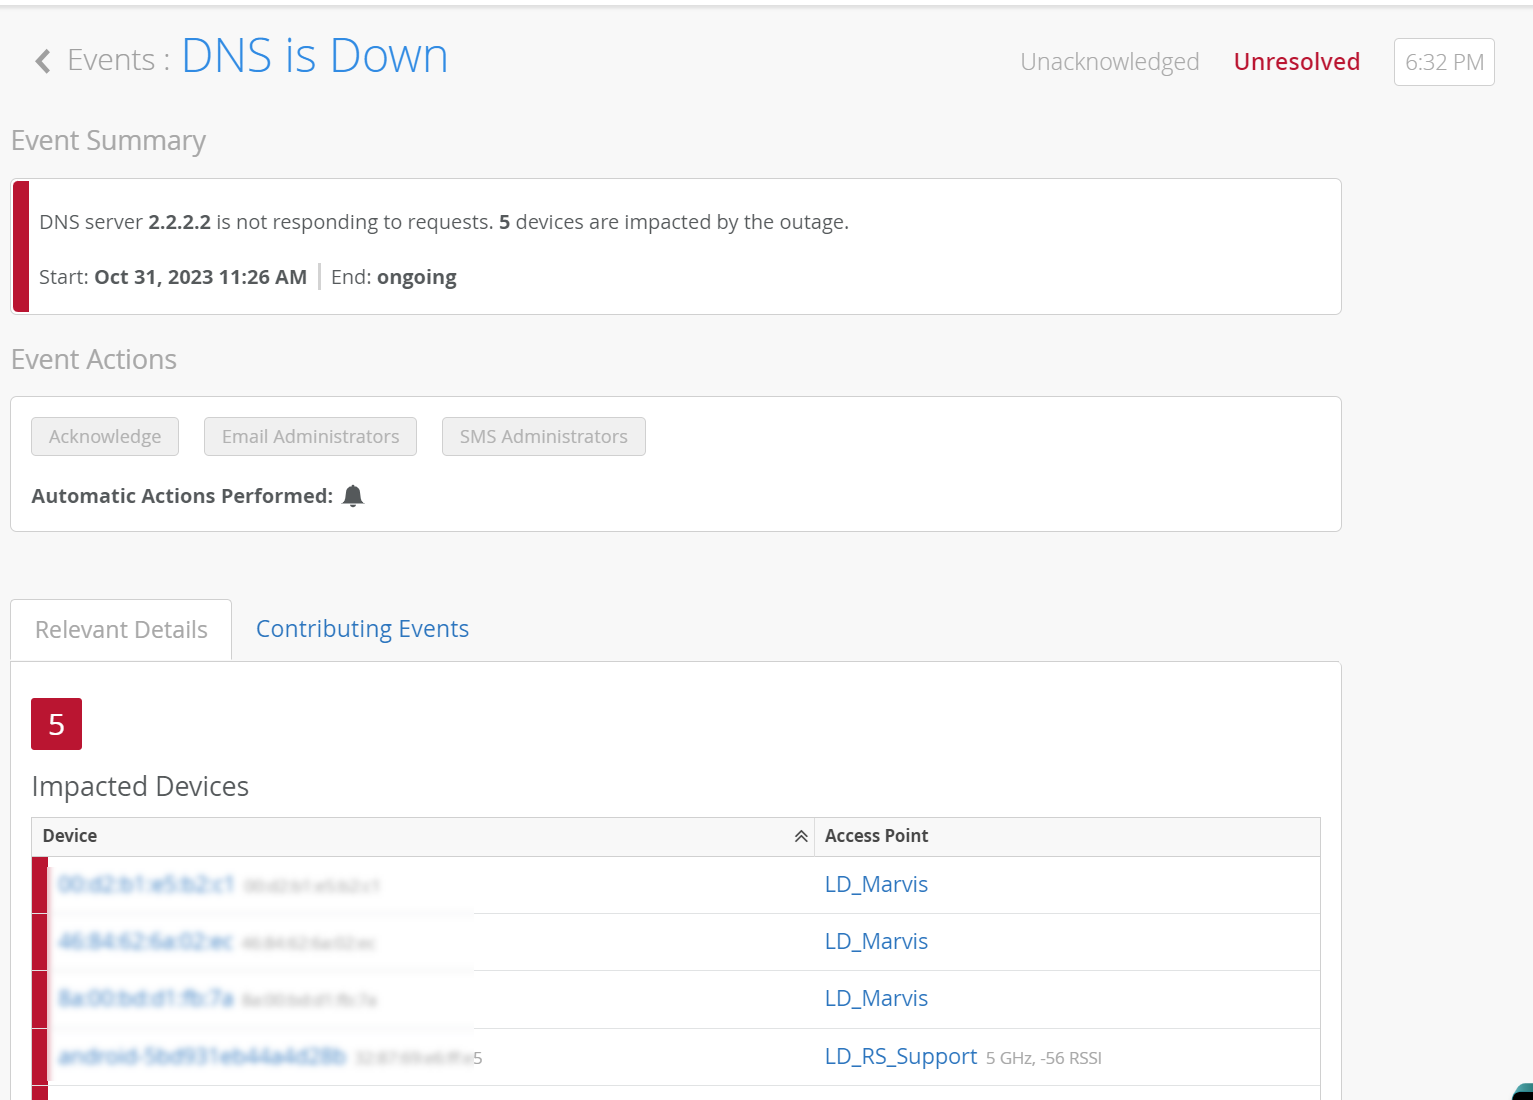
- Events Summary—View the details of the event with current status and time stamp. Here, you will see the cause of the event.
- Event Actions—See automatic actions, such as sending e-mails or SMS messages, that Mist performed as a result of this event.
- Relevant details—See devices that were impacted and access point the device is connected to.
- Impact Map—View an impact map of the event (if applicable).
- Contributing Events—Other network and events that are related to occurrence of this event. Click on the contributing event to display additional details (if available)