Network Analytics
Get a detailed view of network performance, traffic throughput, connected device information, other statistics, and network trends.
On the Network Analytics dashboard, you can customize your view with the most relevant data and re-size each tile according to your requirements.
With Network Analytics, you can:
-
Track network health, performance, and status.
-
Know the amount and types of traffic passing through the network.
-
Get insights about devices, access points (APs), switches and ports connected to your network, and site events including client, access point (AP), and switch events.
-
Easily generate a customized report that can support your decision making.
Before You Begin
-
See Juniper Mist Location Services Guide to learn how to sett up your sites and floor plans for location services.
-
See Mist Premium Analytics Trial License to know about the license requirements for Juniper Mist™ Premium Analytics.
- Become familiar with the options available on the Juniper Mist Premium Analytics dashboards. See Figure 3.
View Network Analytics Dashboard
To access the Network Analytics dashboard:
-
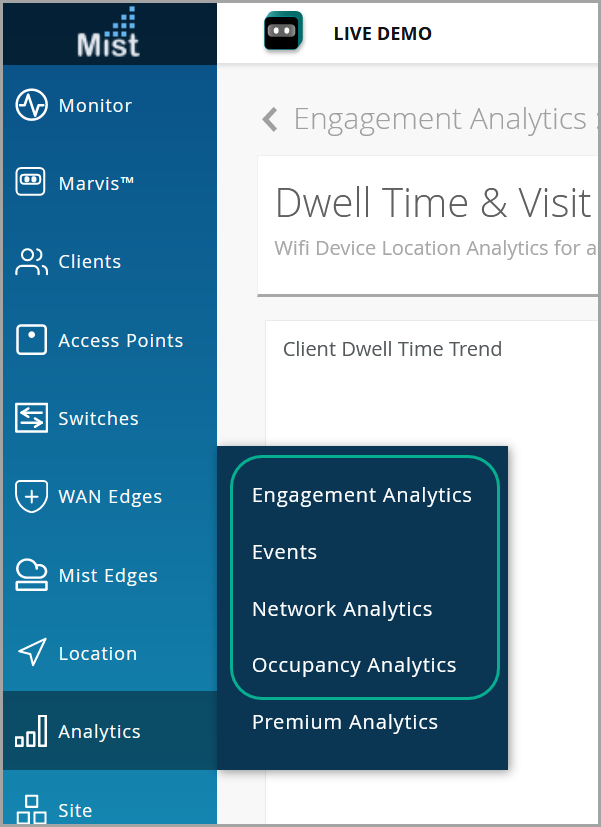
From the left menu of the Juniper Mist portal, select Analytics
> Network Analytics.
Figure 1: Analytics Dashboards
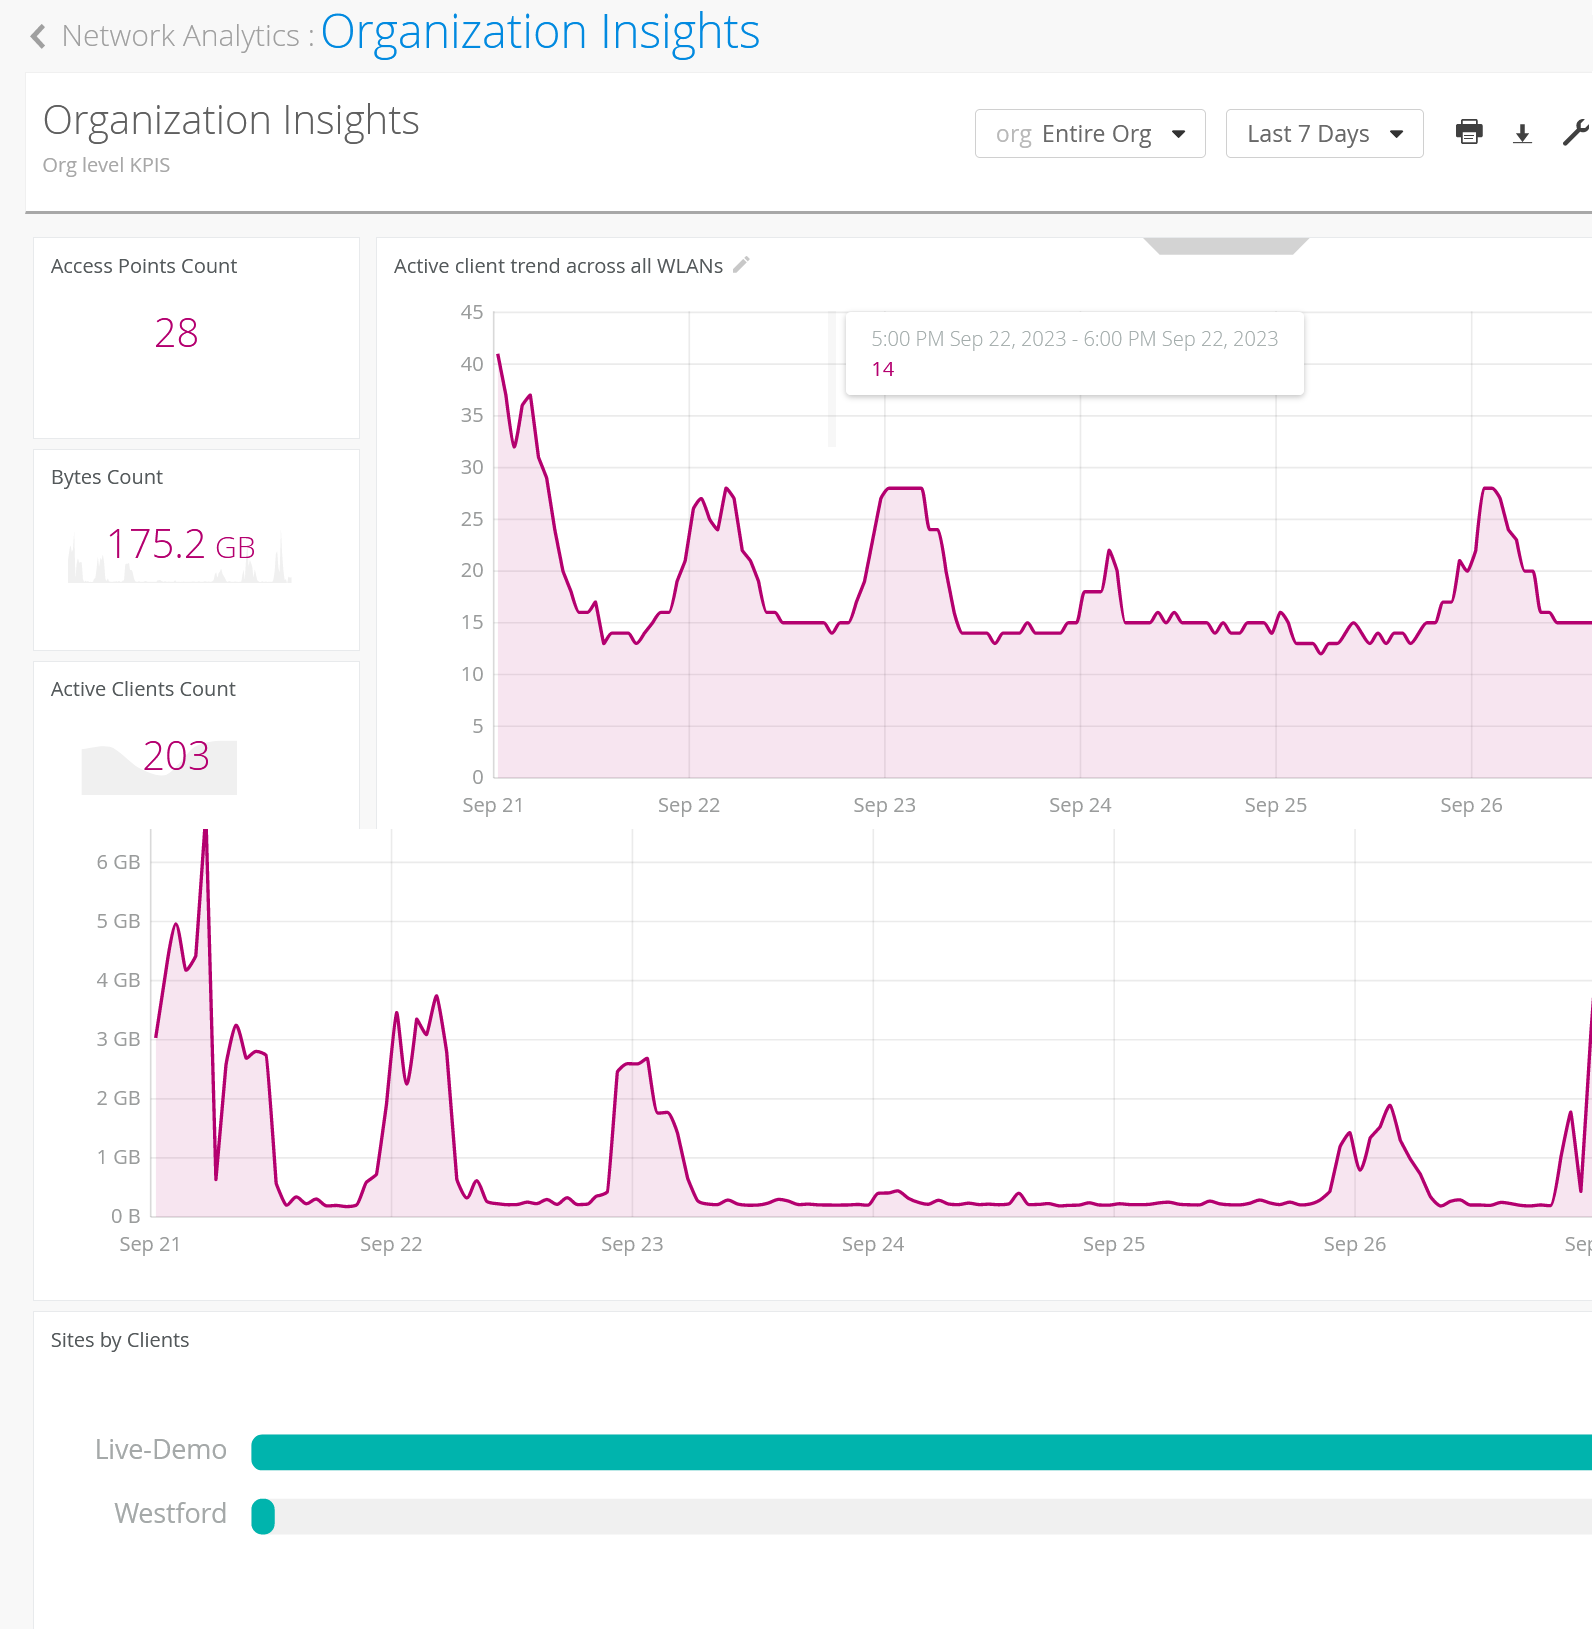
 The Network Analytics dashboard appears. This page displays the default views of organization insights.
 -
Use the options at the top of the dashboard to customize your view or
create new reports.
Figure 2: Network Analytics Filter Options

Select an option from the Organization menu to define the scope of the report as entire organization, site, floorplan, access point, client devices, or zone.
Set the time period for the report. You can select hour, day, week, month, or a custom time range.
Click the print icon to print the report, and click the download icon to download the report.
Click the spanner icon to apply the defined scope and time period to all the tiles. This step ensures that you see reports for the same scope and time period on all the tiles.
Create Reports Using Templates
The Network Analytics dashboard displays default reports that you can use as templates to generate new, customized reports.
You can use any of the following templates to generate reports:
- Access Points Count—Number of active access points (APs).
- Active Client Trends across WLANs—Number of active client devices connected across all WLANs.
- Bytes Counts—Total traffic volume across a site.
- Active Clients Count—Number of active client devices.
- Sites by Clients—Number of client devices in each site.
- Traffic Utilization across all WLANs—Traffic volume across all WLANs.
To generate a new report by using the template:
-
Click the required template to open the template on a new page.
The following figure shows the Active Client Trends across WLANs template on a new page.Figure 4: Generate Reports Using Template
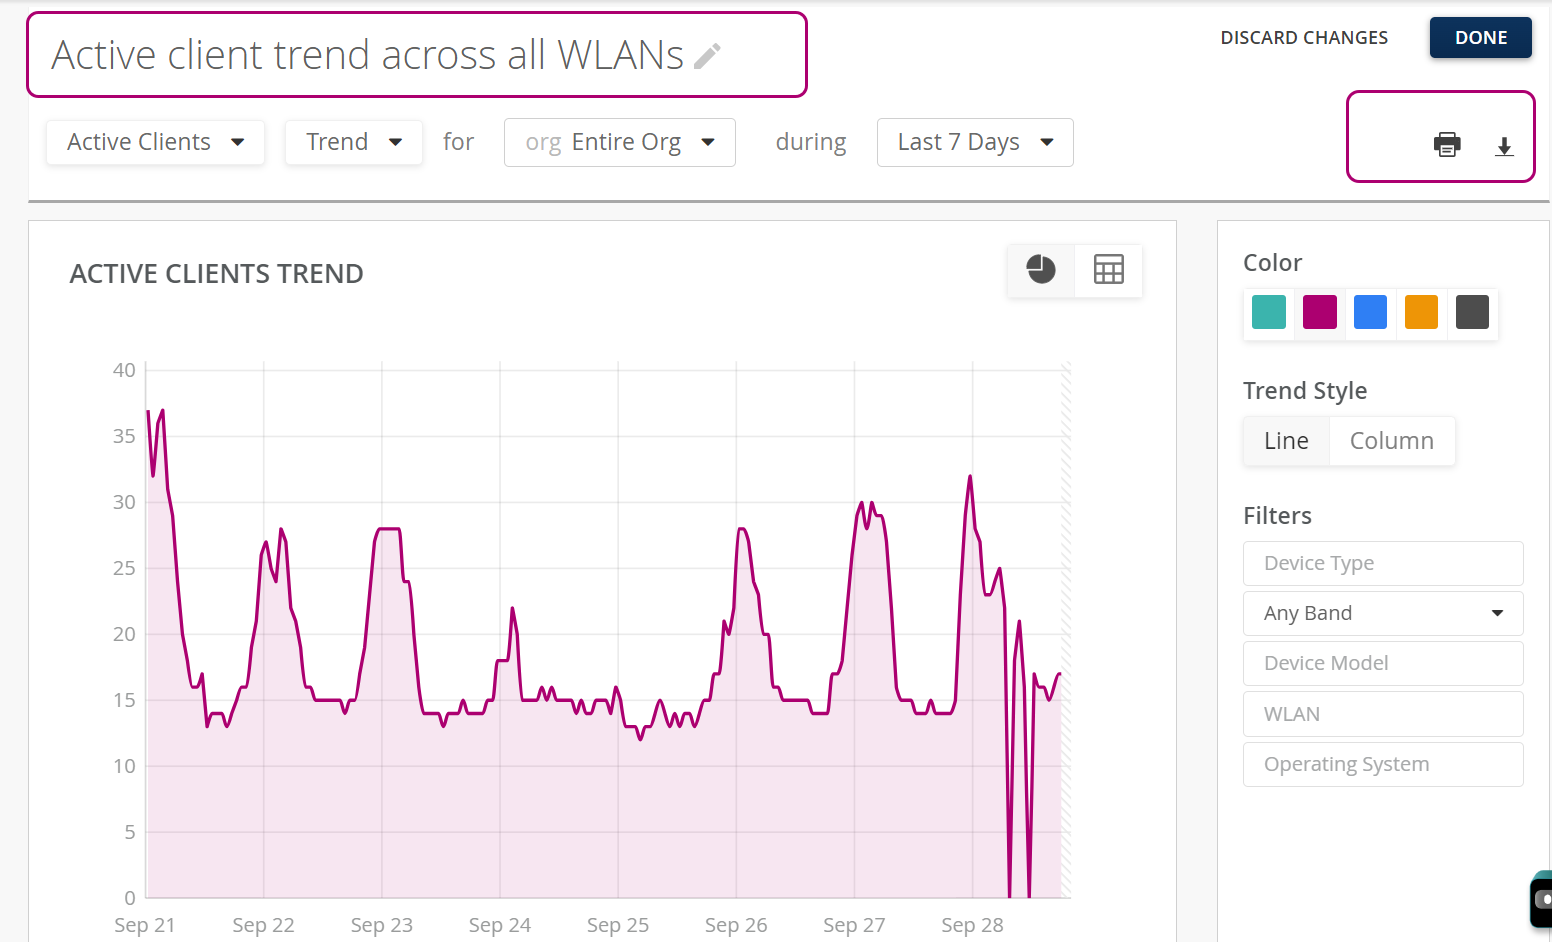
Use the following options to customize your report:
- Click the title of the tile to rename the report.
- Select the metrics that you want to include in the
report:
Measures
- Bytes—Volume of client traffic.
- Auth Latency—Average latency that clients experience during authentication.. This metric indicates the time a wireless client takes to connect to the wireless network.
- Channel Utilization—Channel utilization trends in the 2.4-GHz and 5-GHz radio channels grouped by APs.
- DHCP Latency—Average latency that clients experience to set up a Dynamic Host Configuration Protocol (DHCP) connection. This metric reflects the time that a user takes to connect to a site by using DHCP.
- DNS Latency—Average latency that clients experience to establish a connection by using Domain Name System (DNS). This metric reflects the time that a user takes to connect to a site by using DNS.
- Retries—Count of attempts that a wireless client makes to reconnect to the wireless network.
- RSSI—Average received signal strength that client devices experience.
- SLE—The percent of service-level expectation (SLE) that clients experience. You can filter the result further by AP health, capacity, coverage, roaming, successful connection, throughput, and time to connect.
Entities
- Access Points
- Applications—Visitor traffic and data usage for a particular application.
- Clients—Total count of clients. You can see information for active and unconnected clients.
- DHCP Server—IP address of each DHCP server that establishes the network and client connections.
- DNS Server—IP address of each DNS server that establishes the network and client connections.
- Gateway—IP address of gateways involved in establishing connections.
- Honeypot APs—Honeypot APs present in your network. Honeypot APs are unauthorized APs that advertise your service set identifier (SSID).
- Rogue APs—Rogue APs are APs that you have not claimed for your organization, but are connected on your organization's wired network.
- Sites—Sites with client connections.
- Switches—List of switches present in your organization.
- WLANs—WLANs with active client connections.
Events
- AP Events—AP events are those events that are related to an AP or are reported by an AP. An example of an AP event is when the AP configuration changes.
- AP Event Type—List of AP events sorted by event types.
- Client Events—Count of client events. Client events are related to or reported by individual client devices. An example of a client event is when a DNS request from a client fails.
- Event Type —List of client events sorted by event types.
- Guest Logins—Count of guest logins.
- RRM Events—Count of events related to Radio Resource Management (RRM).
- Site Events—Count of events related to a site. Site events are the ones that affect a large number of devices or clients. An example of a site event is DNS or DHCP server reachability or AP reboot events.
- Switch Events—Count of events related to a switch. Examples of switch events include configuration changes, software updates, and system alarms.
Others
- AP Channels—Location of AP channels in floor plans.
- Band—List of radio bands ordered by the number of client events.
- BSSID—Count of client events occurring at each basic service set identifier (BSSID). BSSID is a MAC address of an AP.
- Channel—List of radio channels ordered by the number of client events.
- Device Models—List of client device models.
- Device Types—List of client device types.
- Operating Systems—List of operating systems running on the client devices.
- Protocols—List of 802.11 protocols ordered by the number of client events.
- VLANs—List of VLAN IDs ordered by the number of client events.
- Wireless Coverage—Wireless coverage in the floor map. You must select the floor plan to see the map. You can sort or filter the map by radio band types 2.4 GHz, 5 GHz, and 6 GHz.
- Select the option to sort the report. The availability of sorting
options depends on the criteria that you select to customize the
report. You can sort the report by:
- Bytes, count, trend, average, list, ranked
- Scope—You can set the scope as entire organization, sites, floor plan, access point, or clients.
- Duration—You can set the duration to a day, week, month, or a custom date and time range.
- Colors for the report.
- Further refining options including
- Use filters to further refine your report. You can apply filters for WLAN criteria. Available options are: Radio bands, device model, device type, operating system, and WLAN
Access Saved Reports
To access your saved report:
-
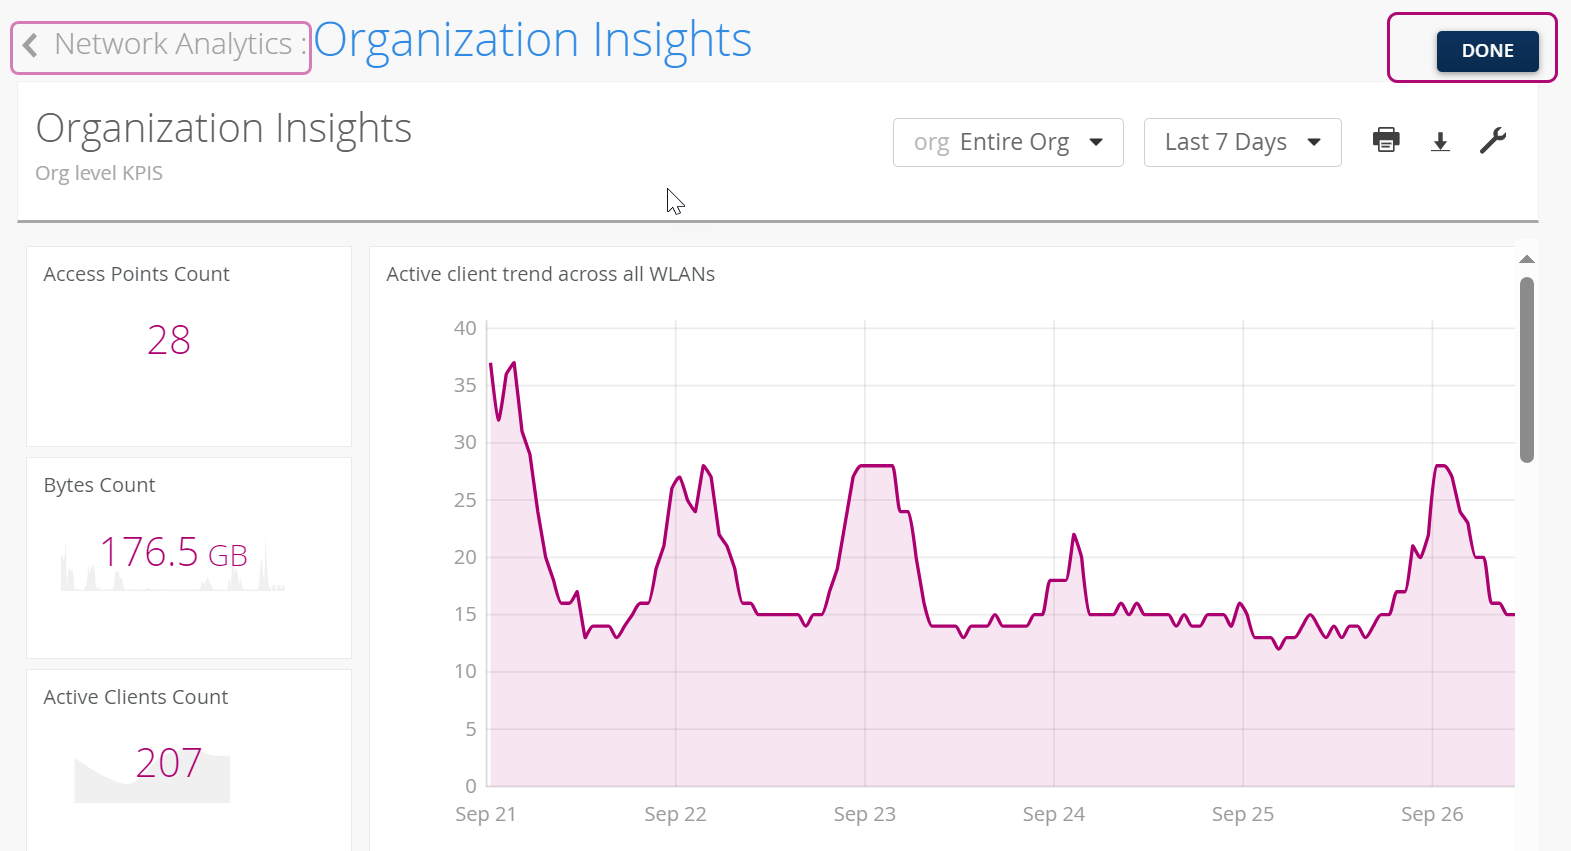
Click Network Analytics or
DONE on the template page.
Figure 5: View Saved Report
-
The Engagement Analytics library page appears displaying all the available
reports.
Figure 6: Access Reports Library
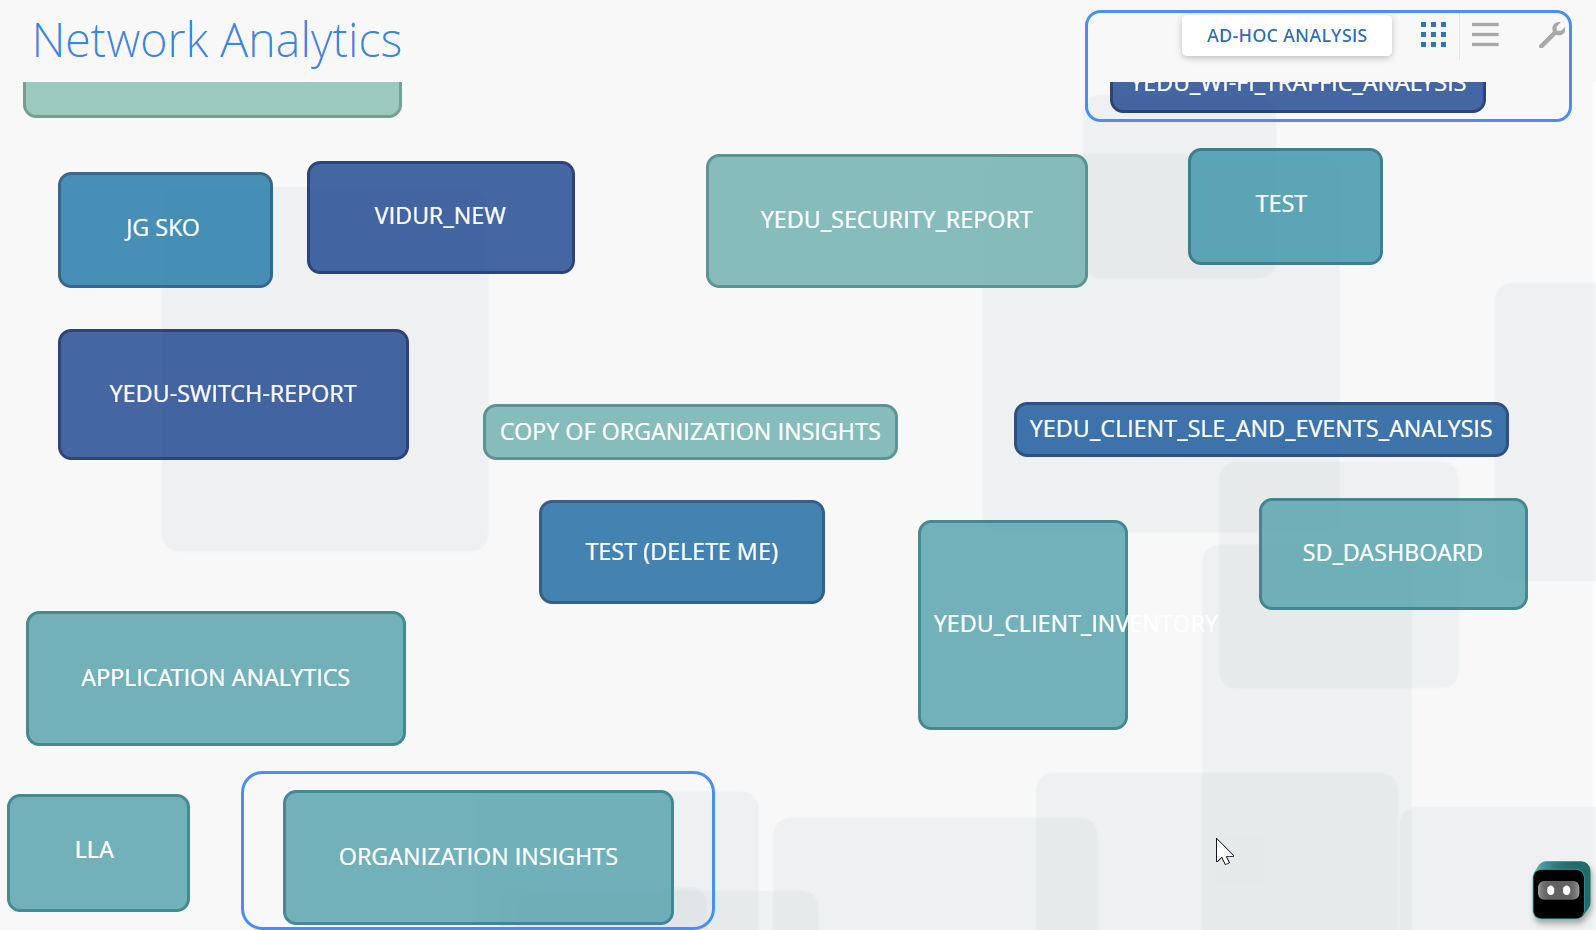
Click the hamburger menu on the top-right corner of the screen to arrange the reports as a list.
Select template at the bottom of the page to go back to the page to generate a new report.