Executive Summary—Wired
Use the Executive Summary - Wired dashboard to get an overview of your wired network components and the latest performance trends.
You can view the number of connected switches, traffic throughput, and service-level expectation (SLE) trends. With the information, you can perform a comprehensive analysis of your network to optimize the usage of your network resources.
Features and Benefits
-
Provides insights on organization-wide wired traffic trends and usage of switches and ports. With these insights, you can spot the areas of the network that experience problems.
-
Provides reports on service-level expectation (SLE) metrics at the site and organization levels. With SLE metric details, you can gain comprehensive insights into the experiences of clients using your network.
-
Track network health, performance, and status.
-
Monitors the amount and types of traffic passing through the network
Before You Begin
-
See Juniper Mist Wired Configuration Guide for the wired configuration details.
-
See Mist Premium Analytics Trial License to know about license requirements for the Juniper Mist Premium Analytics dashboard.
- Become familiar with the options available on the Juniper Mist Premium Analytics dashboard. See Figure 3.
Access Executive Summary - Wired Dashboard
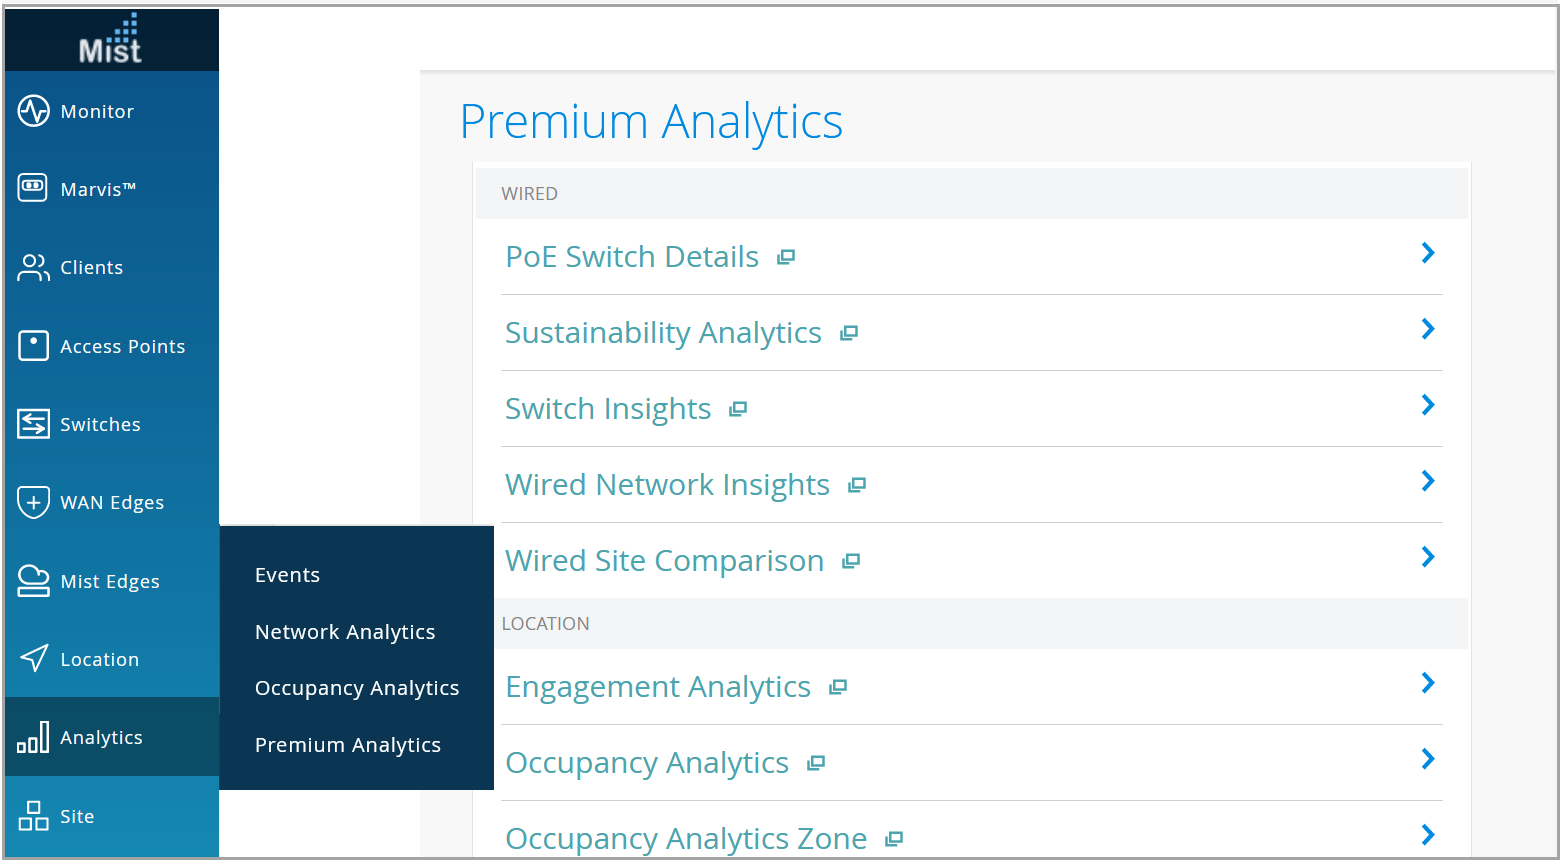
To access the Executive Summary - Wired dashboard:
-
On the Premium Analytics page, click Executive Summary -
Wired.
Figure 1: Access Executive Summary - Wired
 The Executive Summary - Wired dashboard appears.
Executive Summary - Wired Tiles
The Executive Summary - Wired dashboard includes various tiles that provide graphical representations of analytics at a granular level.
At the top of the dashboard, you can get a summary of your wired network.

The dashboard displays the number of switches including virtual switches in the site, total number of available ports, and the number of active ports.
- Wired Network Throughput Trend
- Summary Service Level Expectations (SLEs)
- Site Service Level Expectations
- Site Statistics
Wired Network Throughput Trend
The tile displays the client traffic volume that your wired network receives and transmits over 7 days.
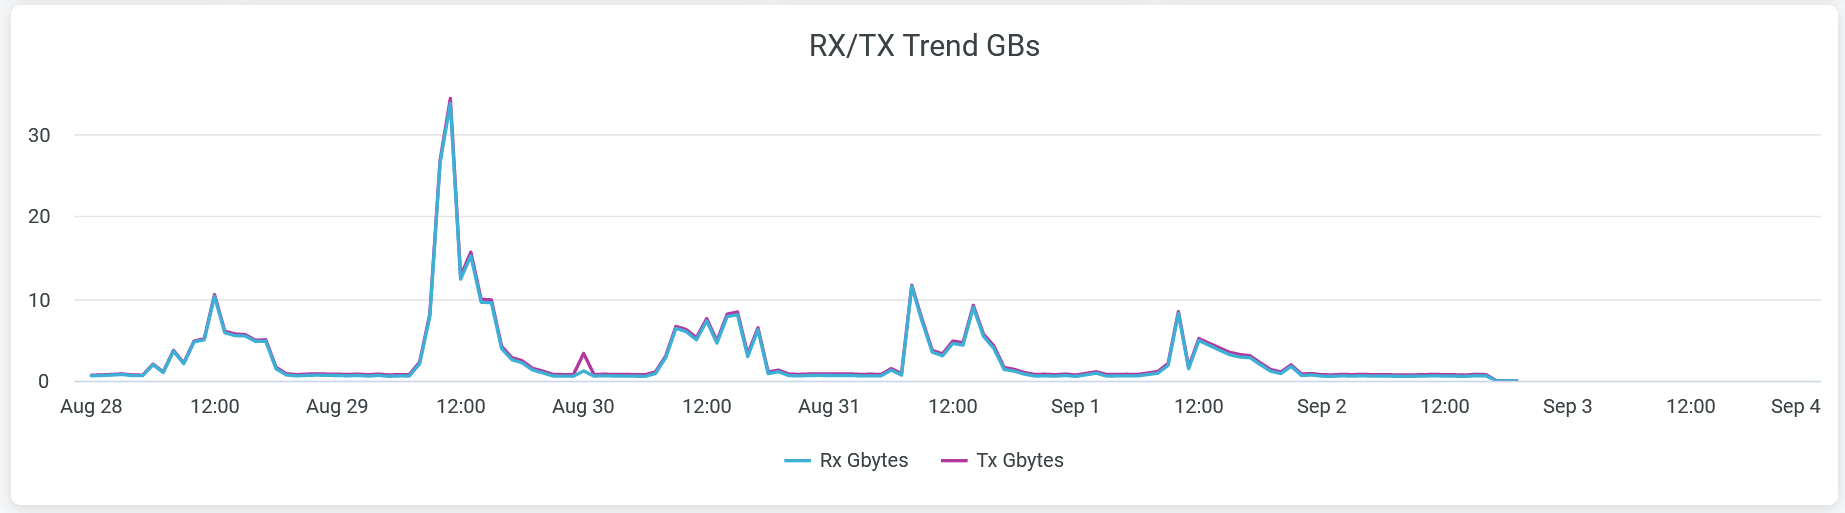
Two lines in the graph represent received traffic (Rx Gbytes) and transmitted traffic (Tx Gbytes). Place the cursor on the line to see the volume of traffic at the given time.
To hide either transmitted or received traffic from the chart and see only the remaining traffic type, click the relevant unit of measure in the legend.
Summary Service Level Expectations (SLEs)
The SLE Switch tile displays the SLE summary over a period of time in the network.
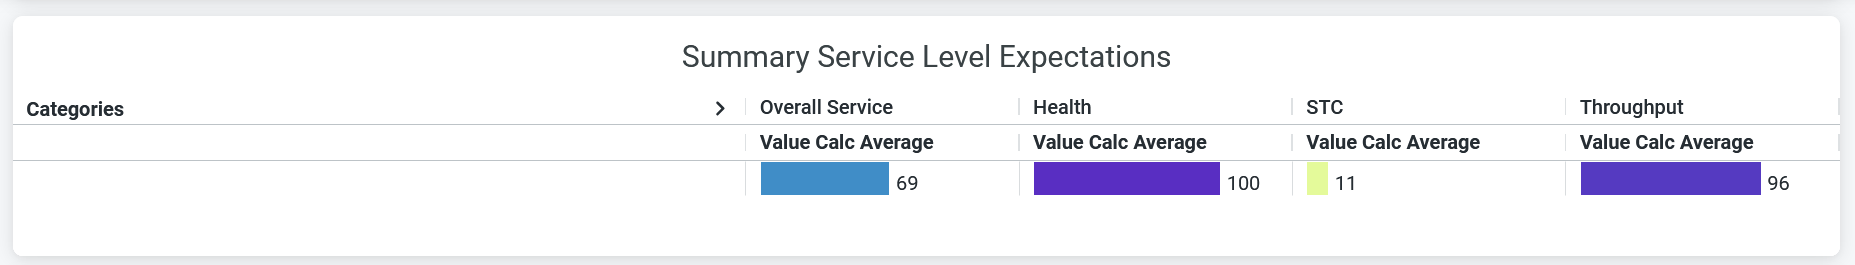
The SLE Switch Summary tile displays the success rate of each of the SLE metrics as a percentage:
-
Overall Service—The number of connections that experience the specified SLE goals.
-
Health—Percentage of user minutes during which the health status of the switches meets the SLE goal.
-
STC—Percentage of successful connections.
-
Throughput—Percentage of time the wired network users can pass traffic without any disruptions.
According to the sample that the tile displays, 100 percent of the connections meet the specified health level and 11 percent of the connections are successful. Additionally, the sample shows that 96 percent of the sessions successfully receive the specified throughput. Accordingly, the tile displays the overall service score as 69 percent.
Site Service Level Expectations
The tile displays SLE details for all sites in the wired network.
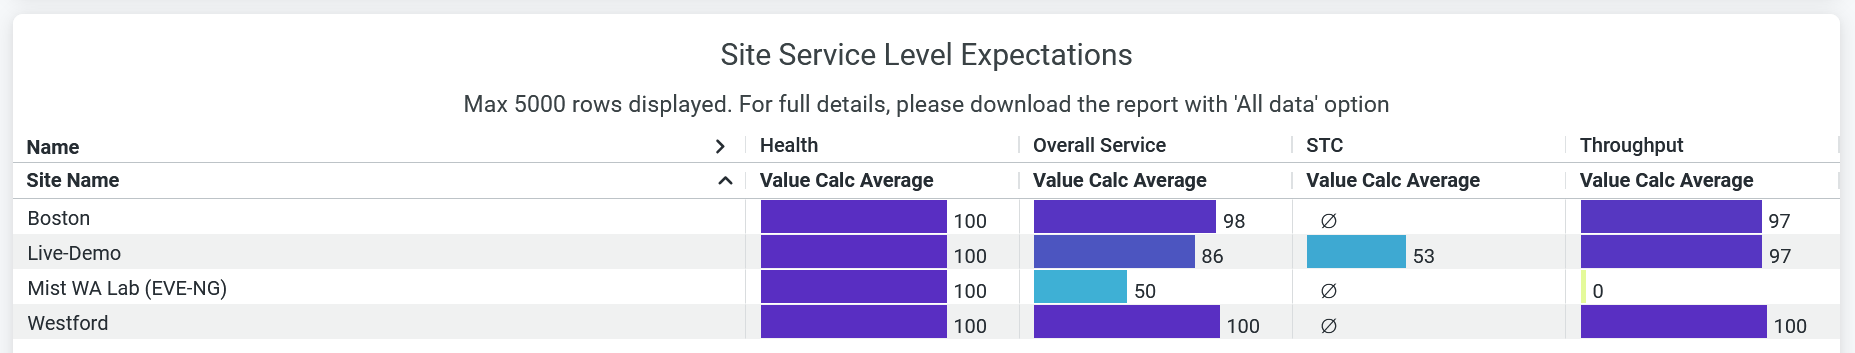
The Site Service Level Expectations tile displays the list of sites ranked according to the SLE metrics. The tile shows the success rate of each of the SLE metrics as a percentage. You can see:
-
Health—Percentage of user minutes during which the health status of the switches meets the SLE goal.
-
Overall Service—Number of connections that experience the specified SLE goals.
-
STC—Percentage of successful connections.
-
Throughput—Percentage of time the wired network users can pass traffic without any disruptions.
Site Statistics
The Site Statistics tile displays the sites sorted by the number of switches and traffic volume.
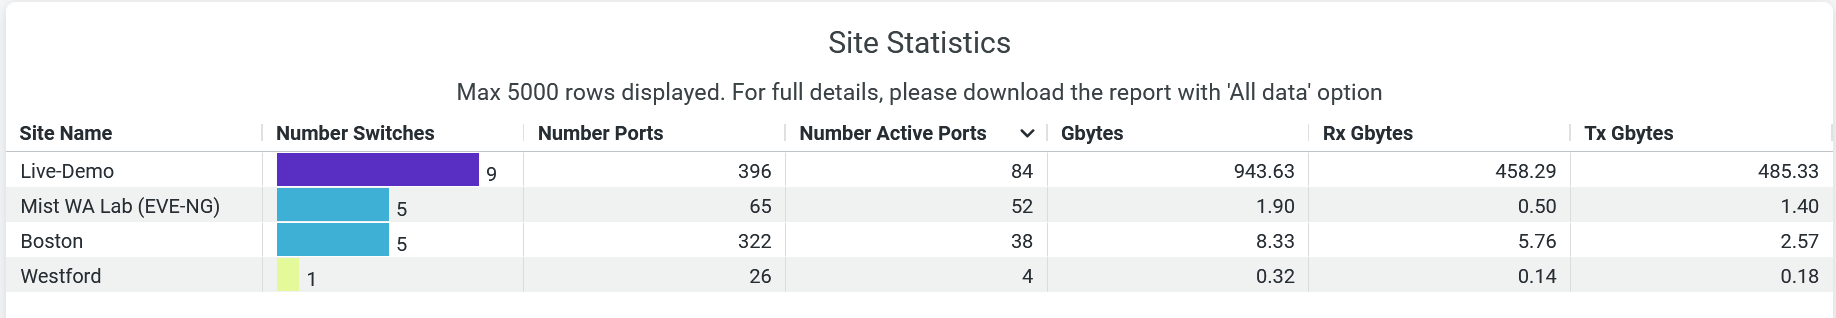
The site displays the list of sites ranked according to the number of active switches. You can view the following details for each site:
- Site Name
- Number of switches
- Number of ports
- Number of active ports
- Traffic usage—Total volume of traffic in the site.
- Rx Gbytes—Traffic volume that a switch receives.
- Tx Gbytes—Traffic volume that a switch transmits.