J-Insight Device Monitor Overview
As networks become increasingly complex, the need to adopt features that simplify the process of monitoring, maintaining, and improving the overall health of your networking devices becomes increasingly critical to delivering services in a more predictable and manageable way.
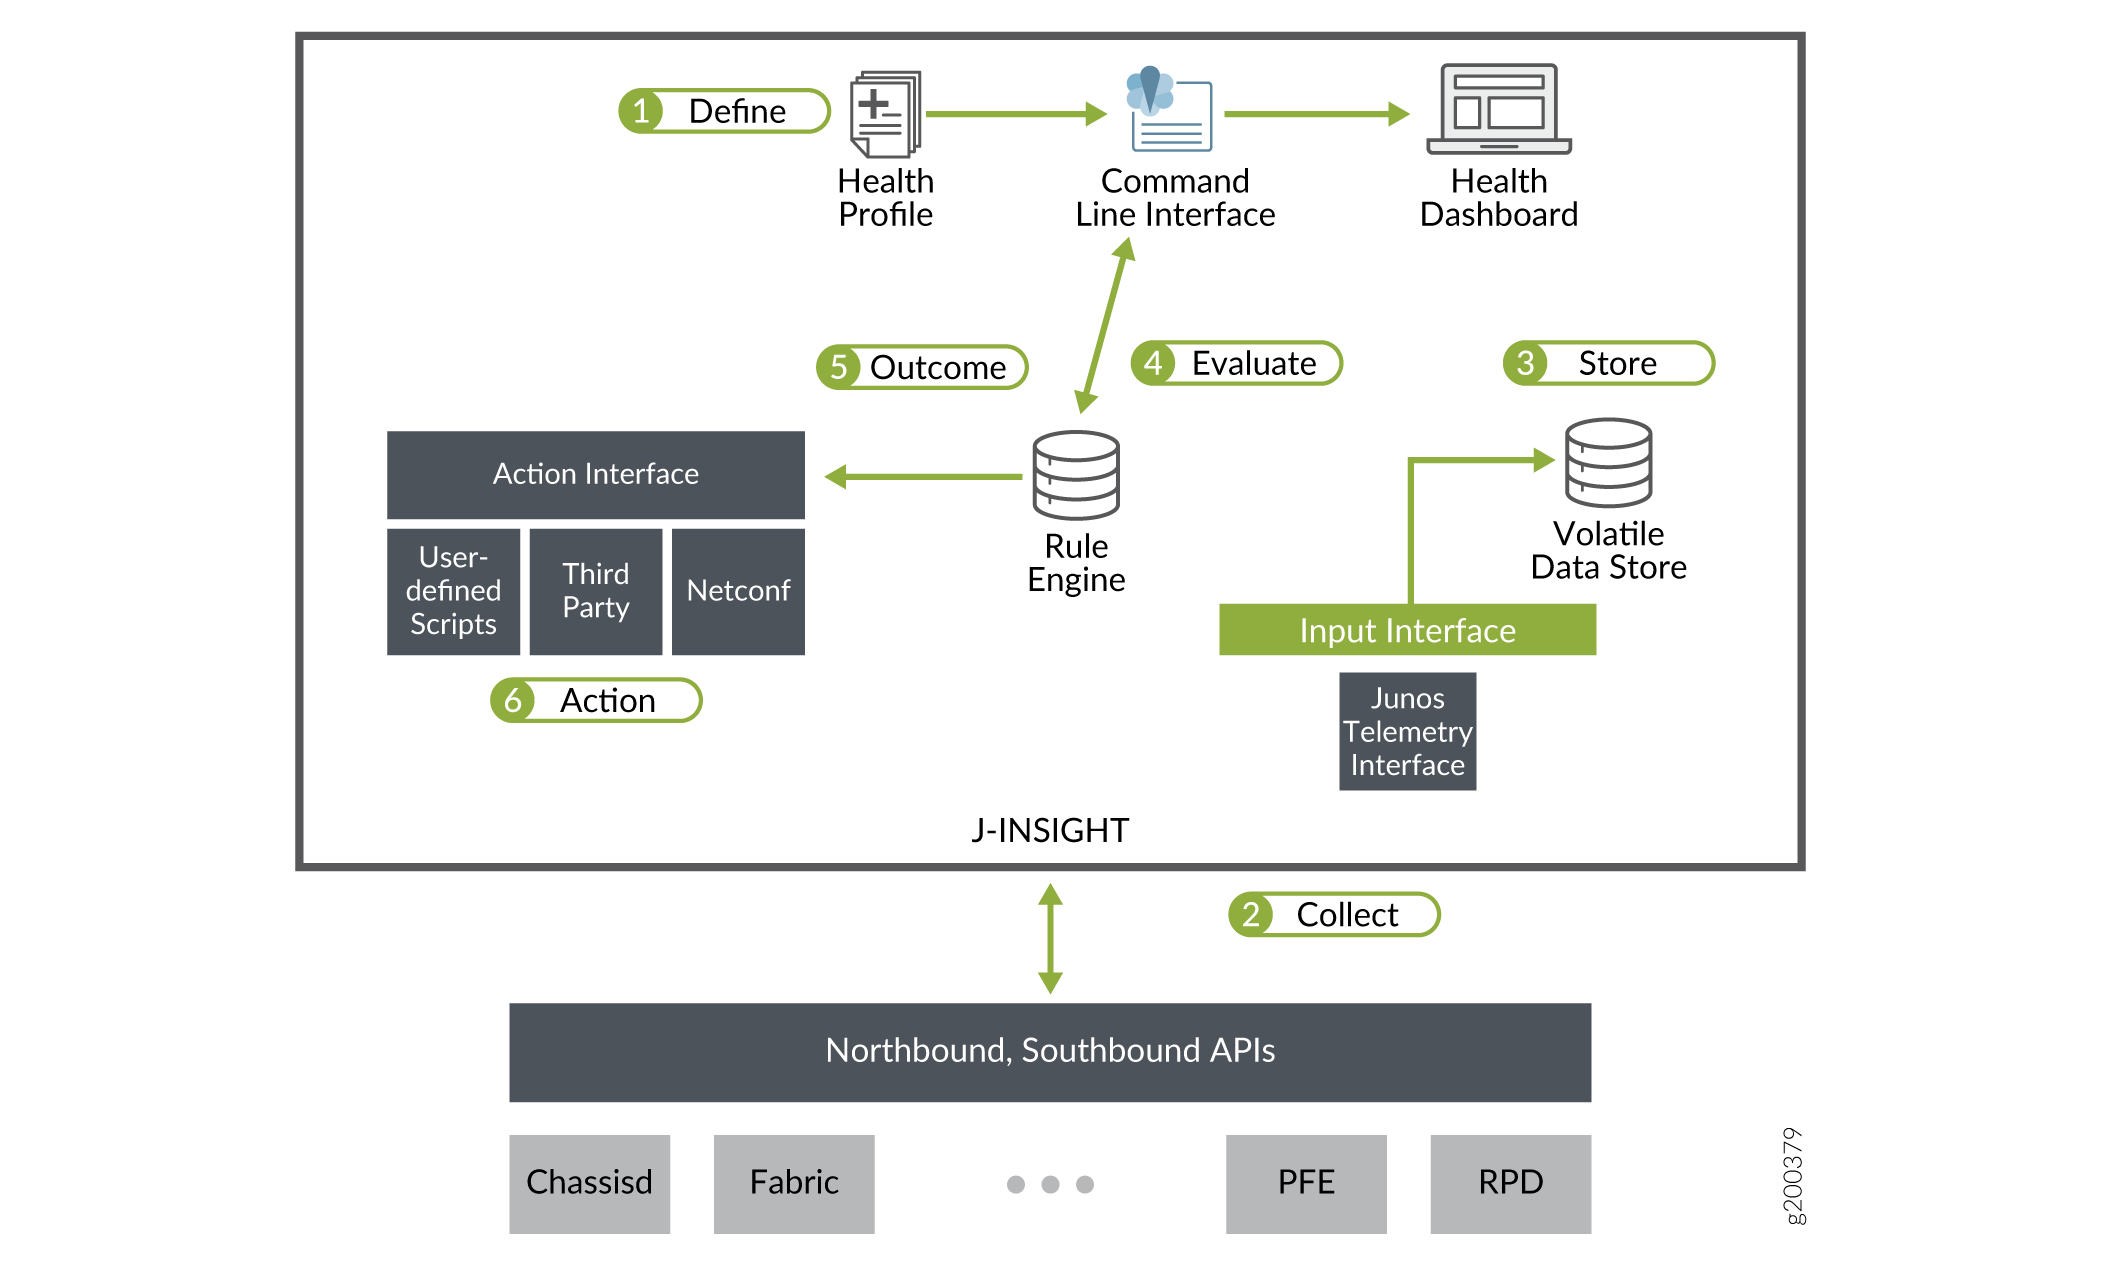
J-Insight is a data-driven device monitoring solution that provides visibility and insight into the health of a running system. It also has been integrated with the existing connectivity error management infrastructure to normalize error detection, monitoring, and reporting. The long-term goal for the architectural design of the J-Insight device monitor is depicted in Figure 1.
J-Insight is an on-premise system application that uses the Junos Telemetry Interface to continuously collect data that is reflective of the current state and health of the device component being monitored.
Understanding How J-Insight Health Monitoring Works
As part of this initial release, the J-Insight health monitor supports the following process flow (see Figure 1):
-
Consumes a pre-defined static health profile. The health profile is not user-configurable through the Junos OS CLI.
-
Using the Junos Telemetry framework, subscribes to health KPIs specified in the default health profile. J-Insight health monitor subscribes to Junos Telemetry sensors using a standard interface. Health monitor subscription and reporting is disabled, by default, and can be enabled through the Junos OS CLI. The following health KPIs are supported:
-
CPU utilization
-
Temperature sensors
-
PFE memory utilization
-
Fabric reachability
-
-
Collates the Junos Telemetry data streams collected from various sub-systems.
-
Evaluates the health data against configured thresholds and reports the health status.
Understanding How J-Insight Fault Monitoring Works
J-Insight utilizes the connectivity error management infrastructure to normalize error detection, monitoring, and reporting. Through this infrastructure, J-Insight also provides the capability to define data-driven fault policies. Each module can define error properties by reading a DST/capability file. The fault monitoring capability is available by default in Junos OS and cannot be enabled or disabled through the CLI.
Each error is defined by the following properties:
-
URI—Error identifier. Each error is uniquely identified with an error ID that is represented as a Uniform Resource Identifier (URI).
-
Error—Error name.
-
Scope—Error scope. An error scope provides a level of classification above the error category. Examples of error scope values include: pfe and board.
-
Category—Error category. An error category categories errors into various subgroups under a specific error scope level. Examples of error category values include: memory, processing, and storage.
-
Details—Description for the error.
-
Count—The number of times error instances have occurred.
-
Clear count—The number of times error instances have been cleared.
-
Support—Support details for the error type.
Change History Table
Feature support is determined by the platform and release you are using. Use Feature Explorer to determine if a feature is supported on your platform.