Enabling Export of Subscriber Statistics and Queue Statistics for Dynamic Interfaces and Interface-Sets
Enabling Export of Subscriber and Queue Statistics for Dynamic Interfaces and Interface-Sets
You can use subscriber statistics and queue statistics for dynamic interfaces and interface-sets to support remote analytics and monitor Juniper devices that operate as a Broadband Network Gateway (BNG). Using these statistics, you can model and condition traffic flows in a subscriber access network.
About Subscriber and Queue Statistics
Subscriber statistics include the per-IP protocol family (IPv4 or IPv6) packet information (receive and transmitted packets and bytes) for a subscriber interface. Subscriber statistics only include subscriber data forwarded by the system. Filtered and dropped packets and control traffic are factored out and not delivered.
ON-CHANGE subscription support for interface meta-data sends
asynchronous notifications when interfaces are created and deleted.
After an initial baseline of delivering create notifications
for all existing interfaces, only notifications for interfaces that
are being created or deleted are sent to an external collector.
Use queue statistics to determine oversubscription levels, the mix of forwarding-class traffic, or traffic rates for a given CoS-enabled interface or interface-set.
To receive subscriber statistics, you also must enable RADIUS accounting. See 802.1X and RADIUS Accounting.
Enabling Export of Statistics
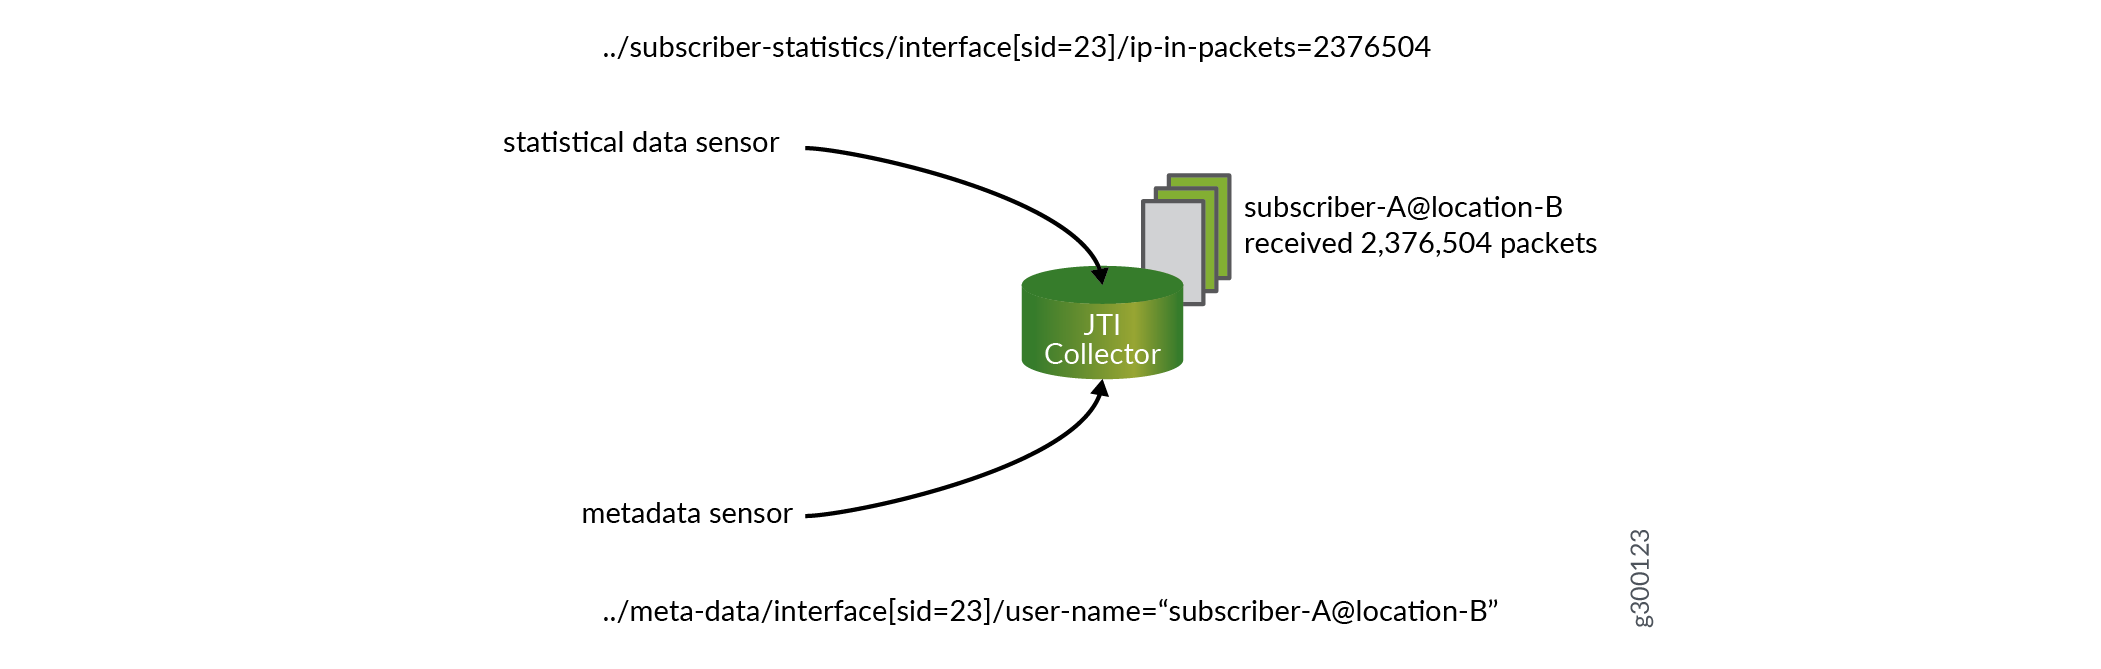
To receive statistics, enable both metadata and statistical data for export on your Juniper device through the Junos CLI. Metadata is provided for the interface because the interface key is a dynamic integer, called a session identifier (SID). That identifier conveys no context to an external server. The metadata provides more tangible context (such as a user name, a profile name VLAN tags, and so on) to the SID. An external collector associates the statistical data to a persistent reference.
A subscription for both statistical data and metadata can be made from the external collector (in Figure 1, the Junos Telemetry collector). The external collector merges the two streams and correlates the statistical data with the metadata. The external collector matches the dynamic SID with permanent attributes such as username and location.
See Also
Enable Export of Subscriber Statistics and Queue Statistics
You can enable the telemetry export of subscriber statistics and queue statistics for dynamic interfaces and interface-sets. After you enable telemetry for these statistics, they are eligible for export to one or more collectors using a remote procedure call (gRPC) subscription.
Use these statistics to model and condition traffic flows in a subscriber access network and to provide subscriber statistics information (accurate accounting).
To enable the export of subscriber statistics and associated interface meta-data:
To enable export of interface meta-data and queue statistics for dynamic interfaces:
Enable export of interface meta-data and interface queue statistics. Use the profile variable
$junos-interface-name.Note:the profile variables
$junos-interface-nameand$junos-interface-set-nameare generated from the corresponding device, unit and interface-set elements in the interfaces stanza at profile instantiation time. Using these derived variables is a convenient way to configure telemetry behavior for the interface or interface-set without the need to mimic the specific configuration in the interfaces stanza.[edit dynamic-profiles profile-name] user@host# set telemetry queue-statistics interface $junos-interface-name
To override the default internal queue-stats collection interval of 900 seconds or the default queue export filter (all queues, 0-7), add the
rateandqueuesstatements.[edit dynamic-profiles profile-name telemetry queue-statistics interface $junos-interface-name] user@host# set rate 300 user@host# set queues “0,1,2”
To enable export of interface-set meta-data and queue statistics for dynamic interface-sets:
Enable export of interface-set meta-data and interface-set queue statistics. Use the profile variable
$junos-interface-set-name.Note:the profile variables
$junos-interface-nameand$junos-interface-set-nameare generated from the corresponding device, unit and interface-set elements in the interfaces stanza at profile instantiation time. Using these derived variables is a convenient way to configure telemetry behavior for the interface or interface-set without the need to mimic the specific configuration in the interfaces stanza.[edit dynamic-profiles profile-name] user@host# set telemetry queue-statistics interface-set $junos-interface-set-name
To override the default internal queue-stats collection interval of 900 seconds or the default queue export filter (all queues, 0-7), add the
rateandqueuesstatements.[edit dynamic-profiles profile-name telemetry queue-statistics interface-set $junos-interface-set-name] user@host# set rate 300 user@host# set queues “0,1,2”
After telemetry export is enabled, meta-data and statistics can be streamed to external collectors subscribing to the available resource paths.
Use the resource paths from gRPC Sensors for Subscriber and Queue Statistics for Dynamic Interfaces and Interface-Sets (Junos Telemetry) for your gRPC subscription.
See Also
Guidelines for Exporting Subscriber Statistics and Queue Statistics for Dynamic Interfaces and Interface-Sets
Use subscriber and queue statistics for dynamic interfaces and interface-sets to support remote analytics and monitoring.
Before enabling export of subscriber statistics and queue statistics for dynamic interfaces and interface-sets, consider the following limitations:
On devices supporting the Modular Port Concentrator 2 (MPC2), a slow internal refresh cycle for queue statistics can occur. This refresh cycle can be lengthy at full line-card scale. This cycle can be lengthy at full line card scale. If the subscription frequency is higher than the internal refresh cycle, exported data may appear stale across reporting intervals.
The unified in-service software upgrade (ISSU) feature lets you upgrade devices between two different Junos OS releases with no control-plane disruption and minimal traffic disruption.
The subscription frequency must exceed the time required to export telemetry. If the volume of data can't be exported before the next reporting interval, the export continues to completion, and the next reporting interval immediately starts. In such scenarios, continuous streaming results—behavior that might not be wanted.
Multiple sensors from the dynamic-interfaces sub-tree can be subscribed to simultaneously. Because a single Junos component supports streaming of these sub-tree sensors, the time to export the sensor data for each subscription might extend.
Enable export only for active queues. To enable export only for active queues, include the
queuesstatement at the [[edit dynamic-profiles profile-name telemetryqueue-statistics $junos-interface-name]or [[edit dynamic-profiles profile-name telemetry queue-statistics $junos-interface-set-name]hierarchy level. This approach reduces the volume of data for each reporting interval.
Platform-Specific Behavior
|
Platform |
Difference |
|---|---|
|
MX Series |
|
See Also
gRPC Sensors for Subscriber and Queue Statistics for Dynamic Interfaces and Interface-Sets (Junos Telemetry)
Starting with Junos OS Release 18.4R1, MX Series routers are supported.
Use subscriber and queue statistics for dynamic interfaces and interface-sets to support remote analytics and monitoring on Juniper devices that operate as a Broadband Network Gateway (BNG). Using these statistics, you can model and condition traffic flows in a subscriber access network.
Figure 2 shows the structure of the sensors or resource paths used for subscription to the external collector. The resource paths are a combination of both meta-data and statistical data.
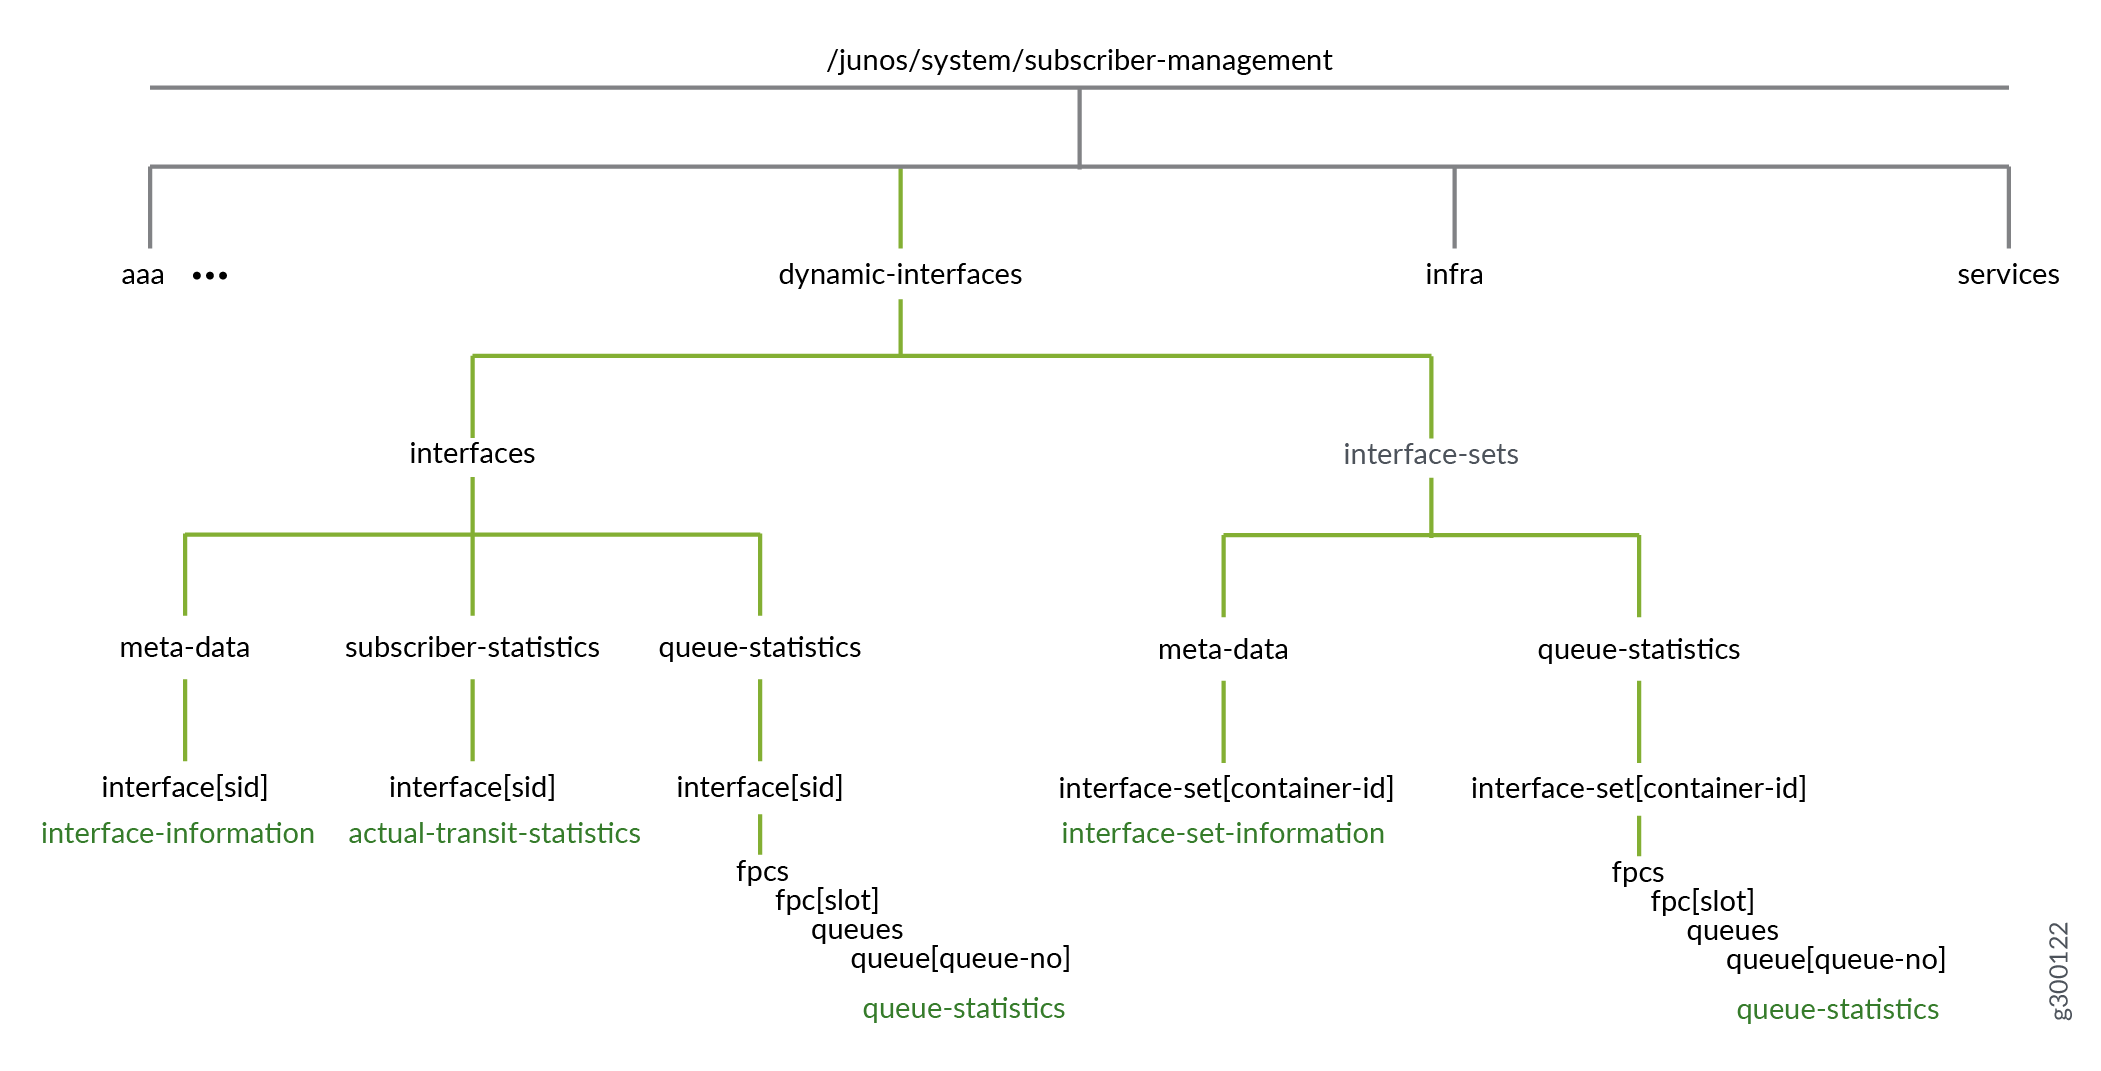
For statistics delivery through a gRPC subscription, include one or more resource paths from Table 2 in the subscription. For statistics delivered through gRPC, you will also need to install some additional software enable statistics to be exported on your Juniper device through the Junos CLI. For more information about creating a subscription, see Configure a NETCONF Proxy Telemetry Sensor in Junos and Enable Export of Subscriber Statistics and Queue Statistics.
|
resource path |
Description |
|---|---|
|
|
Sensor for subscriber interface-set information. This sensor is supported on MX Series routers starting with Junos OS Release 18.4R1. ON-CHANGE streaming is supported. The following end paths are supported:
|
|
|
Sensor for subscriber interface information. ON-CHANGE streaming is supported. The following end paths are supported:
|
|
|
Sensor for actual accounting statistics for dynamic subscriber interfaces. The following end paths are supported:
|
|
|
Sensor for queue statistics for dynamic interfaces. The following end paths are supported:
|
|
|
Sensor for queue statistics for dynamic interface-sets. The following end paths are supported:
|
See Also
Change History Table
Feature support is determined by the platform and release you are using. Use Feature Explorer to determine if a feature is supported on your platform.