Traffic Menu: Traffic Load
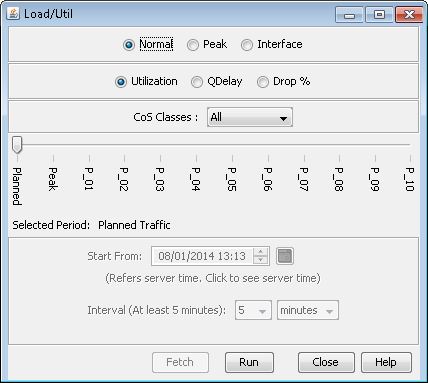
Select Traffic Load to open the Load/Util window. The window options may vary depending on the hardware type. The most basic window will contain the Normal and Peak radio buttons and the slider bar. Router modules will have an additional option for live interface (for Layer 3) or tunnel (for Layer 2) traffic and the option to fetch historical traffic from the database from a selected starting period and at a selected time interval. The link utilizations on the map will reflect planned traffic, worst-case traffic, or a certain time period of traffic (up to 24) by moving the horizontal slider.

-
The Planned period reflects the loading based on the bandwidth specified for each demand in the demand file (this can be set to the peak payload per demand for a specified time interval, measured and extracted by the hardware device's management platform).
-
The Worst period (for the Normal traffic load option, based on the trafficload file) provides the traffic loading supposing each demand is at its worst period (maximum value) among the 24 periods in the traffic load file, even though these could actually occur at different times. For router modules, with actual measured interface traffic, the Worst period (for the Interface or Tunnel option), will show the highest value of the 24 periods.
-
Following the Planned and Worst periods are up to 24 periods based on the “trafficload” file that is referenced to from the specification file.
The program will follow the hardware's implementation of demand routing and bandwidth allocation as in the Path Provisioning mode of simulation. Once the demand path is established, traffic load information for each demand is then loaded onto the network model. By using measured traffic, snapshots of actual trunk utilization can be analyzed and a better understanding of the impacts under failure conditions can be gained.
|
Field |
Description |
|---|---|
|
Normal |
Displays link utilizations based upon the routing of specified demand/flow traffic. In the specification file, traffic input is read in from the “trafficload” file. Note: For the Router module with MPLS enabled features, if Layer 2 (tunnel layer) is selected, then selecting Normal in the Load/Util window displays the link utilizations based upon the routing of tunnel traffic that is specified in the “tunnel trafficload”, or “T_trafficload” file in the specification file. This file has a format similar to that of the “trafficload” file. |
|
Peak |
This option is only applicable after you have run a failure simulation scenario (and has checked the Include Traffic Load box in the Simulation Script Options). Peak represents the highest (or worst) link utilization loading experienced by each link, depending on the rerouting of the demand/flow traffic after any single failure. If 24 periods of traffic are specified in the “trafficload” file, then the peak utilization will represent the worst loading on that link during each of the 24 periods. |
|
Utilization |
Displays the results as link utilization on the topology map. This is the default. |
|
QDelay |
Displays the results as queuing delay (in milliseconds) on the topology map according to a custom map legend. |
|
Drop |
Displays the results as drop percentage on the topology map according to a custom map legend. |
|
Run |
Starts running the animation that is reflected on the topology map. Begins with Planned, Worst, and is followed by the periods of traffic. |
Router-Specific options
|
Field |
Description |
|---|---|
|
Interface |
This option appears if you are in the Layer 3 (Demand) view and displays link utilization based on traffic actually measured at the interface. This differs from the “Normal” option which displays the utilization based on the routing of traffic associated with end to end flows. Interface traffic can be read from two sources:
After selecting a start date and time interval, click Fetch to fetch the data from the database. Subsequently, you can replay the historical traffic using the Run button or view the traffic in chart format via the Traffic Load > Measured Interface Traffic menu. |
|
Tunnel |
This option appears if you are in the Layer 2 (Tunnel) view and displays tunnel traffic at an interface. Tunnel traffic can be read from two sources:
After selecting a start date and time interval, click Fetch to fetch the data from the database. Subsequently, you can replay the historical traffic using the Run button or view the traffic in chart format via the Traffic Load > Tunnel Traffic on Link menu. |
|
CoS |
By choosing a particular Class of Service (CoS), the traffic statistics associated with that CoS can be displayed. This information is based on demands, as opposed to measured data. |
|
Start From... Interval and Fetch |
This panel is only applicable for router modules if you have run traffic data collection live, using the Traffic Collection Manager, which stores the traffic data into a database. You should first select a starting date and then an interval between the periods, and then click ‘Fetch’ to load the summarized traffic data. After the status message says “Traffic Ready,” then, click on ‘Run’ or open the appropriate traffic chart (Traffic Load > Measured Interface Traffic for interface traffic or Traffic Load > Tunnel Traffic on Link for tunnel traffic. |
