WAN Observability for experience-first networking Solution Brief
A solution designed to simplify the optimization of network resilience, performance, and end-user experiences. Get the right WAN infrastructure insights at the right time so you can focus on what matters.
Challenge
In transport networks, the volume and velocity of telemetry data generated is growing exponentially. This makes the task of gaining insight into the performance of the network and how it impacts end-users increasingly difficult. When problems do arise, detecting and resolving them has become more time-consuming.
Solution
WAN Observability from Juniper Routing Director provides highly curated, normalized, and intuitive views of overall network performance and health, and the resource performance KPIs that impact it. Its intuitive dashboards prioritize the highest-impacting KPIs and provide automated notifications when performance thresholds are crossed. Network engineers can quickly uncover problems and their root-causes and resolve them before the end user is impacted.
Benefits
- Accelerate MTTR by identifying high-priority resource performance issues
- Enhance network and service stability and resilience
- Lower the barrier to adoption for advanced network observability
- Accurately monitor performance versus intent
The Challenge
For enterprises and service providers, optimizing transport network performance is critical. Whether supporting large, distributed AI workloads, latency-sensitive applications, or consumer services, it’s essential that the underlying infrastructure is healthy and optimally configured. With external factors like power supply and cooling playing a key role in maintaining performance, the range and volume of metrics and KPIs needed to build a complete picture can seem overwhelming.
Network operations teams need to collect, process, correlate, and visualize all this raw data so they can quickly derive actionable intelligence. This applies to root-cause analysis and remediation, and the continuous optimization of WAN infrastructure.
The Solution
WAN Observability from Juniper® Routing Director (formerly Juniper Paragon Automation) provides a simple on-ramp to advanced network insight. Based on a combination of device telemetry and alarms, it provides a single page view of aggregated device, network, interface, and trust health. When combined with Intent-Based Service Orchestration, it automatically configures the performance and fault KPIs, along with alarm triggers, needed to monitor the fulfilment of user intent, with no human intervention. The intuitive UI lets you drill-down to specific domains or devices of interest. Its map view also lets you easily zoom in to specific locations.

Figure 1: A device health dashboard
The solution provides curated, correlated views of the resource performance KPIs that have the highest impact on your desired business outcomes, so you can avoid the complex, time-consuming process of manually normalizing and correlating your network telemetry data and quickly pinpoint the performance KPIs that matter most.
AI/ML based dynamic thresholding automatically notifies you when any KPI anomaly arises, so you can quickly investigate, identify, and resolve the root-cause before the issue cascades into a high severity user-impacting problem.
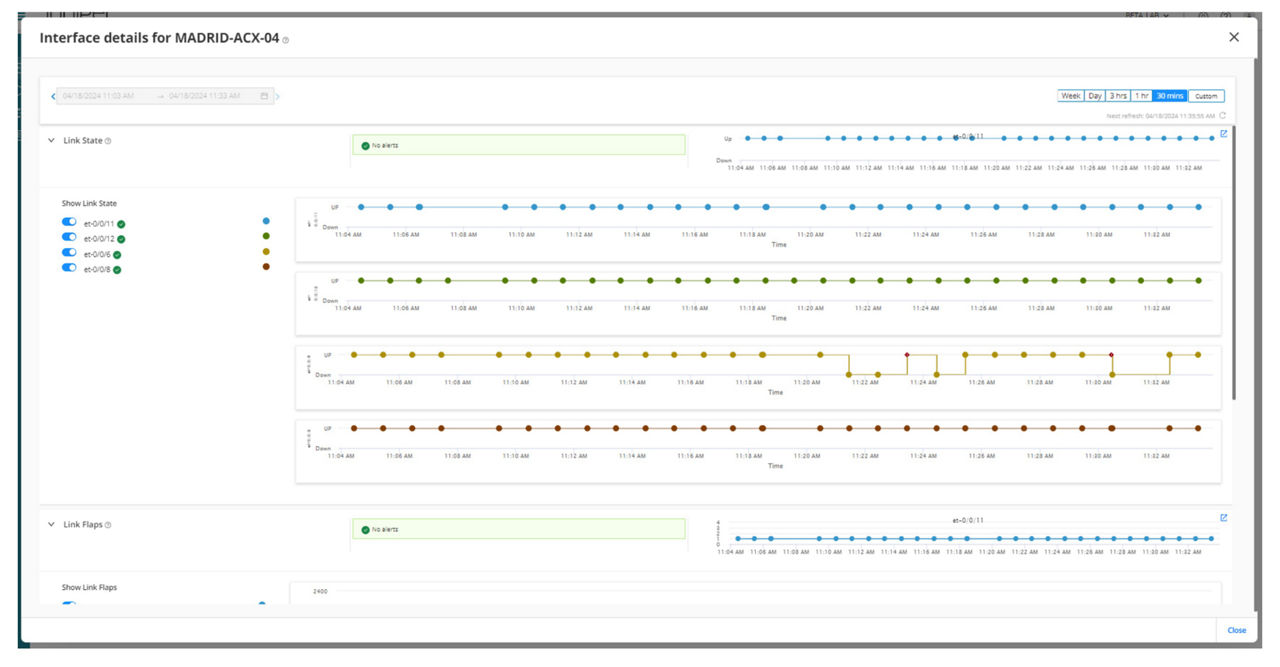
Figure 2: Drilling down into a device interface health dashboard
Features and Benefits
| Capability | Business Benefit |
One integrated capability covering four observability domains:
|
|
| Automated AI/ML based thresholding for anomaly detection and alerting |
|
| Geospatial (map-based) visualization of network performance |
|
| Integrated network trust & compliance visualization |
|
Solution Components
WAN Observability from Juniper Routing Director is enabled by multi-domain data collection and normalization; graphing and drill-down; configurable alerts and notifications; and configurable dashboarding with geospatial mapping:
1. Multi-domain data collection and normalization: The solution collects up to 71 KPIs across the device, interface and routing domains, including CPU and memory utilization, fan speeds, PSUs, locations, versions, BGP, OSPF, IS-IS, RSVP, LSP and DSP, hardware health (power supply health, fans, CPUs, memory, temperature), interfaces (health, throughput, power consumption, temperature), software versions (including remote upgrade capability), security compliance (based on regular scans and SIRT comparisons), routing protocols, and neighbor/edge connectivity.
2. Intuitive graphic and drill-down: The solution enables the user to quickly drill-down into areas of interest, starting with a global geospatial view, or an overall health view and zooming in or drilling down to support root-cause analysis and troubleshooting.
3. Configurable alerts and notifications: The solution supports self-service events (alerts and notifications) configuration, including notifying specific groups in real time when an event occurs.
4. Geospatial mapping engine: The solution can render a network topology over a map view, with a ‘side by side’ events window allowing the user to quickly identify specific locations or regions where problems are occurring.
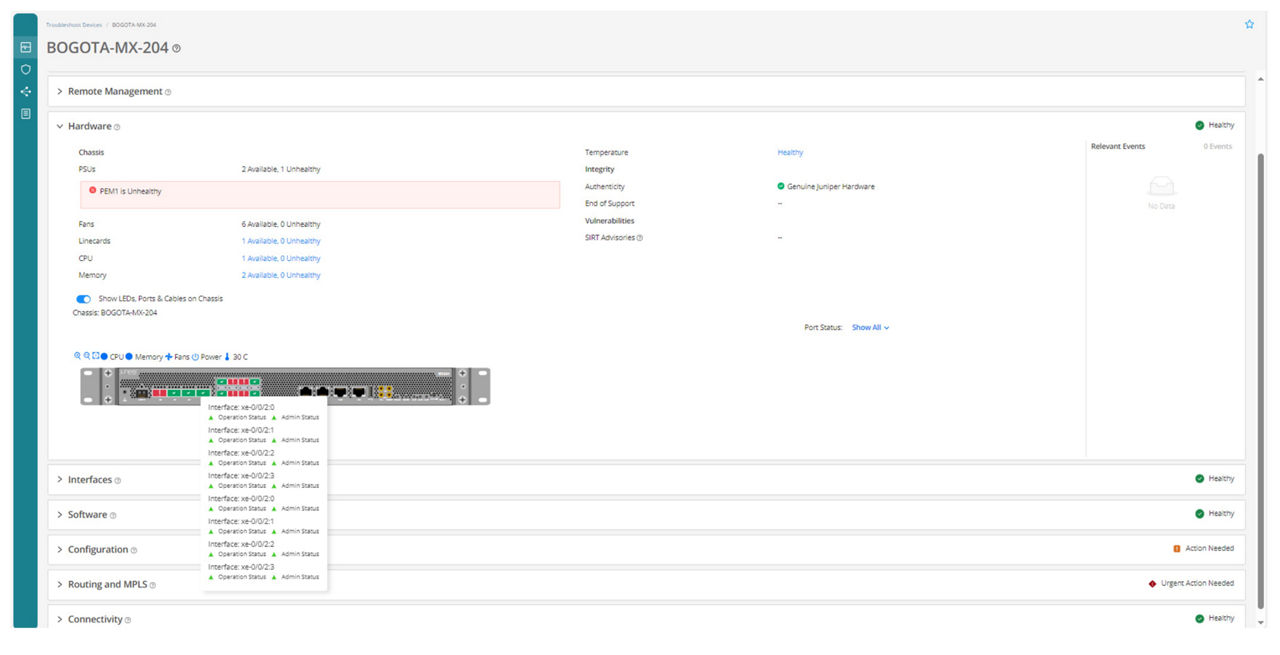
Figure 3: A hardware health dashboard
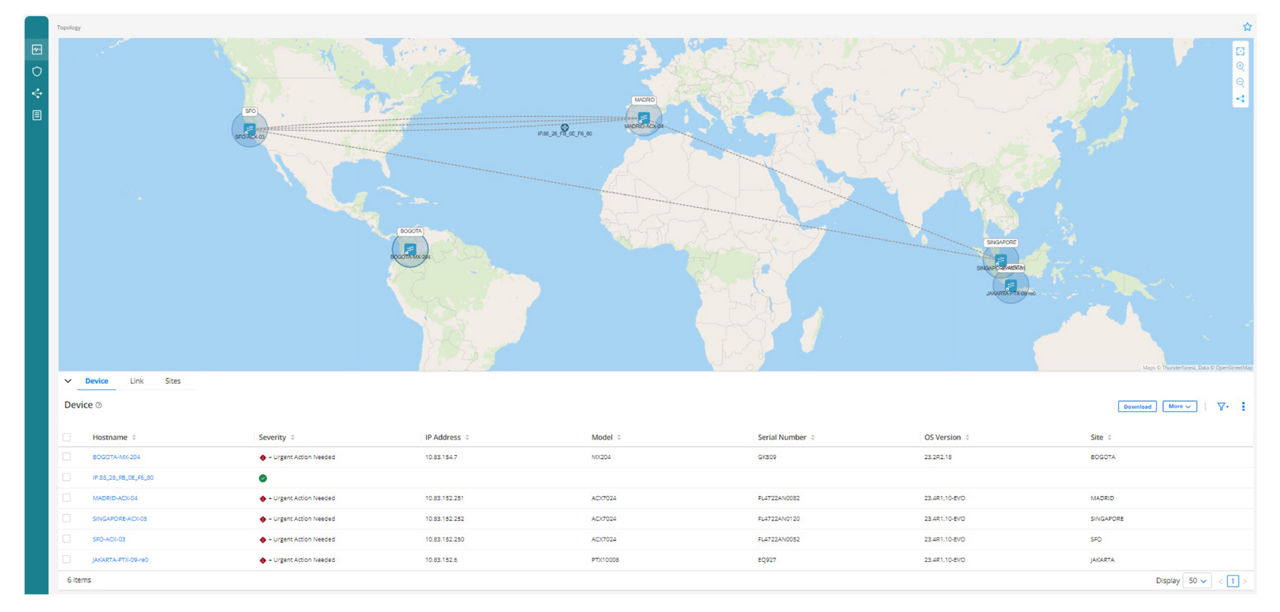
Figure 4: A geospatial network topology view
A rapid on-ramp for advanced observability in transport networks
Supporting advanced use cases like networking for AI workloads requires a network that is always performing at the highest level. WAN Observability from Routing Director enables you to quickly make sense of the huge volume and velocity of telemetry data generated by your networks. It gives you actionable intelligence into domains and locations of sub-optimal performance, so you can quickly identify and resolve issues, while continually optimizing overall network performance and resiliency.
Next Steps
- Learn more about Routing Director and its base use cases, including network trust and compliance and device lifecycle management.
- Contact your Juniper sales representative for a live demonstration
About Juniper Networks
Juniper Networks believes that connectivity is not the same as experiencing a great connection. Mist™, Juniper’s AI-native networking platform, is built from the ground up to leverage AI to deliver exceptional, highly secure, and sustainable user experiences from the edge to the data center and cloud. Additional information can be found at juniper.net or connect with Juniper on X (formerly Twitter), LinkedIn, and Facebook.
3510819 - 002 - EN JUNE 2025


