Juniper Paragon Active Assurance Datasheet
Download DatasheetProduct Overview
The transition to hybrid virtual/ physical networks and service chains introduces new points of failure. Traditional service assurance techniques, which collect counters and telemetry data from devices in the infrastructure, are not designed to determine whether a service is properly working from the end user’s perspective. Furthermore, traditional assurance solutions have limitations in helping service operations centers (SOCs) assess the real customer experience over the lifetime of the service. With Paragon Active Assurance, customer-facing teams can automate turn-up testing processes and gain continuous end-to-end service quality insights to proactively enhance the customer experience.
Product Description
Juniper® Paragon Active Assurance (formerly known as Netrounds) is a programmable, active test and service assurance platform for physical, hybrid, and virtual networks. Unlike passive test and assurance approaches, Paragon Active Assurance uses active, synthetic traffic to verify application and service paths at the time of delivery and throughout the life of the service.
Service delivery teams leverage Paragon Active Assurance to verify new service deployments and changes. Paragon Active Assurance verifies and ensures that services are configured correctly the first time. It also validates service changes to make sure they do not impact service performance. By automating initial service verification and testing, service delivery teams reduce time to revenue, lower operating expenses associated with service delivery, and reduce failed service delivery rates.
Network operations teams use Paragon Active Assurance to identify, understand, troubleshoot, and resolve issues before customers notice them. The visibility into service performance provided by Paragon Active Assurance reduces incident resolution times by as much as 50%, resulting in greater customer satisfaction and retention.
Paragon Active Assurance provides a fully integrated solution for multilayer, multidomain service life-cycle management, letting you verify that each provisioned service works when delivered and continues working throughout its lifetime. It also reduces manual efforts through automation, significantly decreasing operational costs and improving operating margins.
Architecture and Key Components
Leveraging a virtual, cloud-ready platform, Paragon Active Assurance is easy to deploy and adopt, enabling you to start small and scale as your business needs grow.
The core component of Paragon Active Assurance is a cloud-ready multitenant Control Center, which provides a user-friendly Web portal GUI where operations staff can run on-demand tests and view real-time and aggregated results as well as key performance indicators (KPIs) and service-level agreement (SLA) monitoring metrics. The Control Center includes a feature-rich cloud API allowing external operations support systems (OSS) and Network Functions Virtualization (NFV) orchestrators to easily automate distributed activation tests or monitoring scenarios.
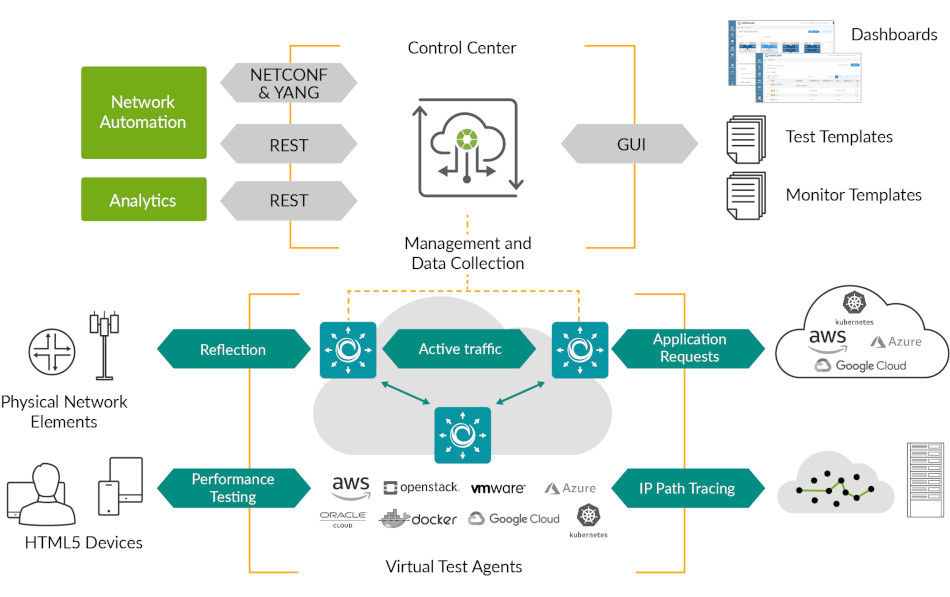
Figure 1: Paragon Active Assurance architecture
The Control Center remotely controls Paragon Active Assurance software-based and traffic-generating Test Agents, which provide distributed measurement metrics for service activation testing, quality monitoring, and troubleshooting. It also displays detailed, real-time results and statistics actively measured by the Test Agents and reflector streams across multiple applications, services, and interfaces. Test Agent capabilities include service activation (Y.1564, MEF 48), network performance (UDP, TCP, Y.1731, TWAMP, path trace), Internet performance (HTTP, DNS), rich media (IPTV,OTT video, Netflix, VoIP telephony, and SIP), as well as support for controlling Wi-Fi interfaces, and performing remote packet inspection.
Test Agents may be placed in strategic locations across your network for continuous quality monitoring. They may also be installed on demand for more temporary purposes, such as activation testing of newly deployed services. Test Agents are available in several formats: as software to be run as a virtual machine on a hypervisor, as a container application, or as a software appliance for installation on dedicated x86 hardware.
Key Capabilities
Real-Time Aggregated Views of Monitoring and Tests
Paragon Active Assurance calculates and visualizes errored seconds (ES) and SLA compliance indicators. Aggregated result views show large numbers of distributed active measurements. Measured data can be presented down to 1 second resolution, with an historical timespan adjustable from the last 15 minutes to years in the past.
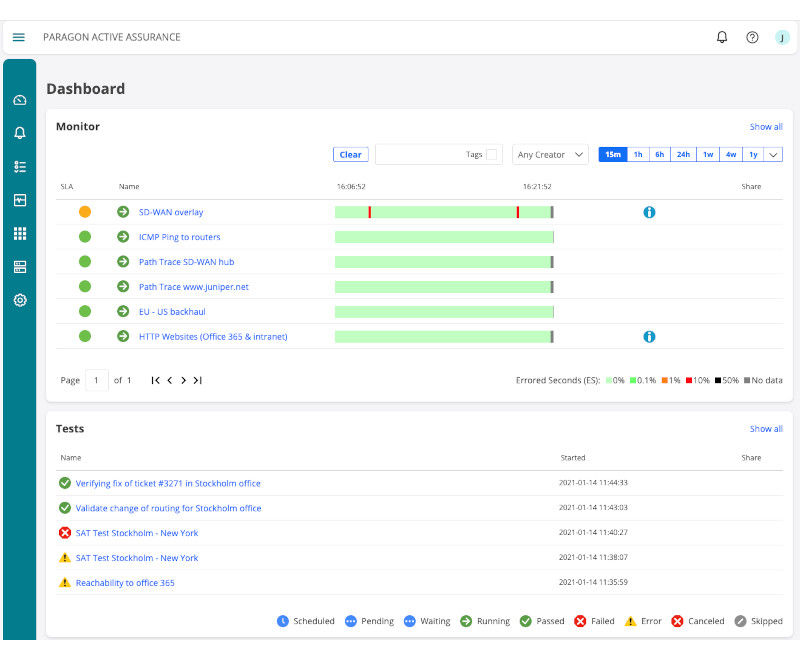
Figure 2: Real-time aggregated views of monitoring and tests
Periodic Reports and Alarm Generation
SLA compliance is presented for each quality monitoring scenario and periodic test in comprehensive and configurable reports. These reports can be scheduled and e-mailed to stakeholders at custom intervals, or they can be retrieved programmatically through the Control Center’s API. Alarms with multiple severity levels (critical, major, minor, warning) can be sent as SNMP traps.
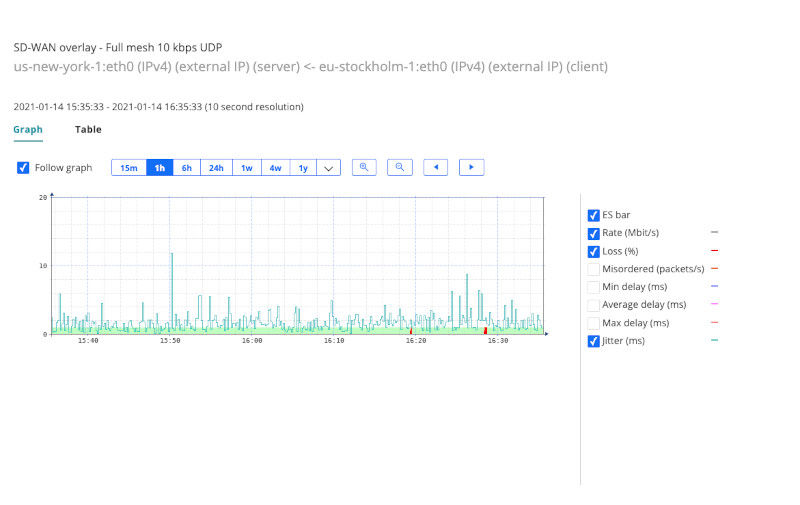
Figure 3: SLA monitoring
Dynamic Test Agent Inventory
Test Agents automatically discover and register Control Center login servers. Test Agents appear as resources in the inventory once launched by the NFV orchestrator or OSS, or connected physically to the network.
Test Agents can be tagged for simple grouping and structuring. Test Agent interfaces can be configured remotely from the Control Center.
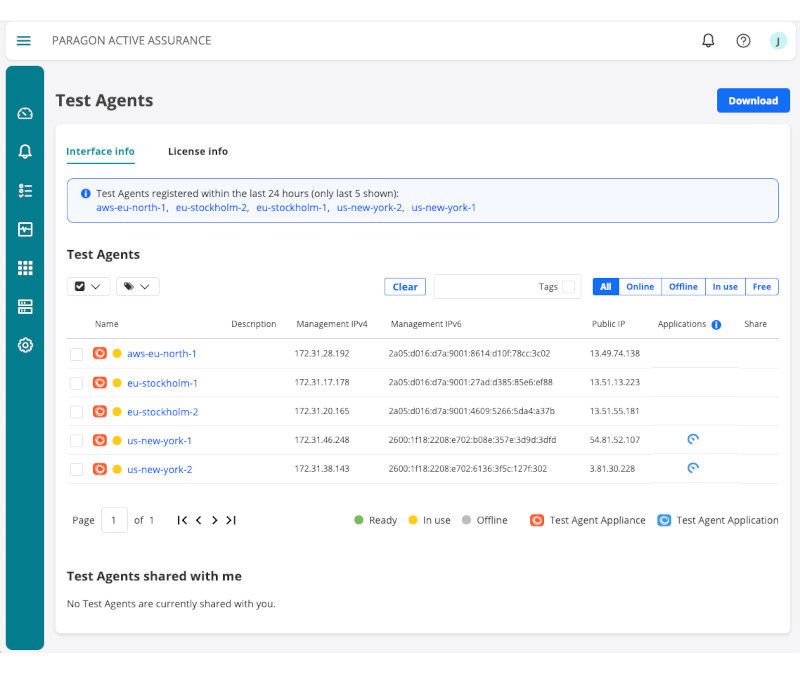
Figure 4: Inventory of Tests Agents registered with the Control Center
Builder GUI for Scenarios and Templates
The Paragon Active Assurance Web GUI has an intuitive test sequence builder which can be used in the service design process. SLA compliance thresholds can be set for each monitoring scenario.
Test building blocks can be saved as reusable templates, where parameters can be left to be defined at runtime. Tests and monitoring sessions can be triggered by the OSS through APIs.
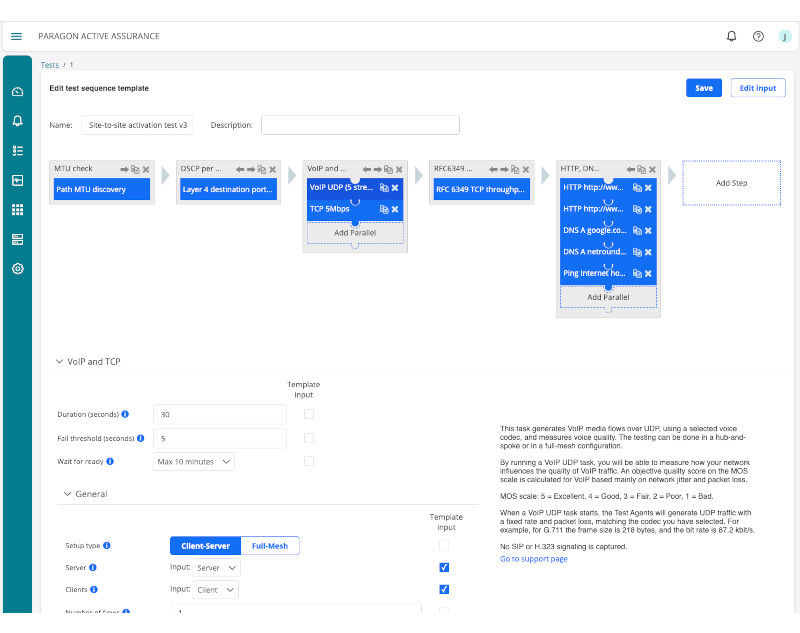
Figure 5: Test Templates Builder
Sharing and Collaboration
Test and monitoring scenarios and templates, active Test Agents, and all test results and reports obtained can be freely shared among users in the same multitenant Control Center. Also, unique URLs can be shared to external users, with or without password protection enabled.
Key Benefits of Paragon Active Assurance
Paragon Active Assurance offers the following benefits:
- Integrated, dynamic solution for full multilayer, multidomain service life-cycle management—Combined service activation testing, quality monitoring, and troubleshooting provide fully orchestrated assurance.
- Virtualized and cloud-ready—Flexible deployment and elastic scaling on all major modern virtualization platforms allows you to start small and scale.
- Easy to get started—Software-only and hosted components allow for smooth introduction, enable immediate use, and bring instant value.
- Automation through well-documented complete API—Simple integration of fulfillment and assurance workflows eliminates manual work and reduces cost of complex integration.
Features and Benefits
Control Center
The Control Center is either hosted by Juniper Networks and offered as a Software as a Service (SaaS) solution or deployed on premises in a private cloud. In either case, it displays both second-by-second and aggregated real-time results, as well as KPIs and SLA monitoring metrics.
| Feature | Benefit |
| Feature-rich cloud API for distributed on-demand tests and live monitoring of end-user KPIs | Enables closed-loop, fully automated workflow by providing KPIs of actual end-user experience to service orchestrators/OSS |
| Centralized storage and aggregation of test results and SLA monitoring metrics | Allows effortless handling of hundreds or even thousands of concurrent measurements across your network |
| Web portal for creation and initiation of test scenarios and automation templates | Supports design time and runtime dynamic test processes, as well as remote troubleshooting |
| Real-time KPIs, dashboards, and drill-down charts | Provides real-time actionable insights into how your network and services perform from a customer perspective |
| Centralized and dynamic inventory of distributed, traffic-generating Test Agents | Presents a consolidated user interface for all Test Agents—no need to manage Test Agents individually |
| Remote updates of Test Agent software | Reduces maintenance costs with remote and automated updates, keeping your Test Agents up to date |
| Emulated 5G user equipment and gNodeB | Validate that 5G network services and slices deliver on SLAs by testing through the 5G core functions and user plane |
The Control Center has a wide range of built-in core features that are exposed over either an intuitive Web portal user interface or a complete read/write API. The Web portal is used for test design, on-demand initiation of tests, remote troubleshooting, and real-time reconfiguration of service assurance scenarios and thresholds. The API is used by external systems such as OSS and NFV orchestrators to dynamically launch new Test Agents and initiate activation tests and quality monitoring scenarios.
The Control Center can be made available in two ways—hosted in the Amazon AWS public cloud infrastructure or installed on premises or as a private cloud solution. Both deployment options share the same core features, Web portal, and API.

Figure 6: Supported protocols by OSI layer
Test Agents
Test Agents actively generate authentic traffic and analyze detailed, real-time measurements across multiple applications, services, and interfaces. Test Agent capabilities include measurement of network performance (UDP, TCP, Y.1731, TWAMP), IPTV and over-the-top (OTT) video, including Netflix stream speed tests, and Internet (HTTP, Ping, HTML5 Performance Tests), as well as VoIP and Session Initiation Protocol (SIP) telephony, mobile radio, Wi-Fi, and remote packet inspection.
In addition to deploying the Test Agent for TWAMP reflection based testing of multivendor devices, specifically for Junos devices, the Test Agent can also collect TWAMP session results from measurements done by the Juniper Routers using the NETCONF protocol to evaluate errored second thresholds and report back to the Control Center on SLA adherence based on delay, jitter, loss and other performance metrics.
All Test Agents are controlled and updated remotely through the Control Center. The Control Center in turn can be accessed through a Web GUI or through a cloud API.
External OSS and NFV orchestrators easily automate distributed activation tests and quality monitoring through a feature-rich cloud API to the Control Center. Network operations staff access the user-friendly Web interface as a test design environment, as well as for on-demand tests, quality monitoring, and real-time visualizations.
| Feature | Benefit |
| Genuinely software-based | Suitable for both virtualized and traditional networks |
| Instant remote Test Agent deployment | No need for field efforts using expensive hardware tools |
| Traffic generating capabilities | Activation tests, quality monitoring, and remote troubleshooting from the end-user perspective |
| Versatile features and tools | Complete system for assessing end-user experience |
| Centrally managed | Consistent interface and back-end for users and orchestrators |
Product Options
Hosted: The Control Center is hosted in the Amazon AWS public cloud infrastructure and managed by Juniper Networks. This solution scales transparently and elastically with the number of Test Agents deployed; there is no need for any involvement from you as a Juniper Networks customer. The server software and the repository of Test Agent software are always kept up to date.
On Premises: The Control Center is deployed on premises in your own data center environment, either on bare-metal servers or on existing private cloud infrastructure, and is managed either by your organization or by Juniper Networks as a managed service. The option of deploying a TimeScaleDB for direct queries from an external dashboard is available.
| Hosted Option | On-Premises Option |
| Deployed as a securely hosted SaaS solution in the Amazon AWS public cloud infrastructure | Installed on premises in private cloud infrastructure or private data centers |
| Offers a flexible subscription business model | Offered as licensed software |
| Operated and managed by Juniper Networks as part of the subscription agreement | Operated and managed by Juniper Networks as a service or managed by Juniper customer |
| Scales from single Test Agent deployments to nationwide or multinational rollouts | Starts at deployments of 10+ Test Agents to nationwide or multinational rollouts |
| Subscriptions correspond to one individual tenant account in the hosted, multitenant Control Center | Dedicated multitenant solution with individual dashboards for the service provider and their enterprise cus-tomers |
| Frequent updates for Control Center software, as well as for repository of software for all Test Agent types | Update frequency determined by customer for Control Center, as well as for repository of software for all Test Agent types |
| User authentication handled by Control Center | User authentication can optionally be done against an LDAP or TACACS+ server |
Specifications
Control Center Interfaces
| Interface | Description |
| Northbound user interface towards operations staff | Browser GUI towards Web portal
|
| Northbound API towards OSS and NFV orchestrators | REST
NETCONF and YANG
STREAMING API
|
| Southbound interfaces for remote control and configuration towards active Test Agents | Test Agents
|
Test Agent Types
Test Agents come in three main varieties.
Test Agent Software Appliance
The Test Agent Software Appliance is integrated with an optimized Debian Linux OS. The appliance can be packaged and delivered in a number of ways:
- Dedicated Test Agent—Test Agent Software Appliance is downloaded by the customer and installed on customer-provided x86 hardware.
- Test Agent Virtualized Network Function (TA VNF)—Test Agent image is downloaded by the customer and run as a virtual machine (VM) on a hypervisor.
These options have identical traffic-generating capabilities and differ only in terms of packet performance, which is determined by available CPU resources and interface speeds.
Test Agent Application
The Test Agent Application consists of software and can be packaged and delivered in two ways:
- Test Agent Application—Consists of software downloaded by the customer and is installed as an application on a Linux machine.
- Test Agent Cloud-Native Network Function (TA CNF)—The Test Agent Application can optionally run as a container in any environment that supports it. The containerized application is in a position to approximate very closely the performance of other applications running on the same virtual machine.
Test Agent Natively Pre-integrated into Junos® OS Evolved-based Network Equipment
The Test Agent natively pre-integrated in Junos OS Evolved-based network equipment gives network operators an easy way to use active testing, monitoring, and troubleshooting on the data plane. It goes beyond traditional embedded test functionality for basic TWAMP and Y.1731 use cases by providing more fine-grained measurements for richer network KPIs. Test Agent supports UDP, TCP, HTTP, DNS, Ping, PathTrace, IPTV, and OTT video.
Test Agent Software Appliance—Downloadable Software for Standard x86 Hardware
| HDD | Bootable USB | |
| Usage | Permanent installation on physical block storage device (HDD) | Live booting from USB memory stick for temporary transformation of any x86 PC hardware into a Test Agent |
| Delivery format | Delivered as installation ISO image | Delivered as raw disk image |
| RAM requirement | 256 MB minimum; 512 MB recommended | |
| Storage requirement | 4.1 GiB | Min. 4.1 GiB storage on USB memory |
| Recommended network interface cards (NICs) | Intel NICs recommended | |
| NIC driver support | Same as supported by Linux Debian | |
Test Agent Virtual Network Function—Downloadable Software for Hypervisors
Below is a comparison of the various Test Agent virtualized network function (TA VNF) formats.
| Raw/Qcow2 | Open Virtualization Format (OVF)/Virtual Machine Disk (VMDK) | Amazon Machine Image (AMI) | Virtual Hard Disk (VHD) | Google Cloud Platform (GCP) | |
| Type | Preinstalled and bootable appliance | ||||
| Delivery format | Raw or Qcow2 disk image | VMDK disk image plus OVF file | AMI | VHD disk image | GCP image |
| Orchestration support | OpenStack Heat Orchestration Templates (HOT) using cloud-init | VMware vCloud Director, VMware Integrated Open-Stack (VIO) | AWS CloudFormation templates | Azure ARM templates | Google Deployment Manager |
| Hypervisor support | KVM | VMware vSphere | Xen | Azure Hypervisor | Google Cloud Platform |
| Example platforms | OpenStack | ||||
| Download image size | Raw: 4.1 GiB /gzipped raw: 176 MiB / Qcow2: 463 MiB | OVA: 190 MiB / VMDK: 210 MiB | 4.1 GiB | 4.1 GiB | 4.1 GiB |
| Minimum machine type requirement | Minimum: 1vCPU / 256 MB Recommended: 2vCPU / 4 GB | Minimum: 1vCPU / 256 MB Recommended: 2vCPU / 4 GB | Minimum: t3.nano Recommended: c5.large | Minimum: B1ms Recommended: D2 | Minimum: f1-micro Recommended: n1-standard-2 |
| RAM and storage requirements | RAM: 256 MB minimum; 512 MB recommended Storage: 2 GB | ||||
| SR-IOV, PCI pass through | Not required, but could improve accuracy and performance | ||||
| NIC driver support | Same as supported by Linux Debian | Same as supported by Linux Debian and VMware tools | Same as supported by Linux Debian | Same as supported by Linux Debian | Same as supported by Linux Debian |
Test Agent Application—Linux Application and Cloud-Native Network Function (CNF)
Below is a comparison of the Test Agent Application deployed as a Linux application and the same entity deployed as a container (CNF) for X86 and ARM Processor Architectures.
| Test Agent Application | Test Agent CNF | |
| Type | x86-64, ARM-64 (aarch64), ARM-32 (arm71) Linux application | x86-64 container |
| Delivery format | tar.gz package | Docker Hub or tar.gz package |
| Orchestration support | Application arguments | Kubernetes |
| Hypervisor support | N/A | Docker |
| Example platforms | N/A | AWS, GCP, Azure |
| Download size | < 10 MB | < 100 MB |
| RAM and storage requirements | RAM: 128 MB Storage: 10 MB | RAM: 128 MB Storage: 100 MB |
| SR-IOV, PCI pass through | N/A (uses host OS networking stack) | |
| NIC driver support | N/A (uses host OS drivers) | |
Test Agent Functionality
| Technology | Test Functionality |
| General Network Support | |
| Transport modes | Bridged Ethernet IEEE 802.1q VLAN IPv4 over Ethernet IPv6 over Ethernet |
| Physical link configuration | Duplex setting (full or half) Speed setting (10 Mbps-10 Gbps) MTU size (64-9000 bytes) |
| Media access control (MAC) addresses | Per physical port or VLAN Factory default User-defined |
| Bridge setup | Bridge physical ports and/or VLANs Multiple bridges (maximum 4 per Test Agent) IP hosts assigned to bridges |
| VLAN setup | Per physical port (maximum 125 per Test Agent) Full VLAN range (1-4095) Priority code point (0-7) |
| IP host setup | Multi-host (maximum 125 per Test Agent), one host per physical port or VLAN Separate routing tables per host DiffServ code point (0–63) Static addressing (gateway, DNS) DHCPv4, DHCPv6, stateless address autoconfiguration (SLAAC) DHCPv4 vendor class Use of IP host for management |
| DHCPv4 server setup | DHCPv4 server for other clients Per physical port or VLAN Network range Network prefix length Gateway and Domain Name System (DNS) |
| Interface status | Per physical port or VLAN Current speed/duplex Current MAC and IP address TX and RX packets TX and RX bytes |
| Supported Standards by OSI Layer | |
| L1—Physical Layer (dedicated Test Agents Software Appliance) | IEEE 803.2i: 10BASE-T IEEE 802.3u/x: 100BASE-TX IEEE 802.3ab: 1000BASE-T IEEE 802.3ae: 10GBASE-SR/LR IEEE 802.3ac: 1522 byte “Q-tag” IEEE 802.11g/n/ac: Wi-Fi/Wireless LAN ETSI/3GPP: GPRS/EDGE/UMTS/LTE |
| L2—Link Layer | RFC 826: Address Resolution Protocol (ARP) IEEE 802.1q: VLAN IEEE 802.1p: Protocol for Traffic Prioritization IEEE 802.1ad: QinQ, VLAN Stacking IEEE 802.1ag: Ethernet Loopback RFC 2131: Dynamic Host Configuration Protocol, DHCP RFC 3046: DHCP Relay Agent Information Option ITU-T Y.1731: OAM Functions and Mechanisms for Ethernet-based Networks ITU-T Y.1564: Ethernet Service Activation Test Methodology MEF 6.1.1: Layer 2 Control Protocol Handling |
| L3—Network Layer | RFC 791: IPv4 |
| L4—Transport Layer | RFC 736: User Datagram Protocol (UDP) |
L5—Session Layer | RFC 3261: SIP: Session Initiation Protocol |
| L7—Application Layer | ITU-T G.711: Pulse Code Modulation (PCM) of Voice Frequencies |
| Internet Performance Measurement | |
| General | Request/response-based |
| HTTP | HTTP server (URL target) |
| DNS | DNS server |
ICMP (Ping) | IP hosts (targets) |
| HTML5 Performance Tests | Test Agent as HTML5 performance test responder |
| Network Performance Measurement | |
| General | Test Agent to Test Agent traffic generation |
| UDP | Unicast or multicast |
| VoIP-like UDP | MOS scoring (1-5) |
| Stateful TCP | Number of point-to-point sessions |
| Multi-session TCP | Number of point-to-point TCP sessions |
| TCP throughput testing | RFC 6349: Framework for TCP Throughput Testing |
| Quality of Service (QoS) policy profiling | Multi-stream generation in each queue |
| Y.1731/802.1ag | ITU-T Y.1731 Ethernet Loopback, ETH-LB |
| TCP throughput testing | RFC 6349: Framework for TCP Throughput Testing |
| QoS policy profiling | Multi-stream generation in each queue |
| Y.1731/802.1ag | ITU-T Y.1731 Ethernet Loopback, ETH-LB |
| TWAMP | RFC 5357: Two-way Active Measurement Protocol |
| UDP loopback | Reflector device configured to loop back UDP packets in hardware |
| BWPing | Bandwidth and response times measured between Test Agent and router/switch |
Path trace | ICMP and/or UDP echo packets sent with increasing time to live (TTL) |
| IPTV and HTTP Streaming Video | |
| General | Request/response-based |
| IPTV Moving Picture Experts Group (MPEG) | Joining of multicast channels |
| IPTV MPEG inline | Interception of Internet Group Management Protocol (IGMP) pass through |
| IGMP channel zapping time | Continuous join and leave cycle |
| HTTP video streaming (OTT) | Apple HTTP Live Streaming (HLS) |
| Netflix streaming | Measure over HTTPS: |
| IGMP join/leave test | Checks if users can join and receive data on allowed multicast channels (and no others) |
| Multicast group limit test | Checks that a user can only join a specified maximum number of multicast channels |
| General | Hub and spoke |
| SIP signaling | Registration and un-registration |
| RTP media stream quality | MOS scoring (1-5) |
| Remote Packet Inspection | |
| General | Packets intercepted remotely from Test Agents |
| Direct packet capture | Filtered packets forwarded from individual |
| Packet capture through server | Filtered packets forwarded from group of Test Agents to Control Center for storage and centralized retrieval |
| Transparency | |
| General | Packet mangling and network transparency/QoS tests |
| L2 transparency— Ethertypes | Layer 2 transparency for various Ethertypes and logical link control (LLC)/Subnetwork Access Protocol (SNAP) |
| L2 transparency— Custom Ethertype | Checks that specified Ethertype passes through network |
| L2 transparency— VLAN | Verifies transparency for given VLAN tag, VLAN priority (PCP), and DSCP |
| L2 transparency— Custom VLAN | Checks that packets with given VLAN tag and priority (PCP) are not modified by network |
| L2 transparency— Ethernet control protocols | Checks transparency for Link Aggregation Control Protocol (LACP), Extensible Authentication Protocol over LAN (EAPoL), and Multiple VLAN Registration Protocol (MVRP) |
| L2 transparency— IP | Verifies IPv4 header integrity as well as IP multicast, checking that IP packets are not dropped |
| L2 transparency— IPv6 | Verifies IPv6 header integrity |
| L2 transparency— MAC address limit | Checks that number of MAC addresses is between a given minimum and maximum |
| L2 transparency— multicast | Verifies that multicast packets are not dropped (STP and MPLS protocols) |
| DSCP remapping | Verifies expected remapping of DSCP values between two points in a network |
| Layer 4 destination port DSCP remapping | Same as preceding but with specific UDP or TCP destination ports indicated |
| Path MTU discovery | Determines path maximum transmission unit (MTU) between two Test Agents |
| Security | |
| General | Tests primarily designed for Layer 3 networks Focused on: man-in-the-middle (MITM) attacks; denial-of-service (DoS) attacks; abuse-tracking of end users Test Agent acting as either customer or ISP |
| DHCP starvation | Checks that a customer can only obtain a limited number of IPv4 addresses |
| Fragmented DHCP packets | Checks that switch drops fragmented DHCP packets before they reach the control plane |
| Fragmented TCP/ UDP headers | Checks that switch drops IPv4 and IPv6 packets with fragmented TCP or UDP headers |
| Management protocol scanning | Checks that management protocols are unavailable at customer ports |
| Router redundancy protocol listening | Checks that Virtual Router Redundancy Protocol (VRRP)/ Common Address Redundancy Protocol (CARP), Gateway Load-Balancing Protocol (GLBP), and Hot Standby Routing Protocol (HSRP) are unavailable at customer ports |
| Routing protocols | Checks that routing protocols are not available on customer ports |
| Spanning Tree Protocol (STP) | Checks that STP is not available on customer ports |
| Wi-Fi | |
| General | Uses Intel Wi-Fi NIC (IEEE 802.11g/n/ac) if available on the host platform |
| Wi-Fi switcher | Configuration of MAC address, MTU, SSID, BSSID, type of authentication and cipher |
| Wi-Fi logger | Received signal strength indicator (RSSI) |
| 5G user equipment/gNodeB emulation | |
| General | Uses synthetic traffic from emulated user equipment and gNodeBs Verifies end-to-end 5G services and slice instances to deliver expected KPIs, for example, one-way latency measurements, jitter, or service response time |
| Emulated 5G user equipment/gNodeB traffic | Supports traffic encapsulated in a GTP tunnel Supports IPsec over GTP |
| 5G core testing | Test from the distributed 5G RAN through the 5G core network functions, for example, Access and Mobility Management Function (AMF), Session Management Function (SMF), User Plane Function (UPF) |
Ordering Information
Please contact your Juniper Networks sales representative for ordering information.
About Juniper Networks
At Juniper Networks, we are dedicated to dramatically simplifying network operations and driving superior experiences for end-users. Our solutions deliver industry-leading insight, automation, security, and assurance to drive real business results. We believe that powering connections will bring us closer together while empowering us all to solve the world’s greatest challenges of well-being, sustainability, and equality.
1000684 - 005 - EN JULY 2023


