Juniper Premium Analytics Datasheet
Download DatasheetProduct Overview
The Juniper Premium Analytics cloud service offers network and security visibility and business intelligence to drive your digital transformation journey. It provides insights into your network and business operations while overcoming the complex challenges associated with the influx of big data from a multitude of networks and clients. Use the service to:
- Empower IT and business teams with end‑to‑end network visibility to enable data‑driven decision making
- Eliminate challenges of data silos, providing actionable insights across wireless, wired, and WAN networks
- Support your ongoing network and security optimizations
Product Description
Juniper® Premium Analytics is an advanced, cloud-based analytics service that provides enterprises with end-to-end network observability. IT and line-of-business users can gain unique networking and location insights based on any combination of Marvis® AI-driven datasets. Simple dashboards make it easy to:
- Specify criteria and filters
- Identify issues and trends
- Generate, schedule, and email customized reports
Premium Analytics is the only analytics service of its kind that stores up to 13 months (or more) of data. This feature extends observability of historical data beyond the 30 days available with the standard Juniper analytics service, enabling users to perform long-term historical time series analyses of network, app, visitor, and employee behavior to enhance business decision making.
Premium Analytics helps IT professionals obtain insights across their entire network—wired, wireless, and WAN—to aid in planning their IT infrastructure, manage resources, gain insights into security events, and improve IT operations. Professionals in a range of vertical markets—including retail, healthcare, education, and hospitality—can use Premium Analytics to analyze long‑term trends, visitor behavior, and zone movement. Additionally, Premium Analytics provides facilities managers with insights to help them optimize space and manage assets and occupancy.
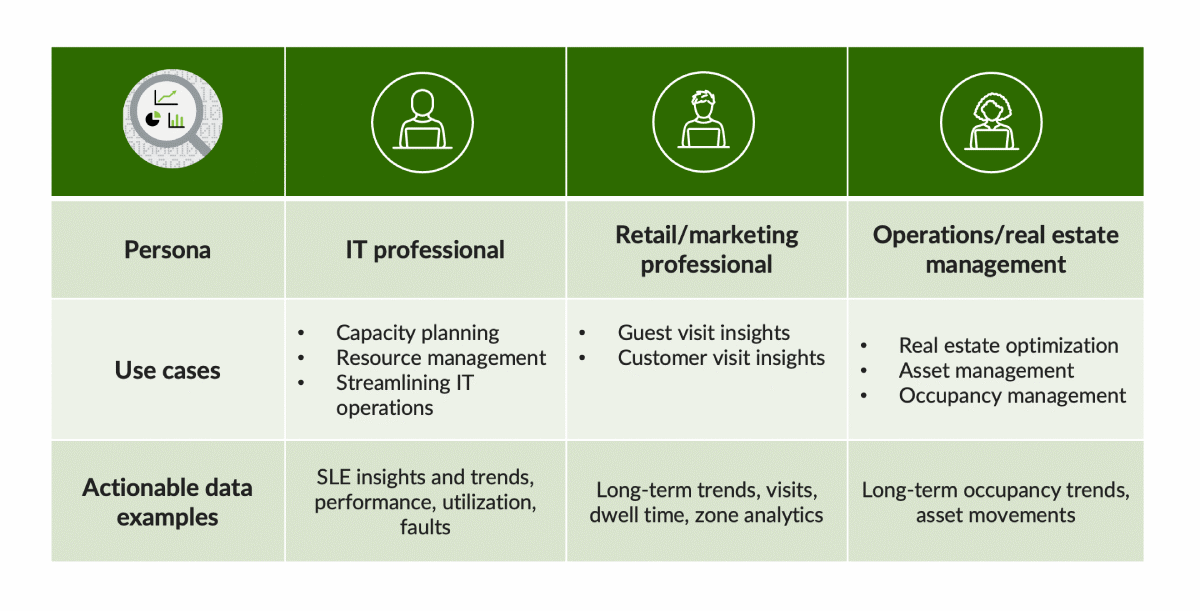
Table 1: Premium Analytics service use case examples
Features and Benefits
Wireless, Wired, and WAN Network Insights
To ensure that IT assets and controls meet the business expectations of your digital business, end-to-end network visibility, continuous monitoring, and actionable insights are critical. This involves not only identifying network infrastructure misconfigurations and issues, but also addressing deficiencies impacting applications, end users, and client devices.
With the Premium Analytics service, networking teams gain insights from client to cloud, allowing them to effectively identify and solve sub-par experiences. They can also use client and traffic utilization data for better planning, resource management, and for improving public safety (see Table 1). Sample networking use cases include:
- Monitoring and behavior reports for applications, traffic, and clients
- Monitoring historic and average service-level expectations (SLEs) across wired, wireless, and WAN domains
- WAN visibility for link and application quality of experience
- Ingestion and reporting from Juniper and third‑party network devices (not managed by Mist™ cloud)
- Insights on device OS and device manufacturers
- Traffic metrics on the basis of service set identifier (SSID), switch interfaces, or WAN zones
- Client access and authentication events, statistics, and trends
- Complete visibility into security events on the network
Gain Complete Visibility into Security and Network Access Events
In the world of security, having a clear view of what's happening on the network is essential to prevent attackers and other threats from infiltrating the network. Juniper Premium Analytics’ Security Assurance gives organizations the security insights they need with visibility into security and network access events within the Mist dashboard.
- Security Assurance helps security operations teams identify and respond to potential threats, reducing security risks and improving the organization's overall security posture.
- Access Assurance insights dashboards help network managers see connection trends and statistics for clients as well as access points (APs) and switches over time.
Juniper enables the integration of network and security domain—and provides an industry-first persona-based workflow response system—to enhance the user experience. Now, organizations can configure their security capabilities directly on the Juniper Networks SSR Series Routers and Juniper Networks SRX Series Firewalls through the Mist platform.
With the help of these integrated dashboards, network operations and security teams can easily detect and highlight security events and connection issues. It effectively addresses threats and suggests audit actions to improve operational workflows. Benefits include:
- Accelerating the time to mitigate threats
- Improved agility
- Reducing operational costs by saving time and mitigating potential damage
| Networking Dashboards | ||
| Wireless | AP Insights |
|
| Executive Summary: Wireless |
| |
| RF Health and Utilization |
| |
| Wireless Client Events |
| |
| Wireless Client Sessions |
| |
| Wireless IDS |
| |
| Wireless Network Insights (Figure 1) |
| |
| Wireless Site Comparison |
| |
| Wired | Executive Summary: Wired |
|
| PoE Switch Details |
| |
| Sustainability Analytics |
| |
| Switch Insights |
| |
| Wired Network Insights (Appendix Figure 1) |
| |
| Wired Site Comparison |
| |
| WAN | Peer Path Insights |
|
| Security Assurance (Appendix Figure 2) |
| |
| WAN Insights-SRX |
| |
| WAN Insights-SSR (Appendix Figure 3) |
| |
| WAN Speed Test Insights |
| |
| Other | Access Assurance Insights (Figure 2) |
|
| Audit |
| |
| Inventory |
| |
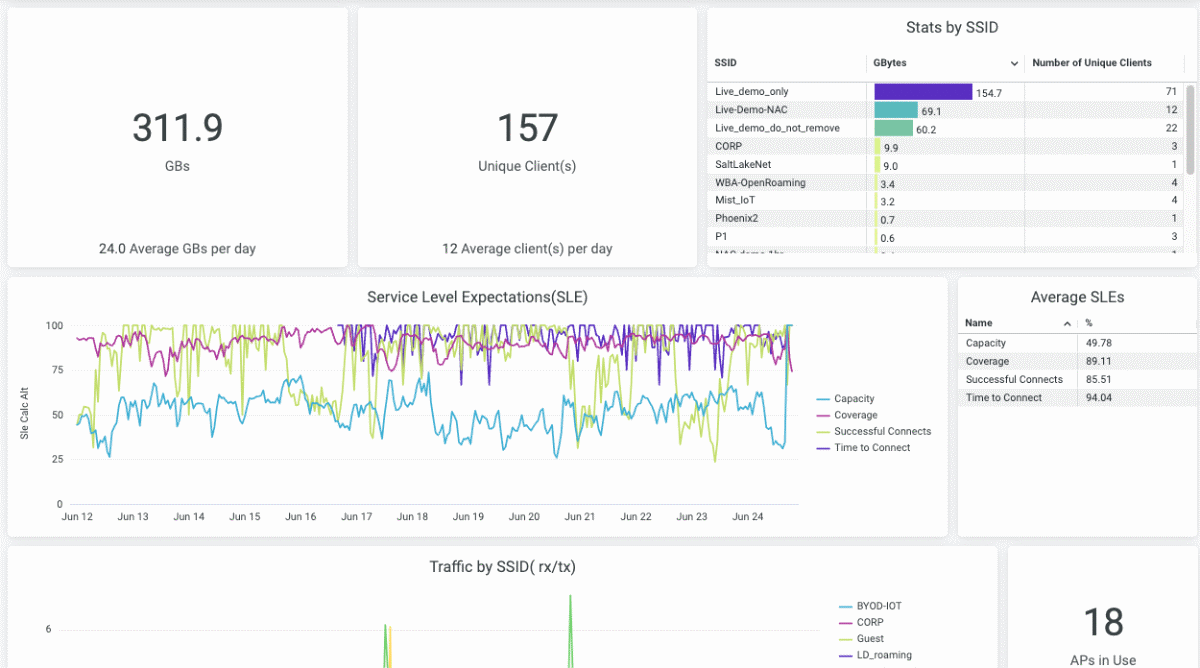
Figure 1: Top‑level view of the Wireless Network Insights dashboard that includes organization‑wide SLE and traffic trends; client distribution by device type, operating system, and 802.11protocols; traffic and applications insights by SSID and clients; and more
Freemium and Premium Analytics in Mist
The Mist dashboard includes a freemium version of analytics as part of Mist cloud services for Wired Assurance, Wi‑Fi Assurance, and Juniper Indoor Location Services. Data storage in freemium analytics is limited to 30 days. Premium Analytics provides deeper data analysis and visibility, leveraging long‑term (13 months plus) historical data.
| Features | Basic | Premium Analytics |
| Networks insights on wired and wireless | Y | Y |
| Security Assurance: Rogues and honeypots | Y | Y |
| Client connections: Trend and counts | Y | Y |
| Application visibility from Juniper wireless | Y | Y |
| Queries (rank, list, trend, and counts) | Y | Y |
| Custom queries: Unique devices on multiple WLANs (trend and counts) | N | Y |
| Average and historic service-level expectations beyond seven days | N | Y |
| Trend reports for applications, traffic, and clients | N | Y |
| Insights on device OS and device manufacturer | N | Y |
| Traffic metrics based on SSID, switch, switch interfaces, or WAN zones | N | Y |
| Access point ranking by clients and traffic | N | Y |
| Wireless security threat distribution and rogue access point trends | N | Y |
| Audit log reports for longer period | N | Y |
| Inventory reports | N | Y |
| WAN visibility for link QoE and application QoE | N | Y |
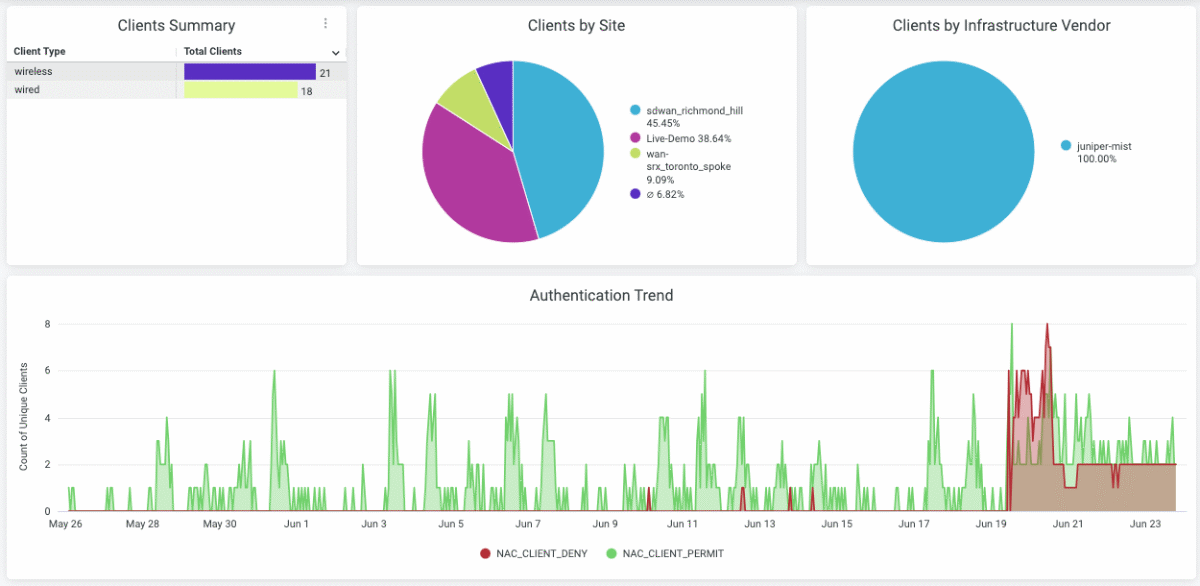
Figure 2: Top‑level view of Access Assurance insights that includes client and authentication trends, failed authentications distribution and trends, and an Access Assurance event list.
For more networking dashboard examples, see Appendix A.
Line of Business Insights
Business insights, including customer and employee engagement, occupancy analysis, and proximity tracing, have become top priorities for digital transformation initiatives, especially in hybrid workforce environments. Whether analyzing retail traffic flows, space occupancy and utilization in the enterprise, optimizing staff operations, or conducting real-time reporting of congested areas, operations and real estate management teams can benefit from network data insights to drive decisions around staffing, product placement, real estate planning, and proximity tracing.
Premium Analytics combines user engagement and asset visibility location services built into Mist, Juniper’s AI‑native networking platform with services from technology partners to deliver fast access to business insights supporting requested analytics about customers and guests.
Enterprises and retailers that segment end users and subscribe to the user engagement or asset visibility service can gain clear insights about areas frequently visited by customers. For retailers, this information helps drive more interactions with associates and customers, ultimately leading to higher basket sizes. For other enterprises, these insights can enhance workspace utilization and improve employee engagement. Retailers can also use the digital platform to support industry best practices for cross-selling and omnichannel marketing and sales initiatives.
Real estate management teams can also leverage occupancy analytics from Premium Analytics to optimize their building and real estate portfolio management (see Table 4). Using long‑term occupancy data, they can gain insights into how spaces are utilized, identifying peak usage times and underutilized areas. This enables more efficient allocation of resources, such as heating, cooling, and lighting, reducing operational costs and enhancing sustainability efforts.
Additionally, data-driven insights into tenant behavior and preferences can inform more strategic decisions regarding space renovations, reconfigurations and overall building use. By leveraging analytics, real estate managers can create smarter, more responsive, and cost-effective building environments.
Popular business analytics use cases include:
- Visitor segmentation and trends with dynamic categorizations
- Unique visitor trends with popular motion flows for user journey mapping and proximity tracing
| Line-of-business dashboards | ||
| Location | Asset Insights |
|
| Engagement Analytics (Figure 3) |
| |
| Occupancy Analytics (Figure 4) |
| |
| Occupancy Analytics – Users |
| |
| Occupancy Analytics by Zone |
| |
| Proximity Tracing and Occupancy Compliance |
| |
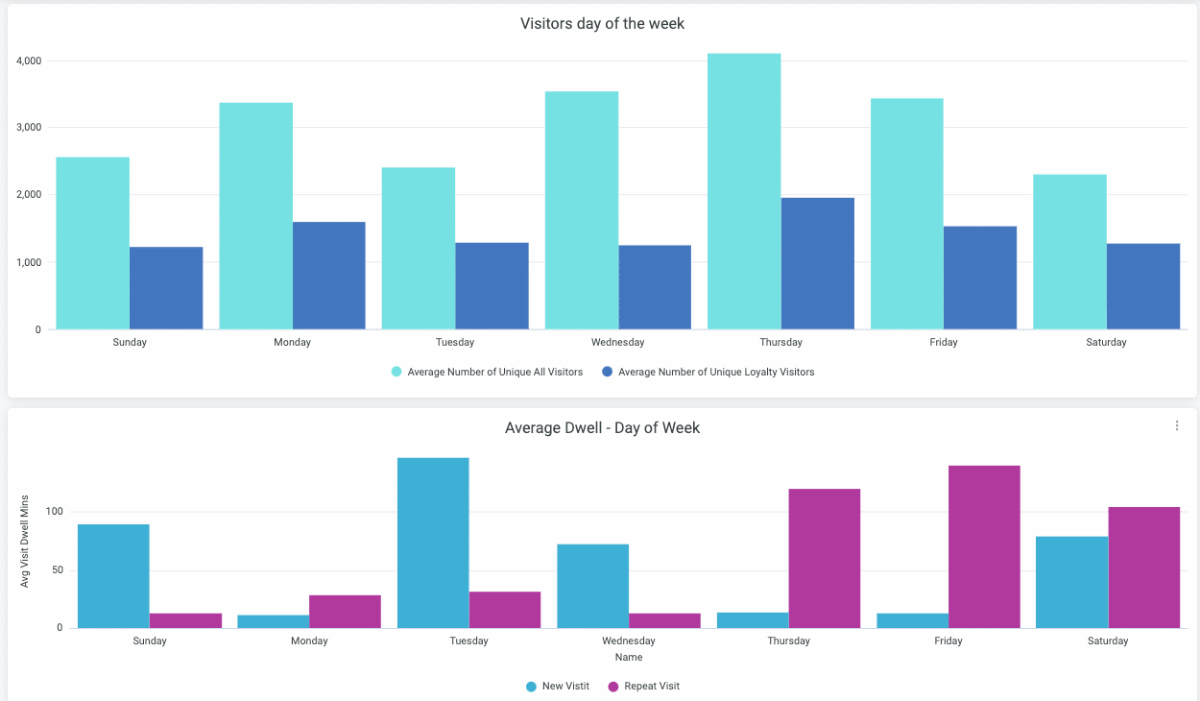
Figure 3: Top‑level view of the Sample Engagement Analytics dashboard that summarizes loyalty, one‑time, and passerby visitor footfall metrics, and provides monthly and weekly trends of visitor footfalls, as well as dwell‑time metrics and trends, zone ranking, and zone movement analytics.
| Features based on subscription | Basic | Premium Analytics |
| Visitor segmentation and reporting based on user-defined dwell times | Y | Y |
| Dwell time that includes trends and averages for predefined labels for visitor segmentation | Y | Y |
| Unique visitor trends based on predefined labels for visitor segmentation | Y | Y |
| Dwell and visits per site, floor, and department | Y | Y |
| Visitor segmentation between new and repeat based on a fixed, seven-day rolling window | Y | Y |
| Heat maps, including real time and historical replay of visits and dwell times | Y | Y |
| Visitor segmentation between new and repeat based on flexible and configurable time duration | N | Y |
| Data segmentation and reporting based on dynamic aggregation of dwell times for visitor segmentation | N | Y |
| Dwell time that includes trends and average for dynamically defined labels for visitor segmentation | N | Y |
| Unique visitor trends based on dynamically defined labels for visitor segmentation | N | Y |
| Ability to reprocess historical datasets based on changes in criteria | N | Y |
| Popular motion paths, including traffic flows between zones | N | Y |
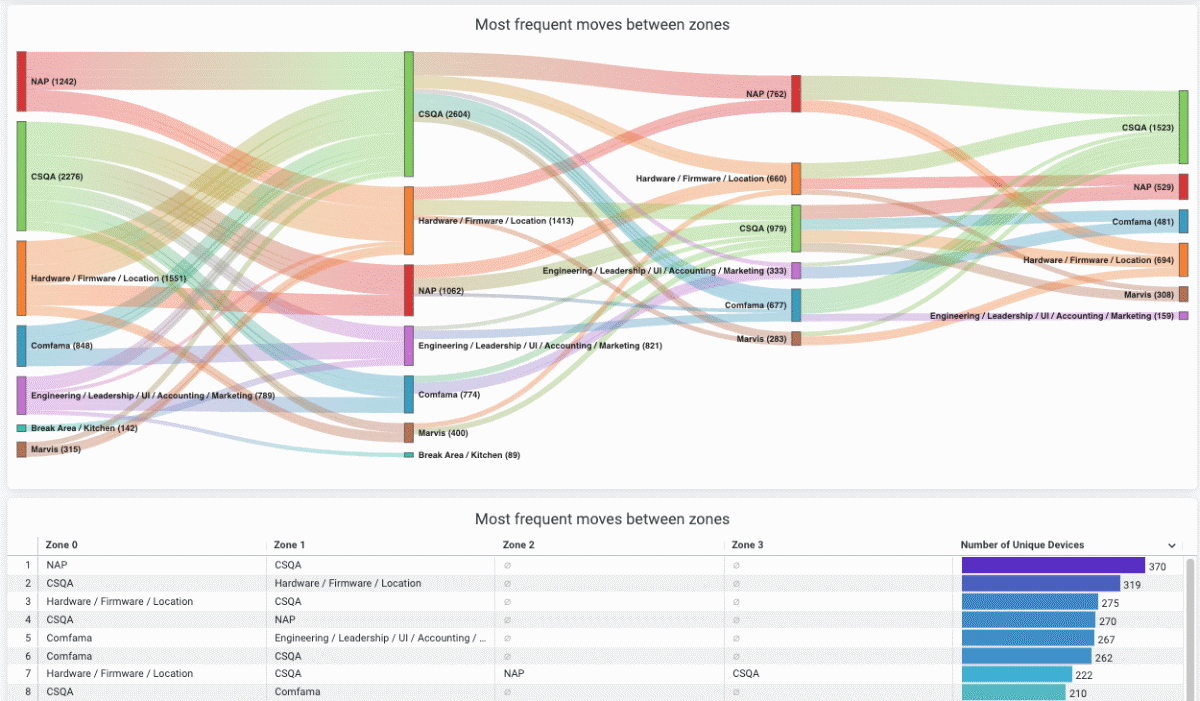
Figure 4: Sample Occupancy Analytics view of movement
| Features based on subscription | Basic | Premium Analytics |
| Heat map of floor and zone occupancies based on preconfigured maximum capacity restrictions | Y | Y |
| Ability to customize timeframe and location sources | Y | Y |
| Occupancy trends over time | N | Y |
| Zone ranking based on capacity and dwell time | N | Y |
| User ranking based on dwell times | N | Y |
| Features based on subscription | Basic | Premium Analytics |
| Ability to rewind and replay the location history of individuals | N | Y |
| Ability to identify users who were in close proximity to a selected individual | N | Y |
| Ability to identify encounter duration | N | Y |
| Ability to customize encounter duration and historic timeframes | N | Y |
| Heat map of zone occupancies based on preconfigured maximum capacity restrictions | N | Y |
Ordering Information
You can purchase Juniper Premium Analytics directly through Juniper Networks or through one of our partners and resellers.
Please contact your Juniper account team or partner for licensing.
Have additional questions or looking for more information on how to buy Premium Analytics? Set up a call with a sales expert at: https://www.juniper.net/gb/en/how-to-buy/form.html.
About Juniper Networks
Juniper Networks believes that connectivity is not the same as experiencing a great connection. Mist, Juniper’s AI-native networking platform is built from the ground up to leverage AI to deliver exceptional, highly secure, and sustainable user experiences from the edge to the data center and cloud. You can find additional information at www.juniper.net or connect with Juniper on X (formerly Twitter), LinkedIn and Facebook.
Appendix A: Networking dashboard showcase
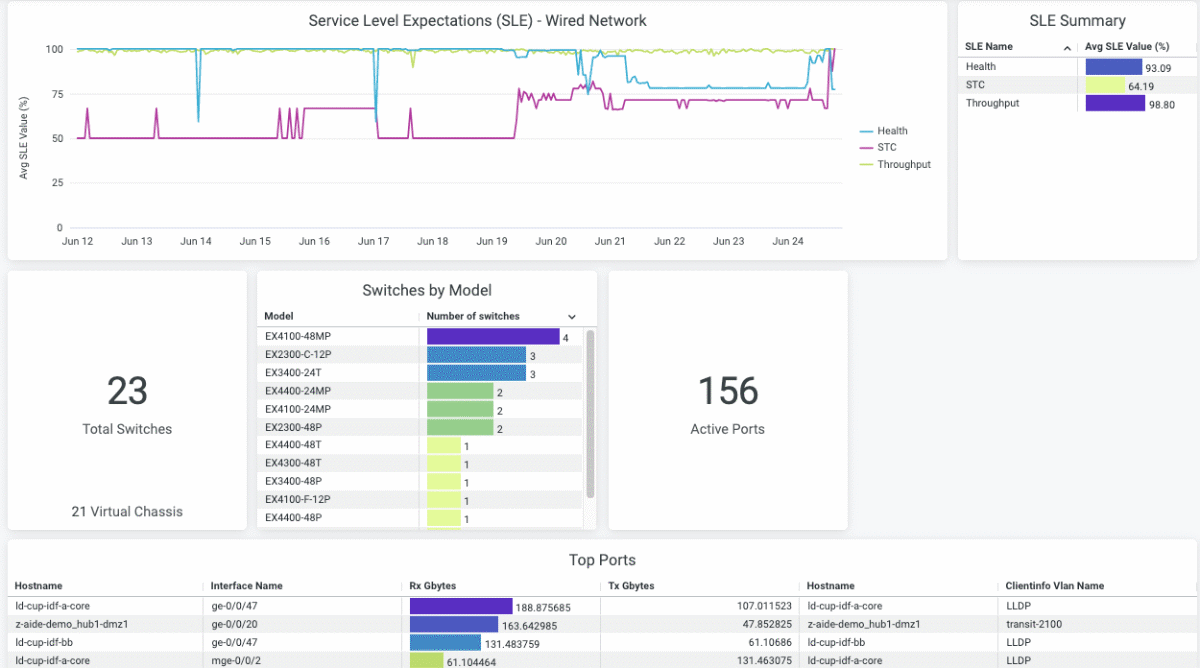
Figure A‑1: Top‑level view of Wired Network Insights dashboard that summarizes traffic metrics of wired networks by site, switch, port, and VLAN traffic trends by switch, port, and VLAN; port utilization trends; and switch SLE metrics
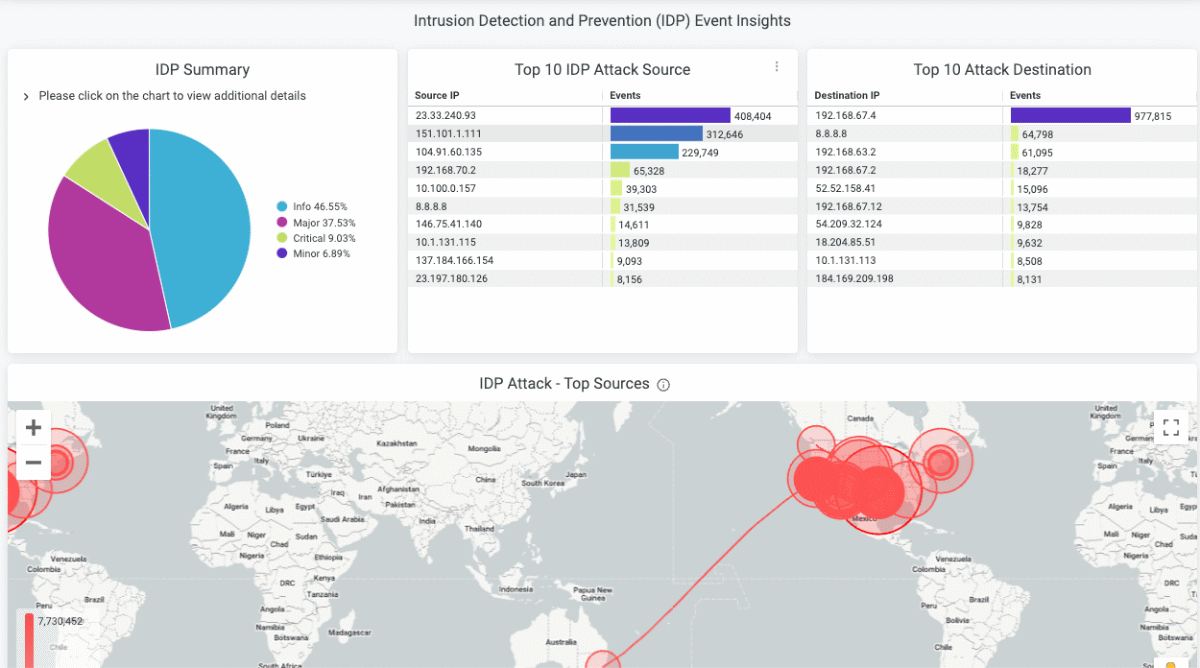
Figure A‑2: Top‑level view of the sample Security Assurance dashboard that provides insights on IDP and URL events, IDP and URL event trends, top IDP threats with source and destination IPs, and top URL blocked events with source and destination IPs.
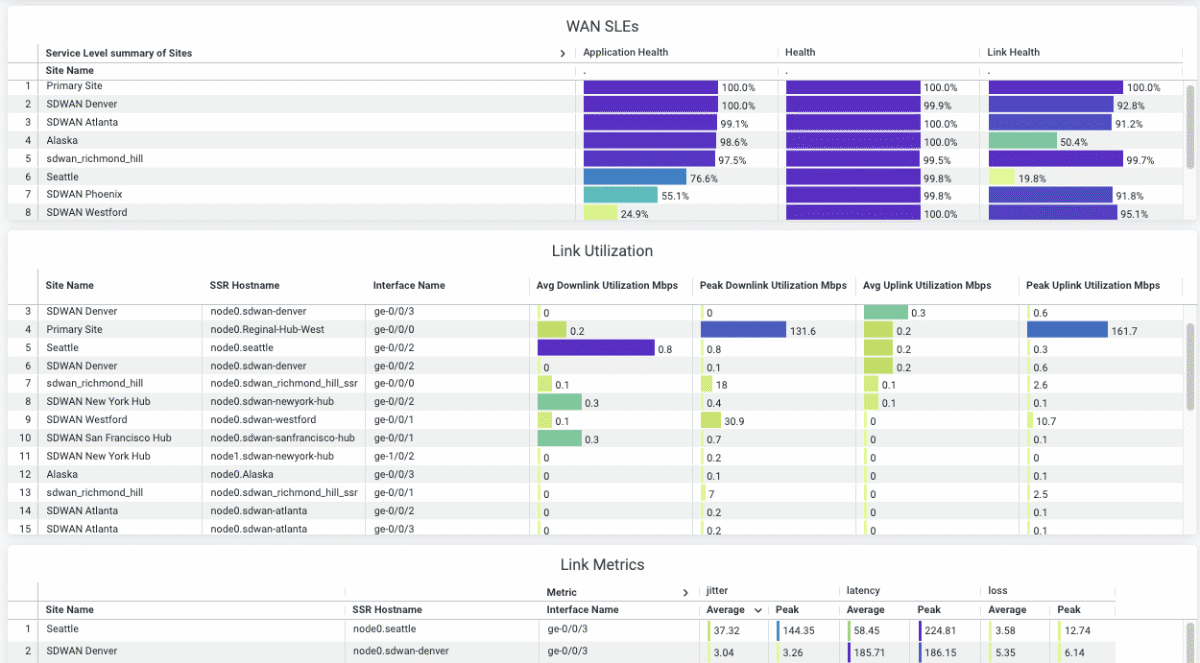
Figure A‑3: Top‑level of the WAN Network Insights‑SSR dashboard that provides WAN SLE metrics for the SSR Network, link metrics for organization‑wide WAN links, application distribution by users, and traffic metrics by sites, WAN edges, interfaces, applications, and more.
1000744 - 007 - EN MAY 2025


