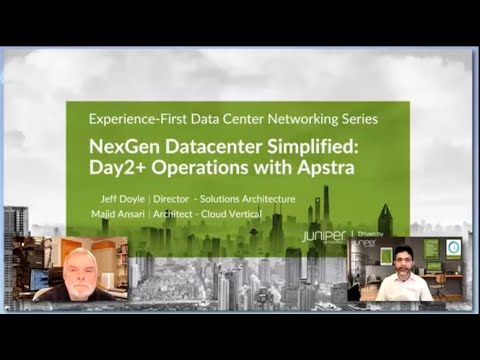
Data Center Management and Control, Day2+ Operations with Apstra

Data center operators, here’s how Apstra has your back.
In this second episode of the Experience-First Data Center Networking Series, with Jeff Doyle and Juniper’s Majid Ansari, you’ll learn how Apstra can simplify your next-generation data center day 2+ operations.
You’ll learn
Essential characteristics of a fabric management solution when it comes to simplifying operations
An intent-based approach for Ethernet VPN (EVPN) data center operations supported by Apstra
Apstra features that assist with the important protocols for Day2+ Operations
Who is this for?
Host
Guest speakers

Transcript
0:00 [Music] good morning and thanks for joining us
0:07 today uh this is uh our second lightning talk uh in our experience first data center
0:13 series uh today we'll talk about uh simplified day two plus operations with abstra
0:19 uh for our next gen data center my name is majid ansari i'm an architect on cloud vertical and
0:26 we have jeff doyle with us we all know jeff and thank him for educating many of us through his books videos trainings
0:33 and blogs uh jeff hi good morning uh
0:38 and or good afternoon depending on where you are and thank you for joining or for watching our video
0:46 thanks jeff and and folks we have one more upcoming session uh that would be focused on apis
0:52 and automation uh this is uh this this session is focused on operations with abstract
1:00 so to get started i'll quickly recap on what we covered in our previous
1:06 session um for for data center architecture um then we will uh we'll talk about what
1:12 would be some of the essential characteristics of a fabric management solution uh when it comes to simplified
1:19 operations um and then uh i'll hand it over to jeff to talk about
1:24 uh intent based approach for evpn data center operations uh that's managed and
1:29 supported by appstra so let's just jump right
1:35 right in um so a quick recap and based on the last session we actually concluded uh that evp and vxlan
1:43 offers a very efficient and scalable solution when data centers have to deal
1:48 with you know supporting legacy as well as next-gen architectures and you could do an l2 l2 stretch as
1:55 well as you can offer you know pure ipl3 connectivity um using evpn um the second
2:01 thing we talked about as you know to to manage your data center you need a sophisticated solution
2:07 so that because you know complex requirements means complex
2:13 parameters and and then a lot of things that you need to deal with uh you need a sophisticated solution when it comes to
2:19 fabric management and we think you know showed a demo um and talked about
2:26 how abstract can meet and exceed the requirements for uh day zero and day one um and basically
2:32 what you need is a unified solution uh for seamless automation from you know day zero to not only day one but day two
2:39 plus operations and that's gonna be our focus uh on on our discussion today um
2:45 and appstar definitely you know meets and exceeds uh uh all those requirements will be short
2:50 for uh architecture uh let's look at you know some of the things that we need to look into when it comes to
2:57 uh operation operationalizing a modern data center um and then real quick again this slide
3:03 is also a recap on you know some of the details we covered uh when it comes to
3:08 day zero and day one uh and then when i say day zero d1 uh maybe just a quick
3:13 thing like you know day zero would be you know your ztp bringing up the devices
3:19 planning ahead of time on you know how your connectivity is going to look like and we covered in details in our first
3:25 session on you know what are some of the key characteristics of your fabric management solutions uh today we'll
3:31 focus as we talked uh on the next two sets uh of uh of uh characteristics
3:37 which will be focused on day two operations um so i will i will quickly you know with that jump into that first
3:44 aspect right when we are operating a network um uh first thing um i would like to say is
3:50 it's very important for you to know uh what how your network is operating
3:55 compared to what you have it designed for right so you want to match your intent
4:01 uh with uh what's the current operational state in your network um and in order to do that
4:08 right you need to collect a lot of information and there are there are ways that network equipment to support today
4:14 uh going from you know legacy snmp or syslogs uh to recent developments with
4:20 the telemetry that can give you all that data in in matter of you know seconds
4:25 right however you just don't need that raw data uh what you would need to do is you
4:31 need to analyze that data uh you need to identify what is more important that needs to be
4:36 reported and then uh you also need to identify what's the relationship between the event right like if a bgp session
4:43 goes down and an interface goes down uh how do you relate that hey these two things are related and
4:48 you don't want to see like uh you know thousands of alarms popping up in a screen um and and then
4:55 you have to you know manually figure out that will take forever uh so so basically the solution needs to be able
5:01 to extract knowledge from uh all the data that you're getting from the network and the data that's coming in
5:10 now one key aspect if you want to quickly analyze and see what's relevant um
5:15 you will heavily depend on how your data that you're collecting is stored um it needs to be stored in a way that it's
5:22 easier to query uh based on the context right and then um when you when you do that then
5:30 you will see um and you will get what you're uh what you're looking for right away uh rather than spending too much
5:36 time trying to figure out what happened now when you when you like want to have and when i say that you need to store in
5:42 a format that's easier to query what do i mean is um as per the requirement you need to know
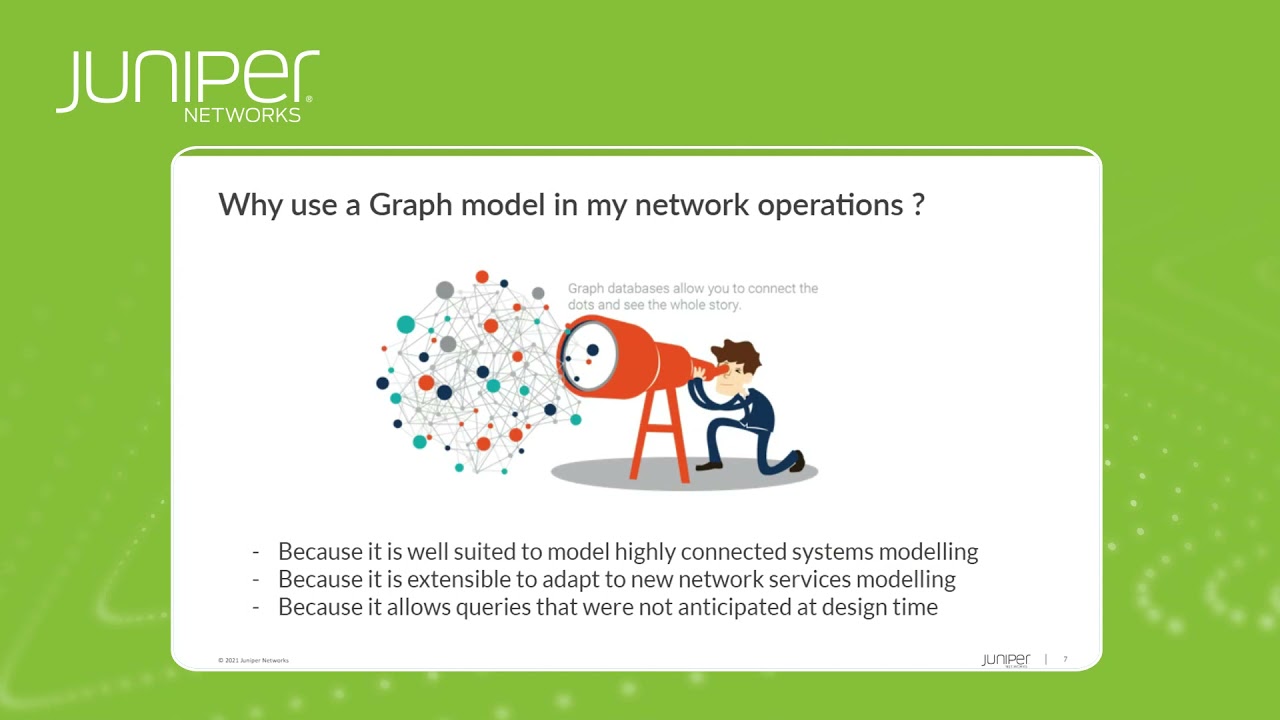
5:49 the relationship between different events and the way you want to do it in one
5:54 approach and i think we found that approach to be very efficient is network is like a graph you have
6:01 nodes and you have links and then similarly you have relationship between those those nodes and links
6:07 right um so what you do is you would uh you would like to you like to have a
6:13 format that closely aligns with that and when you want to query you get the same natural
6:18 relationship that you would expect on your nodes your links your protocols um
6:23 and on all those things so a graph database actually offers that natural uh way of doing it
6:30 and then a graph database could store those complex relationship because when you talk about a network um
6:37 and what you see in the physical level uh i would say just the tip of the iceberg because now
6:42 a network has lots of nodes and and if i go into like maybe a little bit technical jargon uh you know you have
6:49 protocol session each protocol session would have some routes that would be coming in and then those routes will
6:54 have next hub that you'd be pointing to or the the the tunnels that you need to
6:59 follow right so all those things are our complex relationship that you would need to understand uh
7:05 and and in short uh what we have found is a graph database uh would offer uh
7:12 that kind of storage uh as well as easy retrieval method right very flexible because now
7:18 you don't have to know ahead of time how these uh elements are are related because a graph database is very
7:24 flexible in that sense uh so um you know that would give you what you're looking for um and then you can
7:32 you can actually see and compare uh with what you have uh versus what you're gonna uh what you're gonna get in
7:38 the network in real time um the second aspect is now when i when i say you need to compare it with what
7:45 you have you got to establish a source of truth right and if you have thousands of those
7:51 devices in the network and this state is distributed across those thousands of devices
7:57 it's not easy to compare across those right so that means your network is not a single source of truth uh you would um
8:05 you would need like a central mechanism where you're gonna store this information and when i say source of
8:10 truth it could be you know ranging from the way you have defined your connectivity the way you have defined
8:16 your configuration so like configuration that goes on each device um operational state bgp sessions you're gonna have
8:22 these bgp sessions they're gonna be up down what do you expect them to be each of them going to carry routing
8:28 information how many routes should i have in that steady state how many ecmp groups i do have in a steady state so
8:34 all that information will be stored in a single place in for example a graph database and now
8:40 you can easily compare with what changes so this gives you that perspective and now with the relationship that you have
8:46 that you have stored you can now get things in context and i think it's very important to have things
8:53 seen in context because uh if you don't have that then that data may be meaningless or may not mean
9:00 anything even if let's say it's a big red alarm but if you don't know what happened it may not help you that much so again
9:06 you have to present yourself that the tool is to present you that information in context and for example a bgp session
9:13 went down because a corresponding interface went down and having that information in that
9:18 format helps you quickly take action and remediate it um so that for example your
9:24 outage is is is limited or if there's any security issue that you're running into the network you can contain it
9:30 because now you know what the what to contain and and then where to contain it so i would probably you know stop at
9:37 that on details about uh you know analytics and the knowledge you need to extract and how it helps you
9:44 uh compare your intent with what's there in the operational state the next thing that that an operations team has to deal
9:51 with and i think it's probably the most important aspect of operations is uh you want to be able to deal with
9:57 any change in the network reliably and when i say a change it could be a planned change or it could be an
10:03 unplanned change a plan change could be a maintenance window where you're bringing down a device for an upgrade or unplanned
10:10 change would be that a router rebooted um all those things needs to be handled in
10:15 a way that it's predictable and and then you can go back to a working state um in a
10:22 graceful manner where uh with the minimum loss right um and and and again going back to the way we are storing our
10:28 information you can do that because now if you bring in bring a device for maintenance you
10:34 exactly know that what is going to happen when you take out this device and then you can
10:39 accordingly alarm the system so for example if device is down and then your bgp sessions to that device are down
10:47 uh what it means is that you don't have to raise an alarm on your system that your 75 bgp sessions are down
10:54 what you because you know that this system is going to be down it is a maintenance you will present it in a way that
11:01 um that's uh you know that's useful for for the operators and not worry about things that they don't need to worry
11:06 about um in the same way you uh you want to you want to do your maintenance again if
11:12 the router reboots now you you will get all the relevant stuff uh that you need
11:17 to see so this is definitely like one of those things where you know you want to build a system or uh have a system for
11:23 your fabric management uh that enables you to do these things smoothly and
11:28 examples are right i talked about you know you want to uh you want to do smooth maintenance
11:34 windows when you're going through the maintenance windows you want to make sure um you know your maintenance windows are are are meant and then and
11:41 then done easily or you want to um for example you made a change 2 a.m at
11:47 night and then you come back in the morning and realize that something went wrong and you want to be able to quickly go
11:54 back and and roll back your state across the network so that uh it is operating
11:59 the way you uh it is it was operating before you made the change and and this again is like a key thing where now
12:06 you're treating your entire network or network state as an entity rather than dealing with discrete
12:11 elements right and then you can deal with the network a lot more efficiently if you have that
12:17 full picture and you can see that everything is operated as a system the way it needs to be
12:23 versus you know individual elements that may be operating fine but then together um it's not so that's another aspect
12:30 that you have to keep in mind is um you know looking at the network as a system
12:35 uh being able to you know make changes across the network or uh roll back changes across the network
12:41 and and and all these things i think i'm just you know touching some key things but uh these will help you narrow down
12:48 narrow down your root cause of the problem or what we you know call uh mean time to repair or or also we
12:55 also call it as mean time to innocence uh so this like you know this kind of approach
13:01 would help you um uh manage your network a lot more smoothly um and i think i as i said uh
13:08 we we will go through some of these um in the later section as well uh so i'm just gonna stop at that and uh hopefully
13:16 i highlighted some of the you know things that are important for uh for operating a next-gen network uh if you
13:23 have any feedback or you you know you see some of these things are relevant to you or not relevant to you and then
13:28 there's something else uh please leave us feedback and we definitely you know uh would like to go back and address
13:34 those as well uh but with that uh i would like to uh pass it on to jeff so
13:39 that you know he can show us uh uh in in real time and from an abstract perspective uh how some of these things
13:47 are addressed uh with abstract uh jeff uh uh uh
13:52 well i'll stop sharing my screen and then maybe you can take over great thanks majid i i appreciate it and
14:00 uh i want to re-emphasize uh something that is is hugely important
14:06 that maajid said which is that the key to intent-based
14:13 networking is seeing your entire uh network as a
14:18 single as much as said a single system a single homogeneous entity
14:26 and certainly you can say well i you know i
14:31 can view my network uh that way but what you really can't do what any human
14:36 operator can't do is view the real intricacies uh that are
14:43 necessary to see your network as a single entity um and but if you can
14:49 operate your network that way if if you can view your network that way that is
14:54 what allows intent-based networking which is simply an expression of your expectations
15:01 of the network and once you have intent-based networking um you're able to uh more easily validate your intents
15:10 your expectations for the network you're more easily able to uh say very simply what your new
15:18 expectations are of the network you're more easily able to monitor when your network
15:24 drifts off of your expectations and it opens as i'm going to show you uh
15:31 it opens the door to intent based analytics and and majin talked quite a
15:37 bit about that of of being able to uh to look at this flood of data either
15:42 when your network is in a steady state and you simply have uh you want to query your network for
15:47 certain kinds of information maybe for planning um or uh you know uh implementing new
15:55 applications things like that or especially when you're doing troubleshooting and
16:01 module also mentioned you know there's really four aspects of day two operations there's just the day-to-day
16:08 routine network changes that you're gonna make in your network there are uh
16:14 the routine monitoring that you're gonna do in your network there is this the
16:20 specialized gathering of telemetry and that goes to what i said a moment ago of when you
16:26 have a question in your network and you simply want to know you know what are the characteristics of certain traffic flows
16:32 or certain interfaces in my network that are behaving a certain way what are my
16:38 bandwidth utilizations and all that those sorts of things then you need to gather that information for planning and
16:44 then obviously for troubleshooting you want you want to be able to
16:50 very quickly reach a mean time to resolution or mean time to recovery mttr
16:57 you want that to be as short a period of time as possible and that's a big part of
17:03 what i'm going to show you but you can see uh here i've got a fairly simple
17:08 network up and this is just sort of my standard demonstration network with two spines
17:14 and three leaves uh in two racks two leaves are top iraq uh leaves in one
17:20 rack and the other leaf is just a single top of rack in another uh in another rack and then
17:27 there are a few servers scattered below this this is an extremely
17:32 simple network and yet with abstra what i'm going to show you is is
17:38 the key to how all of this is tracked as a single entity as opposed to tracking as
17:47 individual nodes and we can do that by looking at our graph explorer
17:52 and that will come up in just a moment here it's coming up and
17:59 and there you can see this is the actual graph that abstra has
18:05 built from that very simple two spine three leaf network and you can
18:10 see that even at this level this is enormously complex
18:16 and what it's tracking is and this is the part that people don't see in the beginning that when we
18:23 talk about you need to be able to understand your network holistically we're not talking about just that yeah i
18:30 understand all of the physical connections between all my spines and all my leaves and where my servers are
18:35 connected and all of that it's far more than that there are uh relationships
18:42 here's here's an interface connection and you can see all of the interface connections in this graph uh here is um
18:50 an endpoint policy you need to be able to understand how your policies are
18:55 interrelated you need to be able to understand how your individual device profiled so what their
19:02 capabilities are and how they interact you need to be able to understand how your protocols
19:09 are interacting with each other so there is it's the interactions are much much
19:14 deeper than just you know node a is connected to node b
19:20 um and that is this is the key to what apsara does to
19:27 treat the network as a single entity and again where that's particularly
19:33 important uh and i'll just point out really quickly you'll notice in this network there's uh some red stuff
19:40 up here and i'm going to go to that uh in just a moment but this is particularly important when
19:46 you're troubleshooting because you want something that looks at relationships
19:52 not just individual nodes if you are trying to troubleshoot this
19:59 via cli and you're visiting node by node by node you're not really seeing those
20:04 relationships or at least it takes you a long time to gather that information to
20:09 be able to see those relationships abstra is displaying this information to you uh
20:16 in terms of relationships right away and if i go to the dashboard as you can see here and obviously things are
20:23 uh lit up and you know maybe it's it's the christmas season coming up everything here is nice and red and
20:29 green but we don't really want red in this case uh that's obviously not a good thing but um
20:36 if i quickly look say here it says there are three bgp anomalies
20:41 if i look at those uh here you can see that it's displaying these anomalies in
20:48 terms of what's expected and what's actually there and that in that right there in a
20:55 nutshell is the idea of intent based analytics
21:00 the expectations are your intent and if there's something that is
21:06 drifting away from that intent that's shown as the actual uh in this case we have
21:12 uh three bgp routes that are completely missing if i go back to my dashboard and i look
21:19 at the route table again you can see that that what the anomalies are showing
21:24 is that we expect all of these routes and there's quite a few of them uh to be
21:31 up and instead they're either missing or in some cases uh partial
21:37 and and so again we're looking at and troubleshooting our network network from the viewpoint
21:45 of intent and i could explore more of these uh
21:51 these pieces here but i want to dig a little bit further into this and one of the things
21:58 i should mention down here below for node status you can see that that i have my five nodes in this network
22:05 and that leaf two is showing quite a few more anomalies than any of the other devices are
22:12 showing and so already there's a pretty good suspicion that whatever is going on in this network
22:18 it's probably going on at least two and if i go to my active topology
22:25 everything is lit up red here but if i go down to leaf 2
22:32 i can focus on leaf 2 and see what's really going on for that specific
22:39 node just based on that suspicion that my dashboard gave me you can see there's some route anomalies there's some bgp
22:46 anomalies but the thing that really is going to pull my attention and let me go
22:51 back to the dashboard for a moment it pulls my attention here too is there is one config deviation
22:59 in our last webinar i talked a bit about rendered configs and
23:05 incremental incremental configs in appstra and the implication behind that is appsera
23:12 expects to have full control over your network and know everything that's going on in your network uh in this particular
23:18 case this config deviation is really saying um
23:23 a configuration changed in my network and i didn't do it i don't know at i
23:29 meaning abstract i didn't make that change and don't understand what it's there for
23:36 so there's a really good suspicion that that config deviation is what's
23:41 causing all of these other problems in the network so if i just click on config
23:47 deviation sure enough you can see again i had my earlier suspicions about leaf two you can see that that config
23:56 deviation happened at least two and uh i can click on this there are several different ways that i can approach this
24:03 uh just to go back to what i was um starting to do before let's go back to
24:09 the active topology look at leaf two a little bit closer uh as i said there's a
24:15 bunch of different places i could approach this anomaly but here you can see again i have a config
24:21 anomaly so i'm going to click on that and what i get is this
24:28 appstr is saying my intended running configuration in other words the rendered configuration
24:35 is shown on the left and there is a difference on the right
24:40 is my actual running configuration and appstore is is raising that anomaly
24:46 because it says you know there's something in here that i didn't do and uh and in the
24:52 background uh well i can show you what uh what we have if i uh
24:58 simply apply full config and confirm it uh what's going to happen now is you can
25:06 see that our expected running config is going to be pushed to uh to the uh uh
25:15 switch and in this case because it's juniper it will uh it will be committed and that
25:22 config deviation should clear up uh fairly quickly um and there it goes you
25:29 can see that now it's it's clear it will take a little bit more time for bgp to
25:34 clear up just from the nature of bgp everything has to be monitored um and
25:41 you know bgp takes a bit to converge but you'll see all of that turn green very quickly you can see that
25:48 my config deviation has already gone away uh you can see that already my anomalies have been reduced um and so uh
25:57 that's very quickly going to change um but while we're doing that i should mention
26:05 um a uh a couple of other things that you can do in the network
26:11 i can go to analytics and go to probes and maybe i want to
26:16 probe my network for something for some uh reason either because i want to
26:22 collect information for planning i want to monitor certain characteristics of my
26:28 network or i just simply want to be able to more clearly troubleshoot
26:34 my network and you can see that i've already got several probes running i'm looking at
26:40 esi imbalances i'm looking at uh route validations for vxlan type three
26:46 and type five i'm looking my flood lists and so forth and right now there's no anomalies in any of that
26:53 uh something i may want to uh look at um and i can go to active
27:00 while everything is still kind of clearing up here and if i look at my notes
27:06 down here on my servers i've tagged servers for different kinds of services that are supported maybe i have one
27:13 particular service in this particular case on server one of or sorry switch two of of
27:20 uh um of the first rack and switch three and the second rack i've got uh this
27:27 service running on these two servers called manhattan project and i want to keep cl a close eye
27:35 on that service i could go to analytics and uh create a probe
27:43 and um select you can actually uh there's a bunch of predefined probes you can also
27:50 uh build your own probes and in a in a longer webinar we can certainly talk about that but in this particular case
27:57 i'm going to select for critical services and i'm going to select the tag
28:04 where i tagged manhattan project which is basically saying i want to watch
28:11 traffic specifically related to these servers that are
28:16 supporting manhattan project and i want to be told in this particular case my default utilization is 80 i want
28:25 to say that uh any utilization over 50 percent of
28:30 the bandwidth for those two servers
28:36 is going to raise an anomaly for me so i'm going to create
28:41 that probe and here you can see the probe and in this particular case manhattan project was on leaf two and
28:49 leaf three there's nothing really going on in my network so you know there's zero uh zero utilization there but you
28:57 can see that those servers supporting that service are on uh xc003
29:05 on switch 2 and xe002 on switch three
29:12 but now i have a probe that's just watching that critical service and will raise an
29:19 anomaly if my traffic goes above 50 percent because
29:24 that's a critical services to service to me there's other services sharing that bandwidth and sharing those servers and
29:31 i want to know if anything else is adversely affecting that traffic so
29:36 that's the kind of day-to-operation that you can get using probes in abstract intent based
29:44 analytics probes and by the way you'll notice that finally bgp all stabilized
29:49 and and everything is green and happy now i do want to show um
29:56 just one more piece of operations and that's the day-to-day operations um
30:04 and actually given our time limit i think i'm not going to show this piece
30:10 in much depth but you know a day-to-day operations would
30:15 be if you're creating new virtual networks you're creating new routing
30:20 zones um and you know for for a routing zone i can click on routing zone and you know i'm going to actually just
30:27 take the time where we are recording this so i think it's it's worthwhile um if you're operating your network by
30:35 hand and you want to create a new routing zone you want to create a new virtual network you have to visit
30:41 the devices that you're creating these on node by node
30:46 under intent based networking you do all of this by treating the entire network again as
30:52 a homogeneous uh entity so i click on create routing zone and i'm going to
30:59 create a routing zone uh i don't think green exists yet i could i could specify the vlan vlan id
31:05 vni's uh i select a routing policy which is going to just going to be my default i
31:12 could uh specify import and export route targets but i'm not going to do any of
31:17 that i literally am doing nothing but saying i want a routing zone
31:22 called green and uh what did i do here oh i put a space in there accidentally which was
31:28 actually a good thing you can see that uh abstra if you make a mistake in your configuration app store will tell you
31:35 uh so i create that uh i give it a moment and you'll see that my route
31:41 targets and my vni's will come up here they are uh abstra did that for me
31:47 and i do need to allocate um an ip address to be used by this
31:53 uh so i'm gonna say uh let's say that we're gonna take
31:58 um an ip address out of the 192 168 pool and by the way these pools are
32:04 configurable and and literally it'll take a second this
32:09 little spinny wheel is the verification happening in the background
32:14 and just that quickly you can see that now i have a green
32:19 vrf that's created if i want to create a virtual network and i'll do this very quickly i usually
32:26 create several just to demonstrate but i'm just gonna do uh maybe one let's just call it ethyl
32:33 um and i'm gonna put it in that new green
32:38 routing zone uh i could specify all kinds of other things here uh i'm going
32:44 to let abstra take care of making all the selections there i do want to enable uh
32:49 dhcp service i wanted to be tagged and i wanted to appear on both of my racks
32:57 and i hit create and
33:02 it's going to take a second to verify all of that and now you can see i've got
33:07 ethel i need to specify uh a
33:13 a svi address i do that and uh and you'll see
33:20 my ipv4 subnet come up there it is after absolutely took care of and tracks the
33:25 subnets in there um and that's there is one more step and
33:31 because i am pressing up uh or actually gone quite a bit past our time limit i'm
33:36 not going to do that part but but what i could do
33:42 by selecting ethel is go to my connectivity templates and if i am
33:50 if i am assigning a lot uh or creating a lot of new vns at the same time i can do
33:56 this as a bulk operation go through and actually um
34:03 assign what interface i want uh interface or interfaces i want
34:10 ethyl to appear on i just said i wasn't going to do this and i'm doing it anyway let's see let's go to leaf one and
34:18 and i say i want ethel to appear on all of those and you can see
34:24 that in this particular case uh abstra has has returned an error
34:30 saying that i can't use the specific endpoints that i've used
34:36 as as shown here and you know and so right away
34:42 after tells you when you're making a mistake through all of the validators in the network and i'm not going to
34:48 troubleshoot through that uh i am as i promised uh 10 minutes ago going to
34:54 at this point uh stop the demo and uh and mod should i i'll send it back over to you thanks for
35:01 covering those details because i think uh it's important to have that context when when we were talking about you know
35:07 things and concepts uh so definitely that detail should help and what you highlighted was uh you know
35:14 how easily uh abstract facilitates you know some of these day two operations and as
35:19 as we were talking um this is just tip of the iceberg right and there are a lot more things that go into smooth they do
35:26 operations um so uh folks who are listening to this definitely feel free to contact us
35:32 um and and then we can actually go over in a lot more details with you um in a
35:38 longer session and i think one of the things that i wanted to highlight how important
35:43 day to operation is your day 0 and day 1 or your architecture planning design
35:48 implementation what it does it it builds a strong foundation for you and how abstract helps you do that we
35:56 can establish that in a first webinar uh but now once you build that foundation and then you build that house and i'm
36:03 calling your network your house you live with that on a daily basis
36:08 right so you have that every day that you're living in that house so this day two operations is like that and
36:14 sometimes i feel that um you know the the day to operation automation or facilities don't get
36:21 as much important as it should get because it is affecting uh every day um
36:27 and appstra has done um a lot of you know work and justice in
36:33 in making sure that your day two operations are simplified as well uh and that's uh some of those things that we
36:39 you know uh went through highlighting through um uh throughout the webinar um
36:44 and some of the features there so i'll quickly recap on maybe some of the takeaways right
36:50 for uh for a smooth day two operations uh first thing i think we talked about you
36:55 need a real-time network knowledge in context right that way you know you can narrow down to what you're looking at um
37:02 in um in in short time and you know you can do more with uh with less um second thing is you want facilities
37:10 that will help you uh you know deal with changes in the network reliably and efficiently um and
37:16 and we talked about you know how uh how you can do that with the right kind of information at your fingertips um as
37:24 well as you know the software doing correlation for you um in a manner that's useful uh as well as as jeff
37:30 highlighted you know when you deal with the network as a system and then you can validate everything at every step right
37:38 um you are adding that reliability factor as well um and and i think last but not least it's i
37:44 think i'm gonna be putting on um as a conclusion for every uh one of our webinars uh you need a unified solution
37:51 uh that offers you know a seamless automation from days day zero day one day two and all
37:58 the way through it gives you a single pane of glass and then you can do your uh operations
38:04 um as good as you can do your architecture and design and deployment and it's there with you every day to to
38:11 you know solve and support your uh your network um and with that i think we
38:16 obviously can conclude that abstract does uh does come come up
38:22 great on all these requirements that we talked about uh we'll definitely be happy to talk to you more
38:28 and in the meantime you can also you know do uh online um training and you
38:33 can watch our youtube list and you can also request uh for a virtual lab that would demonstrate some
38:39 of those features with you um so this is great um hopefully you know you find it useful
38:45 please provide us your feedback and just before we uh we conclude this
38:51 seminar i would like to remind you that there will be a uh there will be a third session that will be focusing on apis and automation
38:58 with abstract because you are not going to deploy your network management or network fabric fabric management system
39:04 in isolation uh you are you have your existing automation that you want uh
39:09 this fabric management system to integrate very well with and abstra has paid a lot of attention
39:15 by you know providing very simple to use apis so that it can incorporate in your flows um so thank you very much for
39:22 listening in um and uh thank you jeff for sharing sharing additional perspective
39:27 looking forward to talk to you guys more [Music]