Juniper Apstra Demo: Root Cause Identification
You’ve got network problems? Apstra has the answers.
Easily identify network issues? Check. Accelerate time to resolution? Check. Apstra does all this and more with Root Cause Identification (RCI) technology. RCI is integrated into Apstra software and automatically gets to the bottom of complex network issues to make your job easier. Here’s a quick demo to get you up and running with RCI today.
You’ll learn
How RCI leverages the Apstra datastore to provide real-time network status
A real-life use case that shows you what “intent-based networking” means when it comes to Apstra
How Apstra provides you with efficient ways to quickly pinpoint and resolve issues
Who is this for?
Transcript
0:01 [Music]
0:07 this demo will show how appstr uses
0:09 intent-based analytics and root cause
0:11 identification to reduce mean time to
0:14 resolution
0:15 juniper appstra leverages intent-based
0:17 analytics to manage data center fabrics
0:23 it manages a network fabric as a single
0:25 entity rather than a collection of
0:27 individual devices
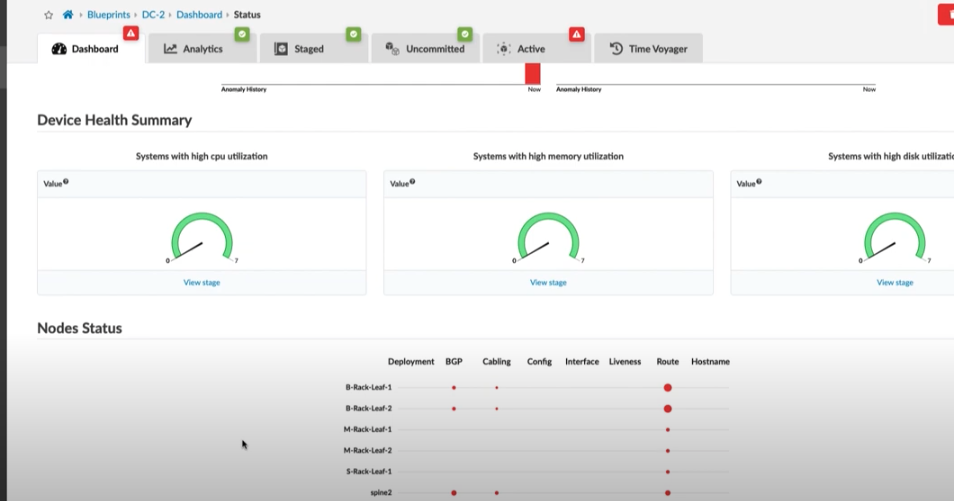
0:33 in this view i'm showing the dashboard
0:35 of an operating data center fabric in a
0:37 remote location
0:40 earlier one of the devices in my network
0:42 was experiencing problems and a
0:44 technician replaced that device
0:48 this display reflects the status of the
0:50 network after he has the new device
0:53 you can see that i have bgp anomalies
0:56 some cabling anomalies
0:59 i've got route table anomalies
1:03 all the individual devices appear to be
1:05 operating in a healthy state
1:08 but in this node status view i've got
1:10 different size red dots that indicate
1:13 the number of anomalies associated with
1:15 each category for each device
1:19 for example border rack leaf 1 has 2 bgp
1:22 anomalies 1 cabling anomaly and nine
1:25 route table anomalies
1:27 let's go to the active network tab and
1:29 see the topology
1:33 from this view we can see all the
1:35 devices in the fabric and a color-coded
1:37 status for each one
1:41 on the right side i have the telemetry
1:43 coming from all devices in the fabric
1:45 this reflects the same information we
1:47 saw in the dashboard view
1:51 if i want to drill into this specific
1:53 leaf device and see more details
1:56 i can see there are two route anomalies
2:00 meaning that i have two routes missing
2:02 from the table
2:03 apstra knows from the intent model what
2:05 routes should be present and it compares
2:08 the current state to the intended state
2:10 this is what is meant by intent-based
2:12 networking
2:14 if i go into this spine device i can see
2:16 that i have a number of additional
2:18 anomalies cabling bgp and routes
2:22 a graphical map indicates something is
2:24 wrong with the cabling in this device
2:27 this is the device that was swapped
2:29 earlier by the technician in a remote
2:31 location
2:36 if we go to the root causes table we can
2:38 see that there are two root causes have
2:40 been identified based on the anomalies
2:42 that are present in the blueprint
2:50 i can see three devices associated with
2:53 root causes
2:54 spine two border rack leaf one and
2:57 border rack leaf two
2:58 the tabular view is going to give me
3:00 details about how these root causes were
3:02 identified
3:04 root cause identification is telling us
3:06 these two spine leaf links are down it
3:09 determined this because of the
3:10 relationship of the associated anomalies
3:13 to the intent-based model
3:18 traditionally the technician in the
3:20 remote location would have to go to the
3:22 location in person and examine the rack
3:24 and the device and the cables that he
3:26 installed
3:29 but appstore gives me a more efficient
3:31 way to resolve this problem
3:35 by going into the stage tab and into the
3:37 links table
3:40 i can pull the current lldp data from
3:42 the devices this is the same information
3:44 that was used by the root cause
3:46 identification process to identify the
3:48 problems
3:49 i can update this cabling map
3:52 from that data
3:56 and by updating i'm going to have the
3:58 system configure the ports for the
4:00 appropriate devices on the other end
4:05 the new configurations will show up in
4:07 the uncommitted tab for review
4:10 we can see that the tabs turn yellow
4:13 this is a pre-change analysis that
4:15 allows me to verify what's going to
4:17 happen before pushing the changes to the
4:19 production network
4:20 in this case these links are going to be
4:22 swapped all looks good to me so i'll
4:25 commit that
4:27 i will write a note
4:38 when i commit staged commands appstr
4:41 sends instructions to the agents and the
4:43 agents determine the appropriate command
4:45 line syntax to apply to the devices this
4:48 is what we mean when we say you specify
4:50 the what and appstra will take care of
4:53 the how
4:54 it only takes a moment for each agent to
4:56 detect the new state and the anomaly
4:58 indications are resolving
5:00 you can see how they are all turning
5:01 green
5:06 let's go back to the dashboard view and
5:08 you can see that all the anomalies are
5:10 cleared and the network is operating in
5:12 the intended state
5:14 [Music]