Juniper Apstra Demo: Proactively address network issues with intent based analytics
Extinguish a network fire before it sparks!
Apstra uses closed-loop automation, analytics, and network assurance to validate your network operations and give you real-time insight into how your network is performing.
You’ll learn
How to use closed-loop automation to give you real-time insight
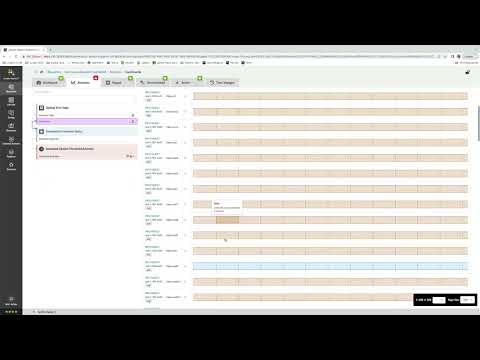
What the Apstra dashboard looks like during this process
Who is this for?
Experience More


Transcript
0:01 hard persistent failures aren't
0:03 difficult it's Shades of Gray that are
0:05 tough to find
0:06 the problem is I'm finding a needle in a
0:08 haystack it's finding a needle and a
0:10 stack of other needles
0:12 once you get the network up and running
0:14 you need to keep it running this is an
0:16 exercise in monitoring and maintenance
0:19 Tech Optics is an example in a typical
0:21 data center you're swimming in an ocean
0:23 of sfps finding the failed ones is easy
0:26 but finding the degraded ones how do you
0:28 diagnose something that is kind of
0:30 working
0:31 with appstra you can move from reacting
0:34 to a failure to acting based on a
0:36 precondition of a failure this is hugely
0:38 impactful
0:40 in this demo we're running a
0:41 multi-vendor fabric with a couple of
0:43 juniper switches and a couple of Arista
0:45 switches
0:46 apps includes a wide selection of
0:48 predefined IBA or intent-based analytics
0:50 probes
0:51 and you can create your own custom
0:53 probes
0:55 in this demo we're going to instantiate
0:57 one of the predefined IBA probes that
0:59 monitors Optical transceivers
1:04 let's look at the statistics that we're
1:06 able to collect from this probe
1:08 we can see we have Optics from different
1:10 vendors and a wealth of data from those
1:12 Optics
1:17 it's possible to filter and sort based
1:19 on that vendor field or any other
1:21 captured value
1:26 we can also drill down to view stats
1:28 within individual Lanes on multi-lane
1:30 Optics
1:34 we can see that the probe has already
1:36 raised anomalies for some of the
1:38 interfaces
1:45 we can drill down into the probes and
1:46 see exactly what's going on in this case
1:49 we're seeing a receive power threshold
1:51 warning
1:54 we can also view historical data for
1:56 each of these probes over time
1:58 in this example we're looking for
2:00 interfaces that have experienced an RX
2:02 power low warning condition in the last
2:04 hour
2:13 we can also create custom dashboards
2:15 based on these probes
2:17 so if there's a particular condition
2:18 that's important to your business it's
2:20 very easy to build dashboards that are
2:22 meaningful to you
2:23 in this example we have created a
2:25 dashboard based on this same optic probe
2:27 and can easily view any anomalies that
2:29 this probe may have uncovered
2:31 this type of insight is very powerful
2:33 when operating a network
2:35 it will help with cost avoidance by
2:37 reducing the effort needed to identify
2:38 and resolve problems it will improve
2:40 your network reliability by allowing you
2:43 to identify problems before they become
2:45 outages and it will undoubtedly lead to
2:47 happier customers by helping you
2:49 proactively address problems before they
2:51 become catastrophic failures in fact
2:53 Yahoo Japan experienced a scenario very
2:55 much like this
2:57 they were able to use these abstra IBA
2:59 probes and custom dashboards to provide
3:01 a simple way to identify these problem
3:03 Optics when the degradation began and
3:05 act on them before they caused outages
3:08 with abstra you can identify problems
3:10 early before they cause major outages
3:12 you can find that needle in the stack of
3:15 needles
3:16 [Music]
3:17 foreign
3:19 [Music]
