AI-Driven SD-WAN Demo: Analytics
Network visibility like you’ve never seen before.
If you’ve ever wondered exactly how a user consumes analytics via the Mist Cloud, then this video is for you. As you’ll see, monitoring analytics all starts with the “Insights” page, which provides a straightforward yet detailed view into WAN performance, so you can get to the root cause of issues faster and easier.
You’ll learn
How historical views of WAN-related events and applications are displayed
How key WAN Edge device performance data is plotted in various charts
Some of the useful service level experiences (SLEs) you can get from the Session Smart Router
Who is this for?
Transcript
0:00 [Music]
0:05 the landscape of connecting enterprise
0:07 users devices and applications has seen
0:10 dramatic changes over a short time
0:12 expectations for secure connectivity
0:15 with great user experiences are as high
0:17 as they have ever been
0:19 nowhere are the operational challenges
0:21 resulting from this change felt more
0:23 acutely than at the far edges of the
0:25 network at the remote offices branch
0:28 sites and enterprise campuses
0:32 at juniper networks we have led the way
0:34 in applying innovative modern technology
0:36 solutions to these challenges
0:39 with wired and wireless access powered
0:42 by mist and we are excited to introduce
0:44 the newest piece of the ai driven
0:46 enterprise with win assurance powered by
0:49 session smart routing
0:50 this is what the branch of the future
0:52 looks like it is cloud managed ai driven
0:56 and smart about user experience
0:58 so let's walk through several days in
1:00 the life of this modern branch and see
1:02 what it is like to design deploy and
1:05 operate a full stack network with missed
1:08 ai
1:11 [Music]
1:14 we begin in the mist dashboard where we
1:17 have our sites configured for the
1:19 enterprise organization called acme we
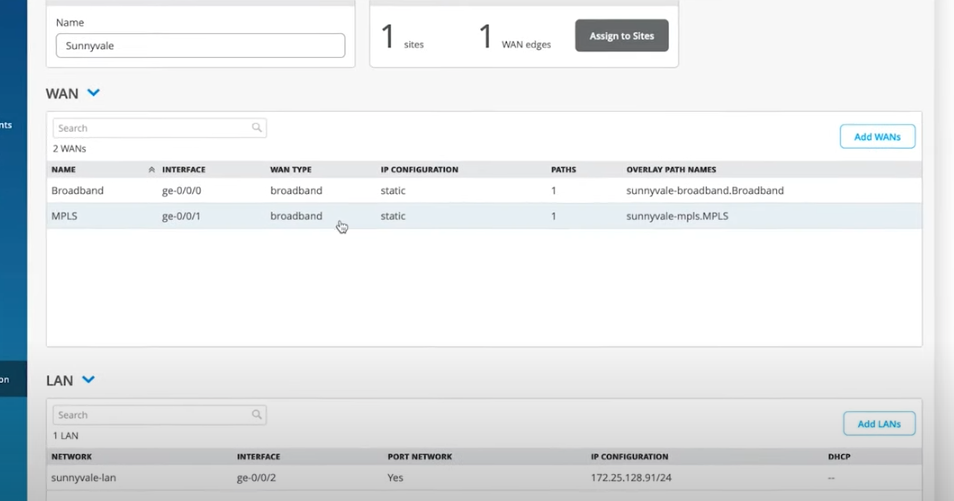
1:22 have sites in westford and sunnyvale
1:24 which are our data center hub sites
1:27 cupertino is acme's brand new site that
1:30 we need to bring online
1:32 in the organization-wide settings we
1:34 have configuration for our when
1:37 starting with networks this is where we
1:39 describe who our user populations are
1:41 and the segments that will be used to
1:43 connect them throughout the wan i've
1:45 created a network tenant segment called
1:48 trusted to describe our corporate users
1:51 next we move to services and we describe
1:54 the networks and applications that our
1:56 users will use the wan to connect to
1:58 services describe the destinations on
2:00 the network that will be given discrete
2:02 policy for routing access and security
2:06 starting simple we have two basic
2:08 services we want our wan to deliver
2:11 one is internet which is described by a
2:13 single quad zero address prefix matching
2:16 all ipv4 address spaces the other is
2:19 microsoft teams which is described by
2:22 one of the many predefined applications
2:24 that the wan identifies automatically
2:26 for services describing applications
2:29 users can pick from a huge variety of
2:31 apps known by our session smartwan by
2:33 default
2:36 can also use categories of applications
2:38 or define our own identifiers to create
2:40 services for custom applications
2:44 now that we have a few named services
2:46 that the wan will deliver and we have a
2:48 network tenant describing who will be
2:50 accessing the services we need to
2:52 describe how the wan will be connecting
2:55 them this starts with topology
2:58 for the acme cupertino site we have mpls
3:00 and broadband for connectivity we need
3:03 to define each of these as overlays and
3:06 give path names to each of our westford
3:08 and sunnyvale hub sites
3:11 moving on to our wan edge templates we
3:13 have some of the local configuration
3:15 that will be applied at the sites
3:18 looking to our sunnyvale wan edge we
3:20 will manage the local device
3:22 configuration using templates since this
3:24 will be the first of many sites for acme
3:27 templates will help our cupertino branch
3:29 and all future sites deploy with
3:31 consistency
3:32 here you can see that our sunnyvale and
3:34 westford templates will inform those
3:36 sites they will operate as hubs in the
3:38 relevant overlays
3:40 and we can see that our new cupertino
3:42 branch is going to be a spoke to both on
3:46 the lan connected to the wired and
3:48 wireless access devices we have our
3:50 trusted network segment
3:52 for defining how the site will use the
3:54 available connectivity we have path
3:57 preferences
3:58 for cupertino and future sites using
4:00 this awan edge template they will use
4:02 overlay paths starting with the mpls
4:05 path to sunnyvale as primary followed by
4:08 the broadband path to sunnyvale and
4:10 finally the mpls and broadband paths to
4:13 westford
4:14 so at this point we have who our user
4:17 populations are what services the wan is
4:20 going to deliver and a strategy on how
4:23 the connectivity is to be used
4:25 a service policy is where we tie all
4:27 these things together oriented around
4:30 the service here we declare that our
4:32 trusted users are allowed access to the
4:35 internet service using the path
4:37 selection policy we have identified that
4:40 is mpls first broadband second
4:43 and that's it our basic design of the
4:45 wan connecting our new cupertino branch
4:47 is complete the wired and wireless
4:50 access is similarly defined and all we
4:52 must do next is unbox our devices and
4:55 connect them
5:00 today is the big day
5:02 our wired wireless and wan devices have
5:05 arrived and today our new branch site
5:07 goes live
5:08 here we have our new ssr branch device
5:11 with a missed claim code on it
5:14 this is consistent with a claim code
5:16 found on our missed access point and
5:19 juniper ex switch also fresh out of the
5:21 box
5:24 as we look at our wired and wireless
5:26 device inventory we have the switch and
5:28 ap already claimed because the devices
5:31 have never been turned on they are still
5:33 disconnected
5:35 let's go ahead and now claim our wan
5:37 edge device by entering the claim code
5:39 we indicate that we want to associate
5:41 the device with our cupertino site and
5:44 initiate the claiming process
5:46 in this instance we are claiming the
5:48 devices one at a time but this can be
5:51 done in bulk as we ramp up the pace of
5:53 deployment
5:54 once claimed the device is instantly in
5:56 our inventory associated with the
5:59 cupertino site
6:00 now we just need to plug everything in
6:13 making the physical wan connections the
6:16 yellow cable is the primary mpls
6:18 connection and blue is the secondary
6:21 broadband
6:28 next power is applied and our devices
6:30 boot up and connect to the cloud
6:33 one by one they learn of their function
6:35 topology and configuration and
6:37 transition into service
6:39 starting with the wan edge providing
6:42 connectivity for the switch providing
6:44 connectivity for the ap and last we see
6:47 from a user device that our acme corp
6:49 ssid begins broadcasting
6:54 we connect to it and get secure
6:56 connectivity for the user
6:58 as a trusted network tenant we can ping
7:00 destinations associated with our
7:02 internet service and open a browser to
7:05 access the web
7:10 heading back to our missed dashboard we
7:12 can now see that all branch wired
7:15 wireless and wan devices at our site are
7:17 now connected
7:21 our wan edge insights shows us that
7:23 telemetry is already arriving from the
7:25 ssr wan edge device
7:27 the device has securely learned its
7:29 place in the topology and is monitoring
7:31 the paths in the mpls and broadband
7:34 overlays
7:36 more than just the wan this is a
7:38 complete branch ztp experience including
7:41 wired wireless and now when
7:44 it is how thousands of sites can be
7:46 rolled out in a frictionless and
7:48 reliable deployment
7:50 before we leave the site let's show that
7:53 our session smart wan is able to
7:54 proactively respond to failures to
7:57 preserve user experience
7:59 let's invite a colleague to a teams call
8:04 our collaboration session gets underway
8:06 and we have high quality connectivity
8:08 through the wireless wired and wan
8:10 networks
8:13 with the call established over the
8:15 primary mpls path let's break the link
8:18 and see what happens
8:21 with ai-driven sd-wan the real-time
8:24 session is seamlessly failed over to the
8:26 secondary broadband path with minimal
8:28 disruption to the application experience
8:31 our site is now live with our user
8:33 experience enhanced by a tunnel-free wan
8:36 that minimizes faults and maximizes
8:38 uptime thanks to session smart routing
8:42 [Music]
8:46 okay our cupertino branch site is
8:48 deployed
8:49 let's fast forward a bit and look at
8:51 some of the wan insights being observed
8:53 by mist
8:54 our insights page gives us a view into
8:57 when performance for the site
8:59 we have a historical view of when
9:01 related events and applications that are
9:03 being used at the site are available for
9:05 review
9:07 also visible is a list of active client
9:09 devices that are utilizing the wan for
9:11 connectivity to services
9:14 these provide a comprehensive view of
9:16 user activity at the cupertino location
9:19 further down kiwan edge device
9:21 performance data is plotted in a set of
9:24 charts we see system resource
9:26 utilization including cpu forwarding
9:29 core and memory
9:30 near the bottom we see wan performance
9:33 for the network paths connecting this
9:35 wan edge to its peers this gives a
9:37 historical look at path behavior
9:39 including loss latency jitter and moss
9:42 score
9:48 being able to see all this when related
9:50 data with your own eyes is great but in
9:52 addition to wired and wireless telemetry
9:55 marvis our ai powered virtual network
9:57 assistant now sees wan data as well
10:01 starting with an organization-wide view
10:03 we see a top-level representation of our
10:05 user experiences in the wan
10:08 as our organization continues to roll
10:10 out to thousands of sites this lets us
10:12 quickly identify problem sites where wan
10:15 experience is being affected
10:18 here the wan telemetry from session
10:20 smart routers is processed to produce
10:23 sles which stands for service level
10:25 experience
10:27 looking at our recently deployed
10:28 cupertino site we can see that it is not
10:31 meeting service levels
10:33 clicking into the site we get a closer
10:35 look at the sles they are broken down
10:37 into three important health categories
10:39 that play a role in user experience the
10:42 wan edge device health the health of
10:44 when links and paths
10:46 and the health of applications
10:48 themselves
10:50 each sle is broken down into a simple
10:52 unit of measure for the user experience
10:55 called a user minute
10:57 simply put this is telling us what our
10:59 user experiences on the wan are per user
11:02 per minute
11:03 behind these seemingly simple
11:05 measurements are the complex and
11:06 powerful ai models of the missed cloud
11:09 fed by rich telemetry from the
11:11 sessionsmart network
11:13 for each sle we get a breakdown of the
11:15 root cause of the issues identified
11:18 whenever user experience is poor in the
11:20 wan mist not only tells us the root
11:23 cause but also tells us what was
11:25 affected
11:26 such as the impacted applications users
11:29 links paths and devices
11:32 let's take a look at a separate example
11:34 of sles in another recent real
11:36 deployment
11:37 here at this site we see that our user
11:39 experiences have not been affected by
11:42 things happening within the wan edge
11:43 device itself or by issues on wan links
11:47 but even still mist has noticed that
11:49 some application experiences are being
11:51 impacted
11:53 what could be going on
11:55 let's hop into our application health
11:57 sle to see
11:59 each sle contains a set of classifiers
12:02 that breaks down the root cause of poor
12:04 experiences in this case 98 of the times
12:07 that user experience has been poor the
12:10 cause has been actual application server
12:12 responsiveness issues going further into
12:15 sub classifiers we can see that apps
12:18 have been slow to respond even while all
12:20 the rest of the wan has been performing
12:22 perfectly looking at items affected by
12:24 this issue it shows us which users and
12:27 applications have been impacted
12:30 so miss told us that the network is fine
12:32 but there are issues out on the internet
12:34 that are causing the poor experience
12:36 let's check the news to see if there
12:38 have been any public reports of these
12:40 issues
12:41 sure enough this very same day there was
12:43 an amazon server outage applications
12:46 reported as impacted are the same ones
12:48 that mist told us about this is wan
12:51 assurance in action helping us find
12:53 impactful issues wherever they are from
12:56 client to cloud
13:01 [Music]
13:04 so what else can marvis do for us meet
13:07 marvis actions the proactive side of
13:09 marvis
13:10 marvis identifies actions that users can
13:13 take to improve their user experience if
13:16 there is action that can be taken to
13:17 improve the network it will be brought
13:19 to the forefront here
13:21 for our wan we see that marvis has
13:23 identified a persisting lte signal
13:26 quality issue
13:27 from here we can drill into the details
13:29 of the issue and get a better sense of
13:31 the impacts looks like i should take
13:33 some action and have the antenna
13:35 adjusted this is a great example of
13:38 marvis helpfully suggesting actions we
13:40 can take to make the user experience
13:42 better
13:46 [Music]
13:48 now marvis isn't just in the background
13:51 working on sles and looking to suggest
13:53 helpful actions marvis is also ever
13:56 present in the forefront of the missed
13:58 experience you can ask marvis questions
14:00 about the network at any time you can
14:03 ask it to help you do things like
14:04 troubleshoot a device or access
14:06 documentation
14:08 at our cupertino site we know teams is
14:11 an important collaboration application a
14:13 particular user at the site has noticed
14:16 periodic issues with poor teams calls
14:18 let's ask marvis to help us out
14:22 marvis quickly responds with a handful
14:24 of team sessions that it determined were
14:26 calls from our user yesterday
14:28 great let's ask marvis to troubleshoot
14:30 one of them marvis returns the
14:33 end-to-end path of the session from
14:35 client to cloud app server
14:37 we can see that marvis points out the
14:39 wan as a source of issues that impacted
14:42 the experience going one step further it
14:45 shows us the wan edges that the session
14:47 traversed and it pinpoints high network
14:50 jitter between the edge devices that
14:52 impacted the experience
14:54 think about that for a moment
14:56 a simple question why was my team's call
14:59 bad a question that would historically
15:01 need to be answered by top technical
15:03 operators across different disciplines
15:05 of expertise going device to device
15:08 pouring through logs and packet captures
15:11 mountains of monitoring information just
15:13 to answer where the session went and
15:15 where it went wrong
15:17 a simple question simply answered by
15:20 asking marvis
15:21 now that marvis has pinpointed the issue
15:23 let's go look at our sles for the wan at
15:26 the site
15:27 going to yesterday we see clear
15:29 indication of user minutes impacted by
15:32 wan link health
15:33 as we look at the classifiers and
15:35 subclassifiers of the issue root cause
15:38 we see the jitter marvis told us about
15:40 in the affected items we see that all
15:42 paths of connectivity for the site
15:44 experience jitter which indicates a
15:47 regional connectivity issue affecting
15:49 both wand types in the area
15:51 it also explains how even with the
15:53 capabilities of session smart routing
15:55 deployed to maximize experience no
15:58 decent forms of connectivity were
16:00 available and the impacts of the event
16:02 were felt by our user
16:09 this is ai driven sd-wan in action
16:13 in this demo we saw how our day zero
16:15 site design was created using powerful
16:18 templates for wan which can be
16:19 flawlessly repeated at thousands of
16:22 sites
16:22 next on day one we brought our site live
16:25 with frictionless deployment
16:27 from freshly unboxed devices to secured
16:30 wired wireless and wan connectivity
16:33 finally throughout day two operations we
16:36 saw how user experiences in the wan are
16:38 assured to be the absolute best they can
16:40 be
16:42 and when they could not marvis was able
16:44 to help us quickly find the cause and
16:46 give us actionable insights to help us
16:48 improve it this is just a taste of how
16:52 juniper's ai-driven sd-wan provides
16:54 exceptional experiences for end users
16:57 and simplifies operations for it
17:00 administrators
17:07 [Music]
17:09 you