Juniper Networks Contrail Observability


Watch: A quick but important look at Contrail observability
In this short video, Juniper’s Shean Leigon talks about how Contrail Networking extends support to common platforms like Prometheus and Grafana for observability, FluentD for logging and Influx for Flow monitoring.
You’ll learn
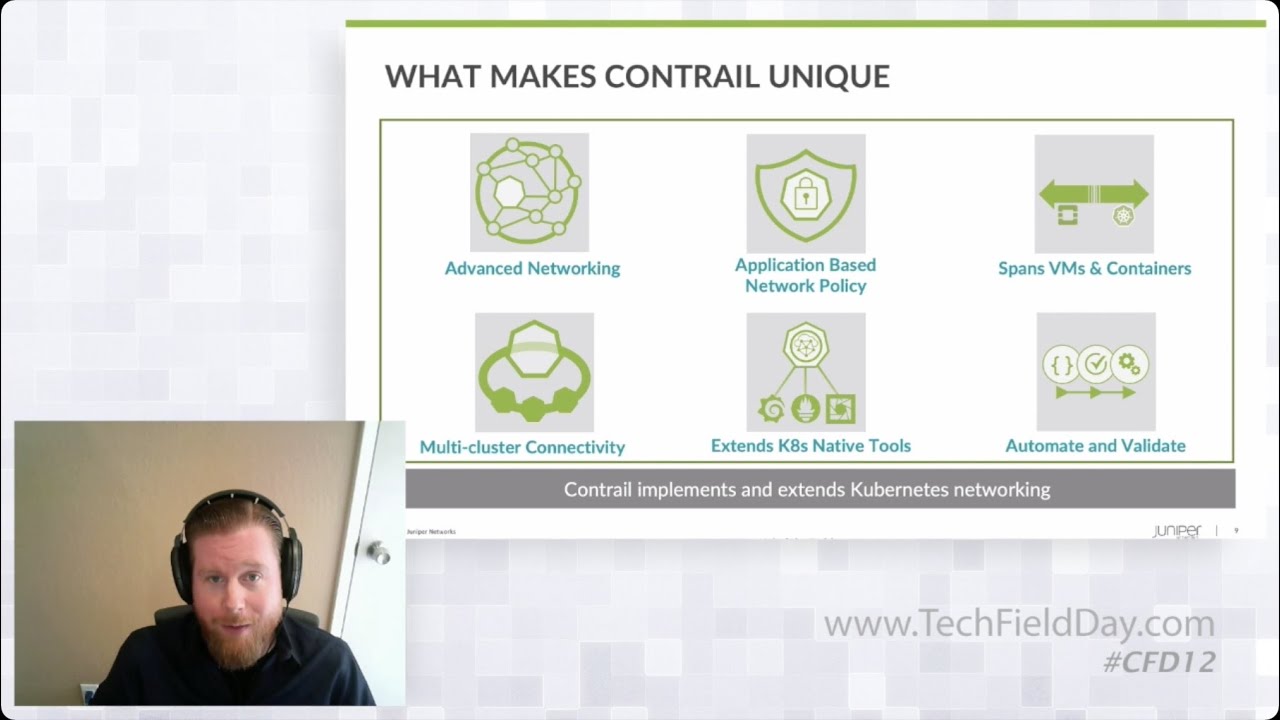
What Juniper is doing from a Kubernetes observability perspective with Contrail
How we are extending the tools available within the Kubernetes ecosystem and leveraging them in Contrail
How we are meeting customers where they are when it comes to Kubernetes and Contrail
Who is this for?
Host
Transcript
0:09 my name's sean legan and i uh i'm on the
0:11 contrail product team um handling a lot
0:13 of our cloud and sdn stuff as well so
0:15 just want to touch base a little bit on
0:17 uh some of the things that we're doing
0:18 from an observability perspective
0:20 with contrail and and really it goes
0:22 beyond that too it's just kind of some
0:24 of the tooling nick talked about in the
0:25 opening around
0:27 you know extending
0:28 some of the other tools that are
0:30 available within the the kubernetes
0:31 ecosystem
0:32 and leveraging those in contrail and
0:34 basically the idea here is a lot of
0:36 times to kind of meet customers also
0:38 where they're at right we we realize in
0:40 a lot of scenarios there's a lot of
0:41 things outside of contrail
0:43 in a kubernetes environment that's very
0:45 important so how do we how do we kind of
0:46 pull these things together and get
0:48 everything integrated there's a couple
0:50 different ways that we do this one of
0:51 these is a
0:52 an extension that we have within lens uh
0:55 so for those that are familiar with lens
0:57 it's one of the most
1:00 popular kind of ide environments for
1:03 kubernetes um the nice part here is
1:05 we've developed an extension directly
1:08 for contrail you can see kind of a
1:09 screen shot of that on the right hand
1:10 side um the other components here also
1:13 uh prometheus and grafana so um you know
1:16 the the gui with with lens and then also
1:18 the analytics components these are these
1:19 are fully optional um we're working with
1:21 prometheus and grafana to unify all the
1:23 monitoring capabilities so the idea here
1:26 is that you can go and look at that at
1:27 all kind of a
1:29 a single view if you already have a an
1:31 architecture in place and you want to
1:32 tie contrail into that
1:34 or you can have separate instances as
1:36 well
1:37 handling that so you can kind of um also
1:39 do a little bit of bring your own
1:41 analytics
1:42 and then uh on the on the logging and
1:44 and so forth we're also leveraging uh
1:46 fluentd um an elastic stack uh is as
1:49 well so again tying directly into kind
1:51 of those kubernetes native uh constructs