Paragon Insights Datasheet
Download DatasheetProduct Overview
Increasing data traffic and emerging technologies like IoT, connected vehicles, and 5G mean service providers, cloud providers, and enterprises need a way to analyze volumes of telemetry data in real time to in order to gain insight into overall network health, produce actionable intelligence, and take corrective actions as needed.
Paragon Insights leverages machine learning and sophisticated algorithms to transform real-time analytics into valuable and actionable insights for improved overall network health, thus reducing mean time to detect and mean time to restore.
Paragon Insights combines needed EMS functionalities along with streaming telemetry and analytics, and paves the way towards an data driven-led network management approach.
Product Description
As networks evolve to accommodate exponential traffic growth generated by cloud- native applications and emerging technologies, service providers, cloud providers, and enterprises need a network analytics solution that provides real-time information to help them maintain control over such a dynamic and unpredictable environment.
Machine learning has transformed network analytics by offering real-timedata and actionable intelligence that contribute to operational efficiency. By providing multidimensional network views in conjunction with structured network information, machine learning contributes to root cause analysis, traffic engineering, and network optimization.
Combining the power of telemetry, programmability, advanced algorithms, and machine learning, the Juniper® Paragon Insights (formerly HealthBot) solution not only provides common EMS functionalities but also provides unique network management capabilities through rich data analytics. Integrated with the Juniper Telemetry Interface (JTI), Paragon Insights aggregates large volumes of real-time telemetry data and correlates to provide predictive insights that offer a multidimensional view across the entire network. Open programmability enables network operators to build highly customized health monitoring and diagnostics workflows.
By focusing on a programmable framework supported by open-sourced data pipelines and collectors for data ingestion, Paragon Insights powers network analytics and encourages collaboration across network teams, ultimately enhancing agility and innovation.
Architecture and Key Components
Paragon Insights includes the following key features:

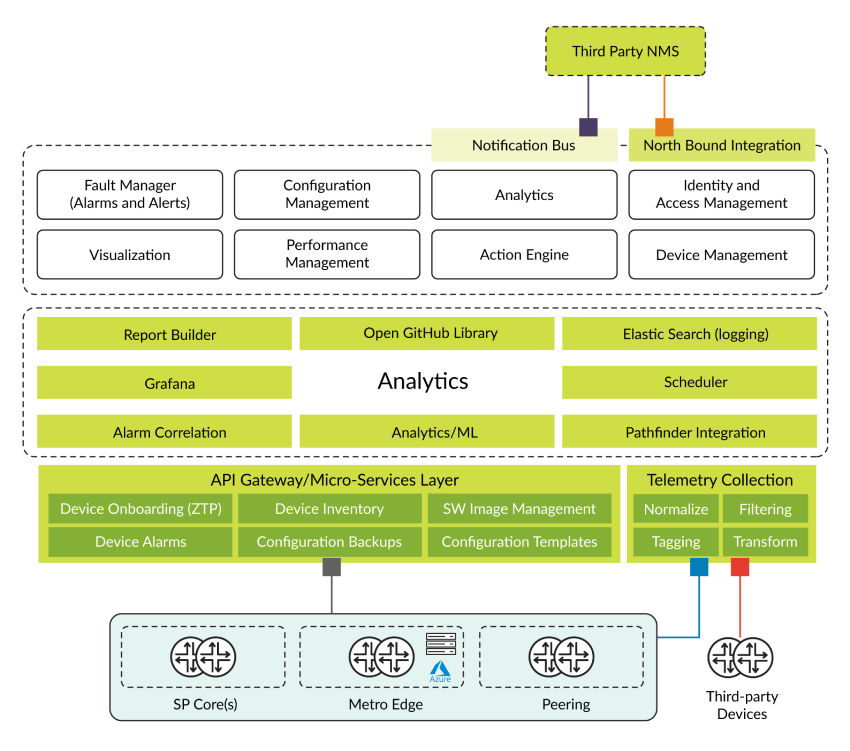
Figure 1: An overview of Paragon Insights architecture
- Streaming Telemetry: Streaming telemetry is enabled by the standards-based gNMI, OpenConfig, telemetry, and JTI, a distributed mechanism designed to stream live event-driven network statistical data. JTI relies on a push model to deliver data asynchronously, eliminating oversight of notable network events and data that occur under the traditional pull model. This results in a highly scalable solution monitoring thousands of objects in a network.
- Element Management Functions: Rich feature set for device management such as Device onboarding, Configuration checks, software upgrades, configuration templates, inventory management, and audit logs.
- Customization: Network elements play multiple roles on a network, such as broadband network gateway (BNG), provider edge (PE), core, leaf-spine, and more. Each network element follows distinct KPIs where there is no single standard definition of network health across all use cases. Paragon Insights provides a framework for defining and customizing health profiles, referred to as playbooks, providing truly actionable insights for the specific network and devices being monitored.
- Programmability: A simple service designer offering a functional drag-and- drop GUI lets service providers and enterprises quickly create policies and quality of service (QoS) playbooks designed to intelligently automate service maintenance and sustain overall performance goals.
- Open Integration: A programmability-first approach supports Paragon Insights ingest data from open-source data pipelines and collectors. Paragon Insights also has the ability to publish all collected, processed, and evaluated data back to the customer’s data lake for long-term storage.
- Machine Learning: Paragon Insights leverages advanced algorithms and machine learning capabilities, correlates multiple data sources, establishes operational benchmarks, and performs anomaly detection, outlier detection, and predictive analytics—a critical component for intent-based networking.
- Centralized Dashboard: A highly customizable dashboard offers users a personalized visual representation of resource metrics, log messages, alarms, health, and reports, correlating the relationship between entities (devices, services, hosts, instances) and enabling users to apply business logic and required policies.
- Microservices-based architecture: Based on Kubernetes orchestration, Paragon Insights has a scale-out architecture that automatically creates the containers needed to collect and analyze the required data. Paragon Insights also supports multi-node deployments, ensuring that services running on a worker node that crashes get redistributed to other nodes that are still running.
- TSDB Scale Out and High Availability: Paragon Insights supports Time Series Database (TSDB) scale out through sharding, allowing data to be distributed on multiple nodes. Paragon Insights also supports replication of TSDB data across different nodes for redundancy and to support high availability.
Features and Benefits
| Features | Benefits |
| Data collection | Collect and normalize data across standards-based collection methods, including UDP, OpenConfig and gNMI streaming Telemetry, gRPC, SNMP, NETCONF, CLI, Syslog, NetFlow, custom-defined ingest, or ingest from your own data lake. |
| Element Management | Device Onboarding, Configuration Templates, Inventory management, SW Image Upgrade, Zero Touch Provisioning, with high availability options |
| Machine learning-based analytics | Dynamically masters the baseline performance of infrastructure elements and network applications for anomaly detection, outlier detection, predictive analytics, and network resource optimization. |
| Intent-based networking | Paragon Insights is a critical component of Juniper’s intent-based networking solution, providing critical historical and predictive analytics. |
| Programmable network diagnostics analytics tool | Paragon Insights provides customizable analytics through YANG-based playbook definitions and user-defined functions, along with seamless integration with Kafka, Webhook, Slack, REST APIs, and HBEZ/HBEZGo (for Python and Go libraries) for data ingestion, analytics, and notifications. |
| Closed-loop automation | By combining the power of fine-grained telemetry and analytics with workflow automation, Paragon Insights automates root cause analysis and performs corrective actions based on predefined KPIs. |
| Network visibility | By providing visualized details about network logs, health status, outliers, and behavior, Paragon Insights improves capacity planning while eliminating service downtime. |
| Extensible | Paragon Insights playbooks, which can be created by Juniper, the Paragon Insights user community, and end users like you, provide holistic solutions for EVPN-VXLAN, Microburst detection, Juniper Networks SRX Series Services Gateway security, L3VPN monitoring, and more. |
Specifications
- Telemetry collection methods:
- Network Configuration Protocol (NETCONF)
- CLI
- gNMI
- JTI streaming telemetry
- OpenConfig telemetry
- SNMP
- System logging
- NetFlow
- sFlow*
- EMS Capabilities:
- Configuration management
- Inventory view (Chassis/Card/Interface)
- Logs
- Device Image upgrade
- Task Scheduler
- Visualization methods:
- Live Dashboarding Widgets
- Time Inspector Views
- Live Tile view
- Grafana
- Kibana for Device Logs
- Multivendor capable through gNMI, SNMP, NetFlow, sFlow*, CLI, and Syslog
- YANG-based health profile (playbook) and root cause analysis definitions
- Python-based user-defined functions and user-defined actions
- ML-based anomaly detection
- ML-based outlier detection
- ML-based KPI prediction
- Web-based GUI and REST; NETCONF API
- Webhooks, REST API, Slack, Kafka integration
- Docker container-based architecture
- Kubernetes orchestration
- TSDB scale out and high availability
Juniper Networks Services and Support
Juniper Networks is the leader in performance-enabling services that are designed to accelerate, extend, and optimize your high-performance network. Our services allow you to maximize operational efficiency while reducing costs and minimizing risk, achieving a faster time to value for your network. Juniper Networks ensures operational excellence by optimizing the network to maintain required levels of performance, reliability, and availability. For more details, please visit www.juniper.net/us/en/products-services.
Ordering Information
For Juniper Paragon Insights ordering information, please visit www.juniper.net/us/en/products-services/network-automation/paragon-insights/.
You can find supported platforms here: https://www.juniper.net/documentation/us/en/software/paragon-automation21.3/paragon-automation-user-guide/topics/concept/pa-device-support.html.
About Juniper Networks
Juniper Networks brings simplicity to networking with products, solutions and services that connect the world. Through engineering innovation, we remove the constraints and complexities of networking in the cloud era to solve the toughest challenges our customers and partners face daily. At Juniper Networks, we believe that the network is a resource for sharing knowledge and human advancement that changes the world. We are committed to imagining groundbreaking ways to deliver automated, scalable and secure networks to move at the speed of business.
1000709 - 002 - EN JULY 2023


