Help us improve your experience.
Let us know what you think.
Do you have time for a two-minute survey?
Help us improve your experience.
Let us know what you think.
Do you have time for a two-minute survey?
You can now monitor and troubleshoot live Zoom meetings directly from the Mist portal using the Live Debug feature. Live Debug is a real‑time monitoring and diagnostic tool that enables network administrators and support teams to observe ongoing Zoom meetings, analyze participant Quality of Service (QoS) metrics (such as latency, jitter, and packet loss), and correlate issues with client and site conditions. You can use it to investigate ongoing quality problems, proactively monitor critical meetings, and perform post‑incident analysis to confirm root causes and validate fixes.
The Live Debug feature is available in the Meeting Insights section on the Monitor > Service Levels page. To start a live debug capture, identify the meeting that needs troubleshooting and click the Process button.
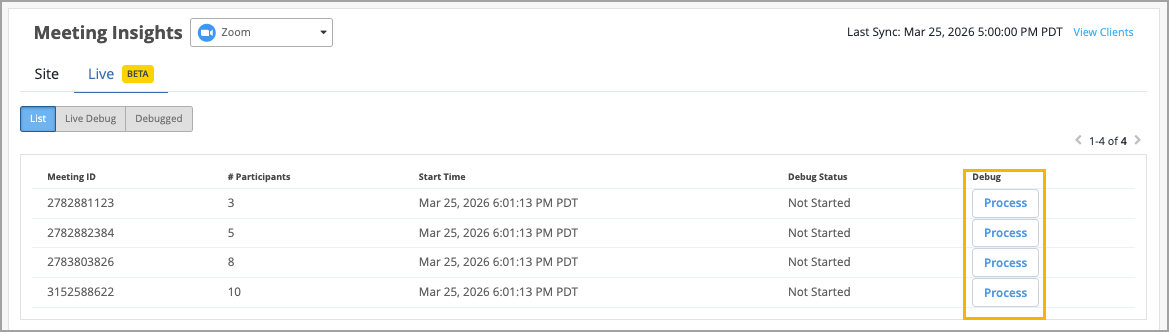
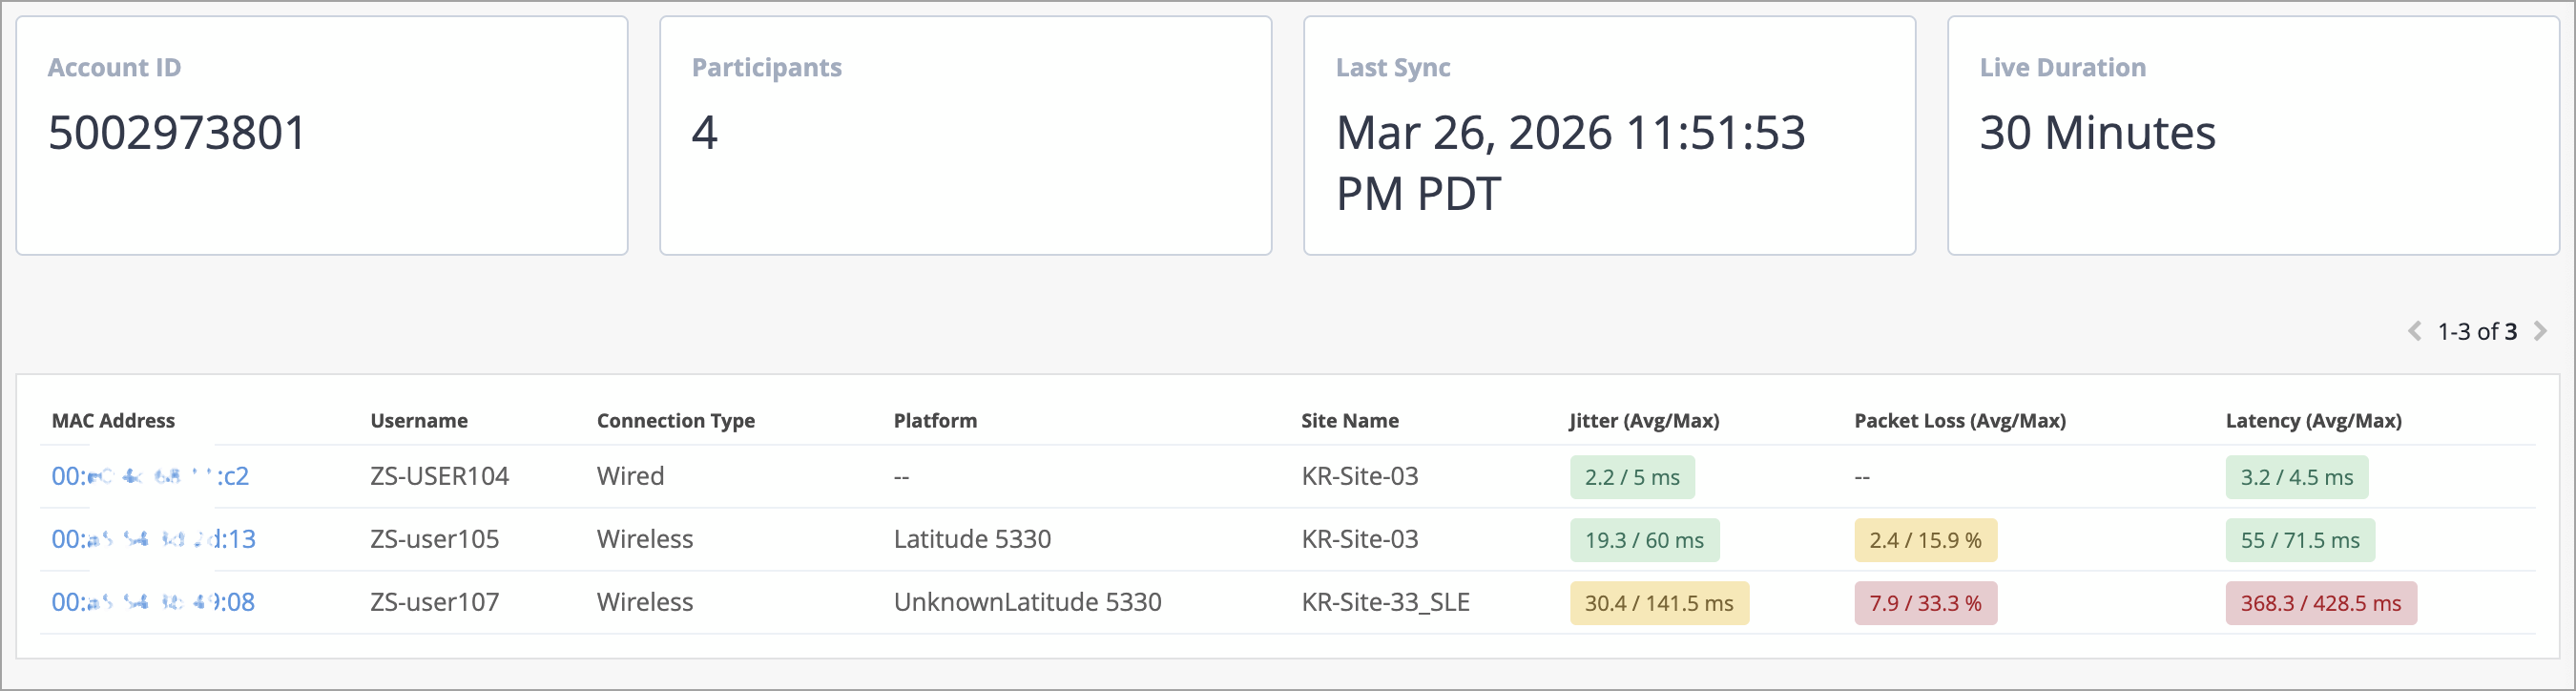
The captured debug data includes the key information such as meeting ID, number of participating devices, client MAC addresses, and per-client QoS metrics.
For more information, refer to Monitor and Troubleshoot Live Zoom Meetings.
India Cloud (APAC 02) now supports Zoom and Microsoft Teams integrations with Mist to collect data on Zoom and Microsoft Teams calls.
For more information on integrating Zoom with Mist, see Integrate Zoom Business Account with Mist.
For more information on integrating Microsoft Teams with Mist, see Integrate Your Microsoft Teams Account with Mist.
The EMEA 01, EMEA 02, EMEA 03, and EMEA 04 cloud instances now provide access to Mist Resource Center, an in-product guidance tool that displays new feature announcements, product updates, visual guides, and contextual help within Mist.
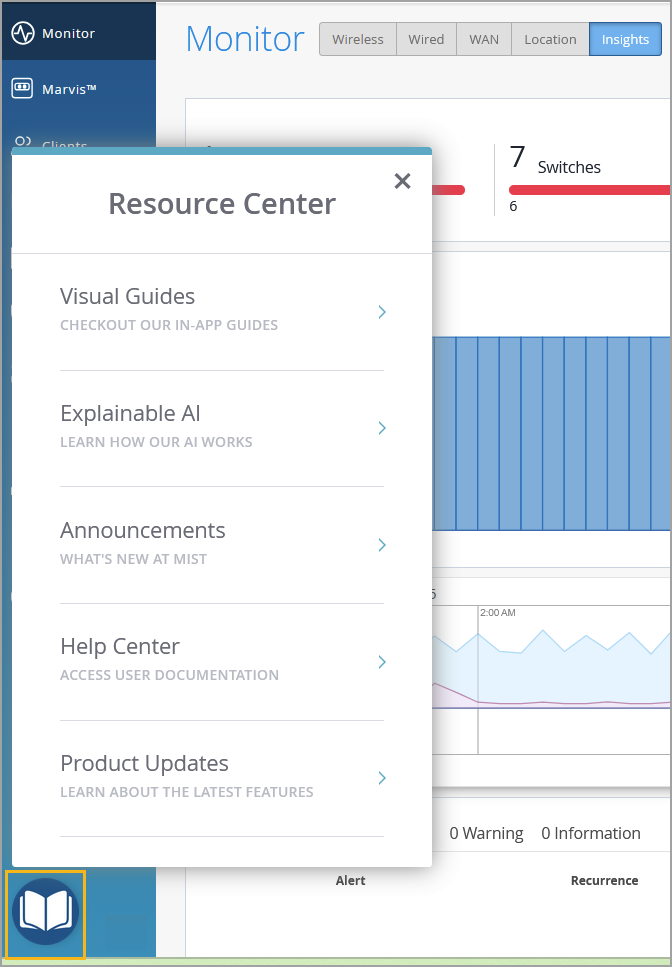
To get access to the Resource Center, enable the following settings:
Organization-level setting—Go to the Support Access section on the Organization > Settings page and select the Allow Mist Support Team to access your Mist Organization check box. This setting allows administrators to enable or disable the use of in‑product guidance tools for their organization. For more information refer to Enable or Disable Juniper Mist Support Access.
User-level privacy setting—Enable Privacy Setting in Mist Account. This setting allows each user to provide or withhold consent independently, ensuring individual control over participation.
You are also prompted about these privacy options when creating an account.
Note that other cloud instances already provide access to the Resource Center.
We have introduced the following enhancements to enhance usability and provide clearer actionable insights:
Additional filtering options—Users can now filter the Marvis Minis SLE data by applications and VLANs. This enhancement allows for more focused analysis, enabling users to focus on specific network segments or applications most relevant to their needs.
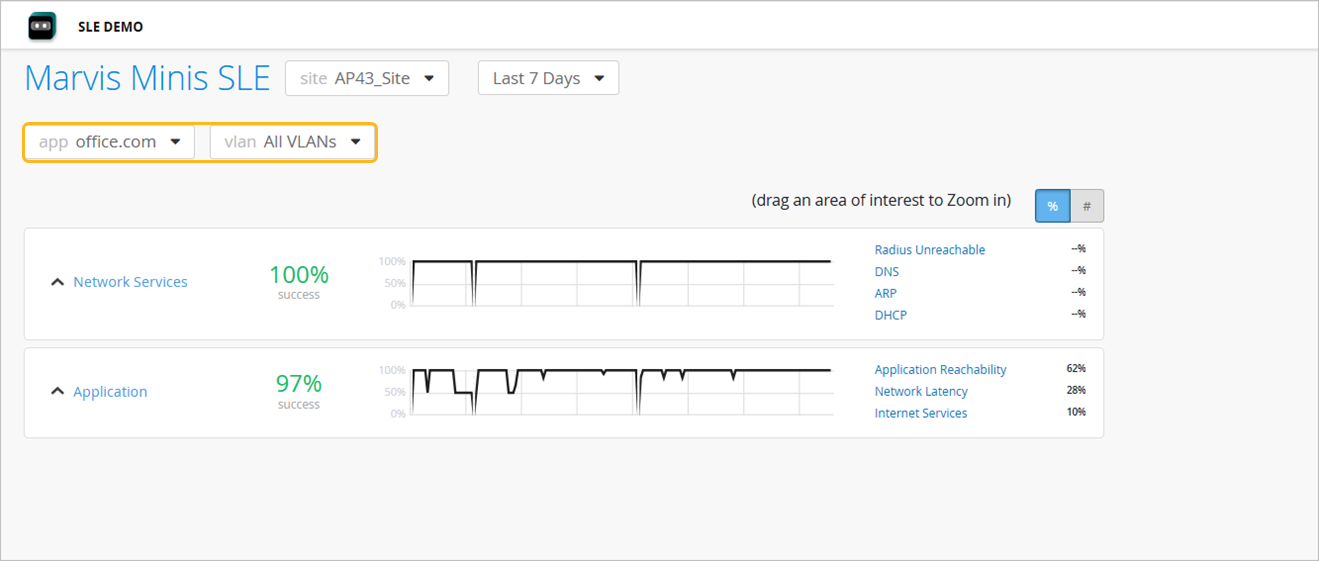
For added granularity, users can also filter the data for a specific classifier.
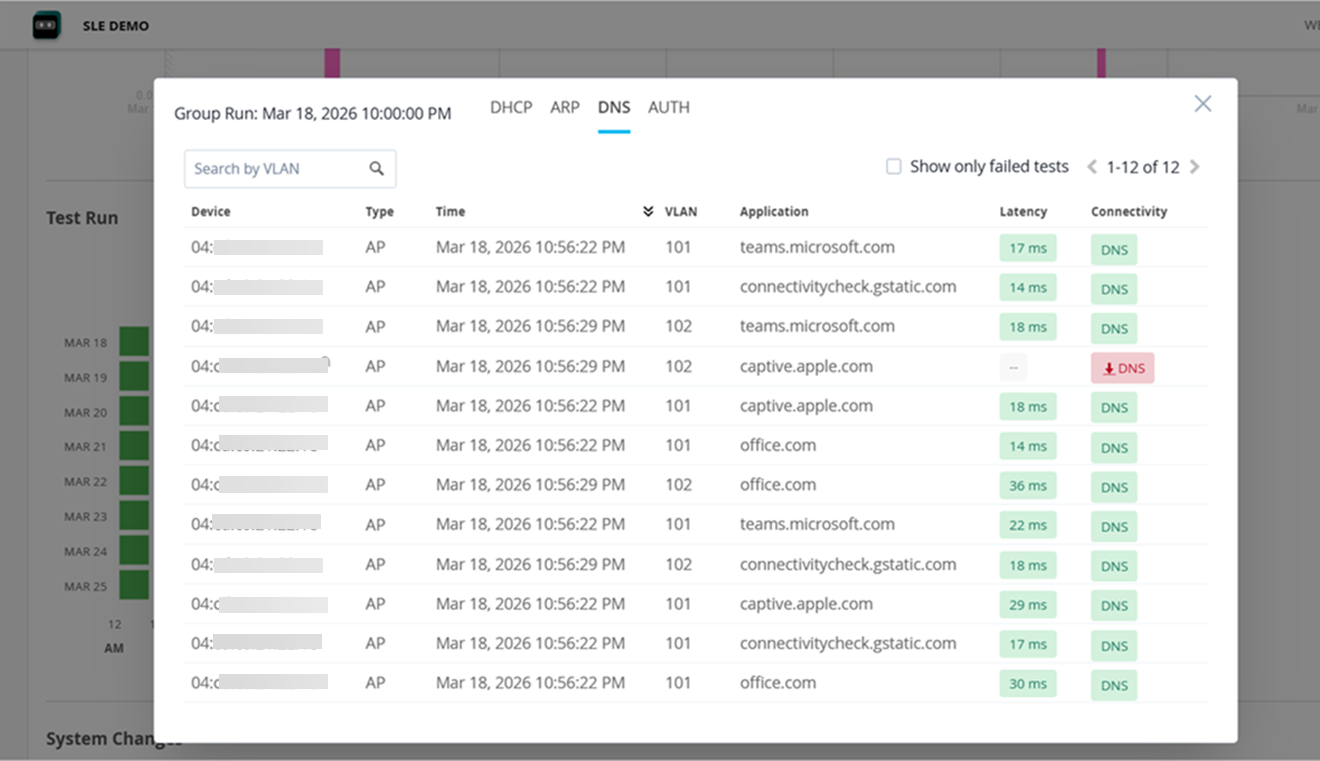
Checkerboard chart visualization—The Marvis Minis SLE page now features a checkerboard chart that provides a quick visual summary of hourly validation test outcomes at the site level. Users can view the chart for a selected timeline, classifier, and delve into the specifics of each individual test for more detailed insights. You can also view the chart for a specific application or VLAN.
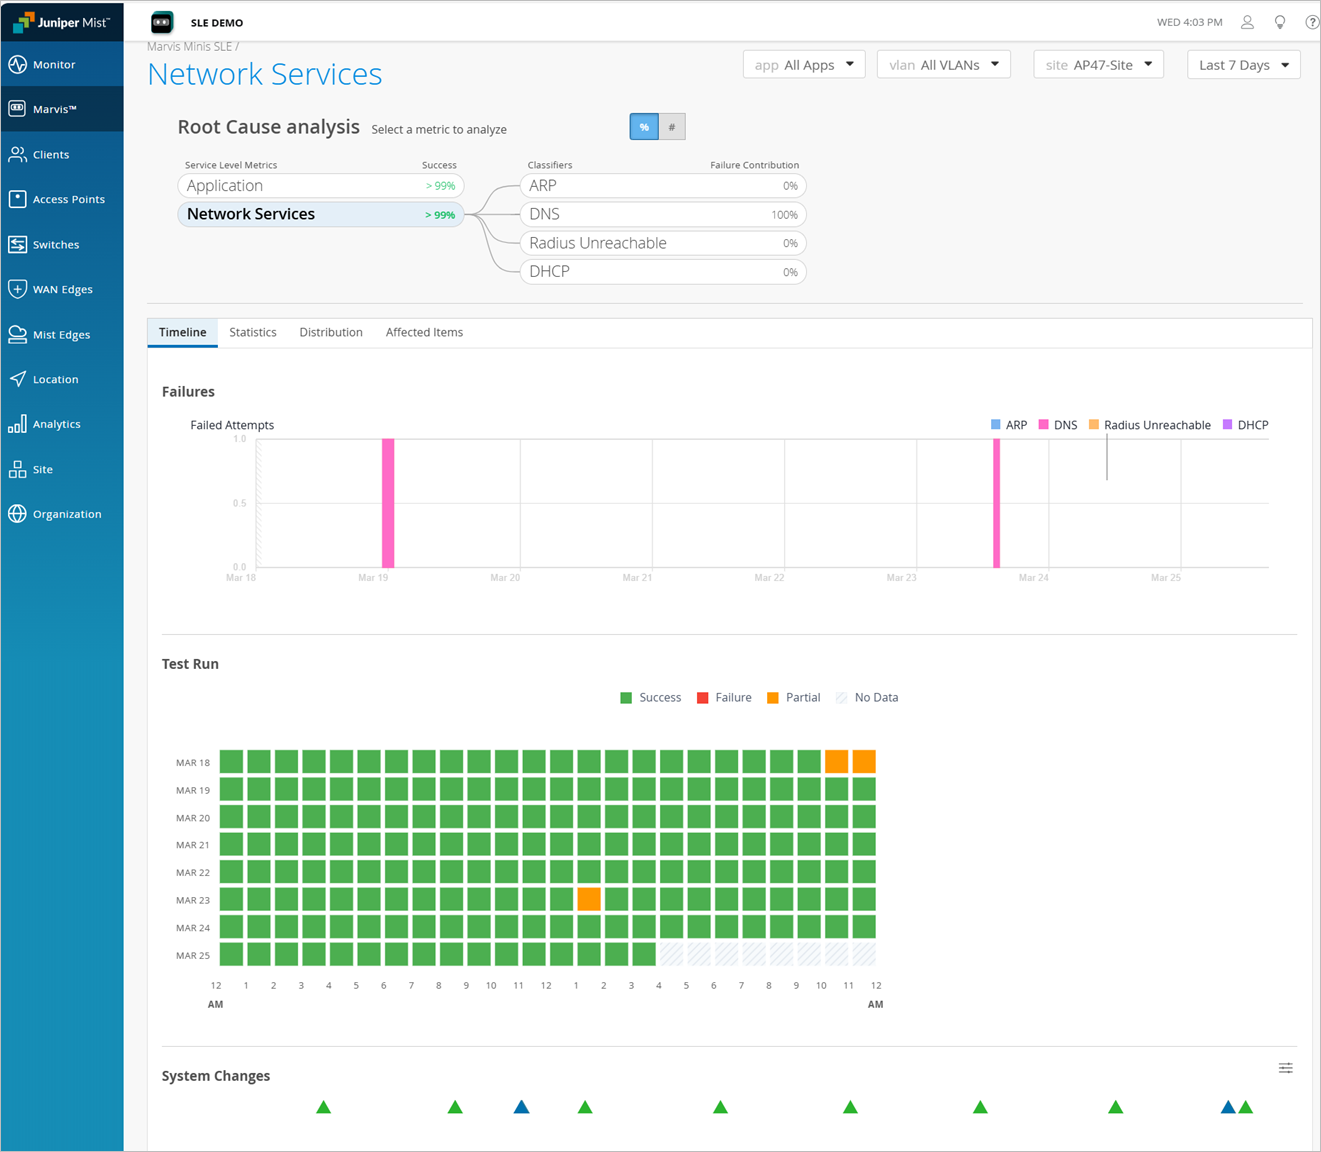
Every cell on the checkerboard chart represents data from an hourly validation. By clicking on a cell, users can view the details of the tests executed, including its results.
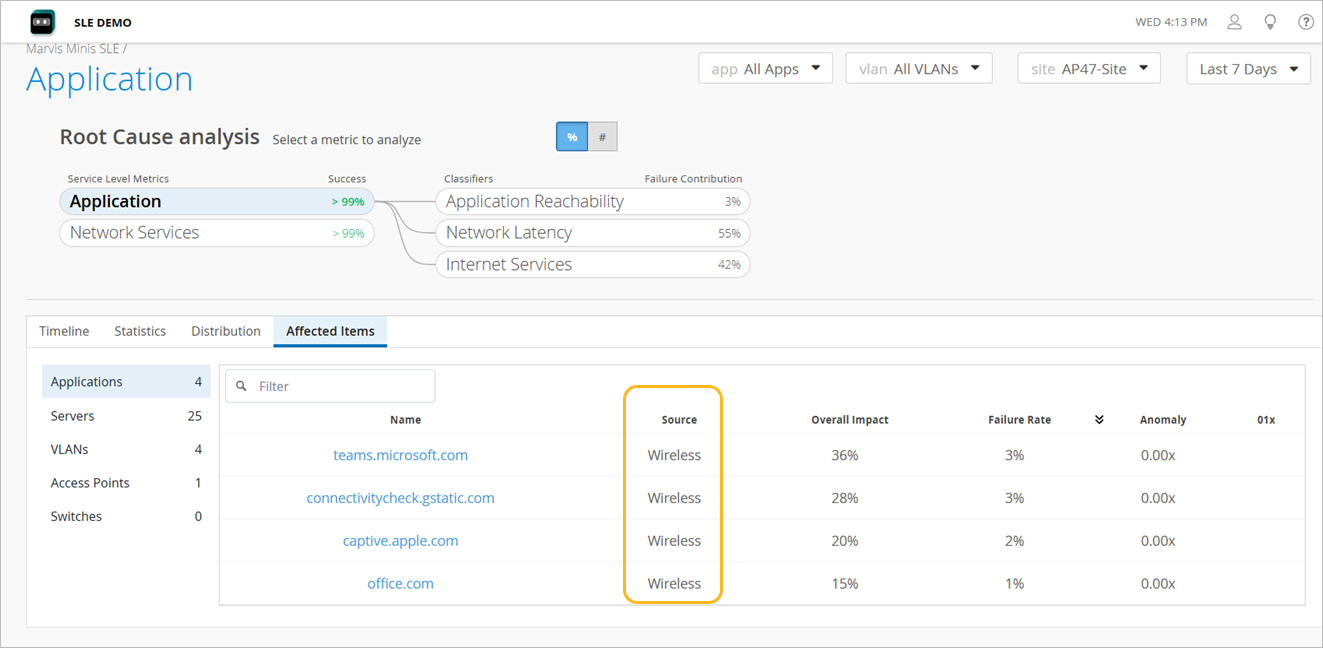
Visibility into issue detection source—The Distribution and Affected Items tabs feature a new Source column, which indicates whether the issue detection occurred during a wireless or wired test.
Option to provide feedback on latency and packet loss data—We have provided an option to submit feedback about latency and packet loss detected by Marvis Minis at a site level for applications. You can report issues you encounter, undetected problems, or incorrect information.
To access the feedback option, select a site and an application from the drop-down lists on the top of the Marvis Minis SLE page. You will find the feedback link available below the latency and packet loss graphs.
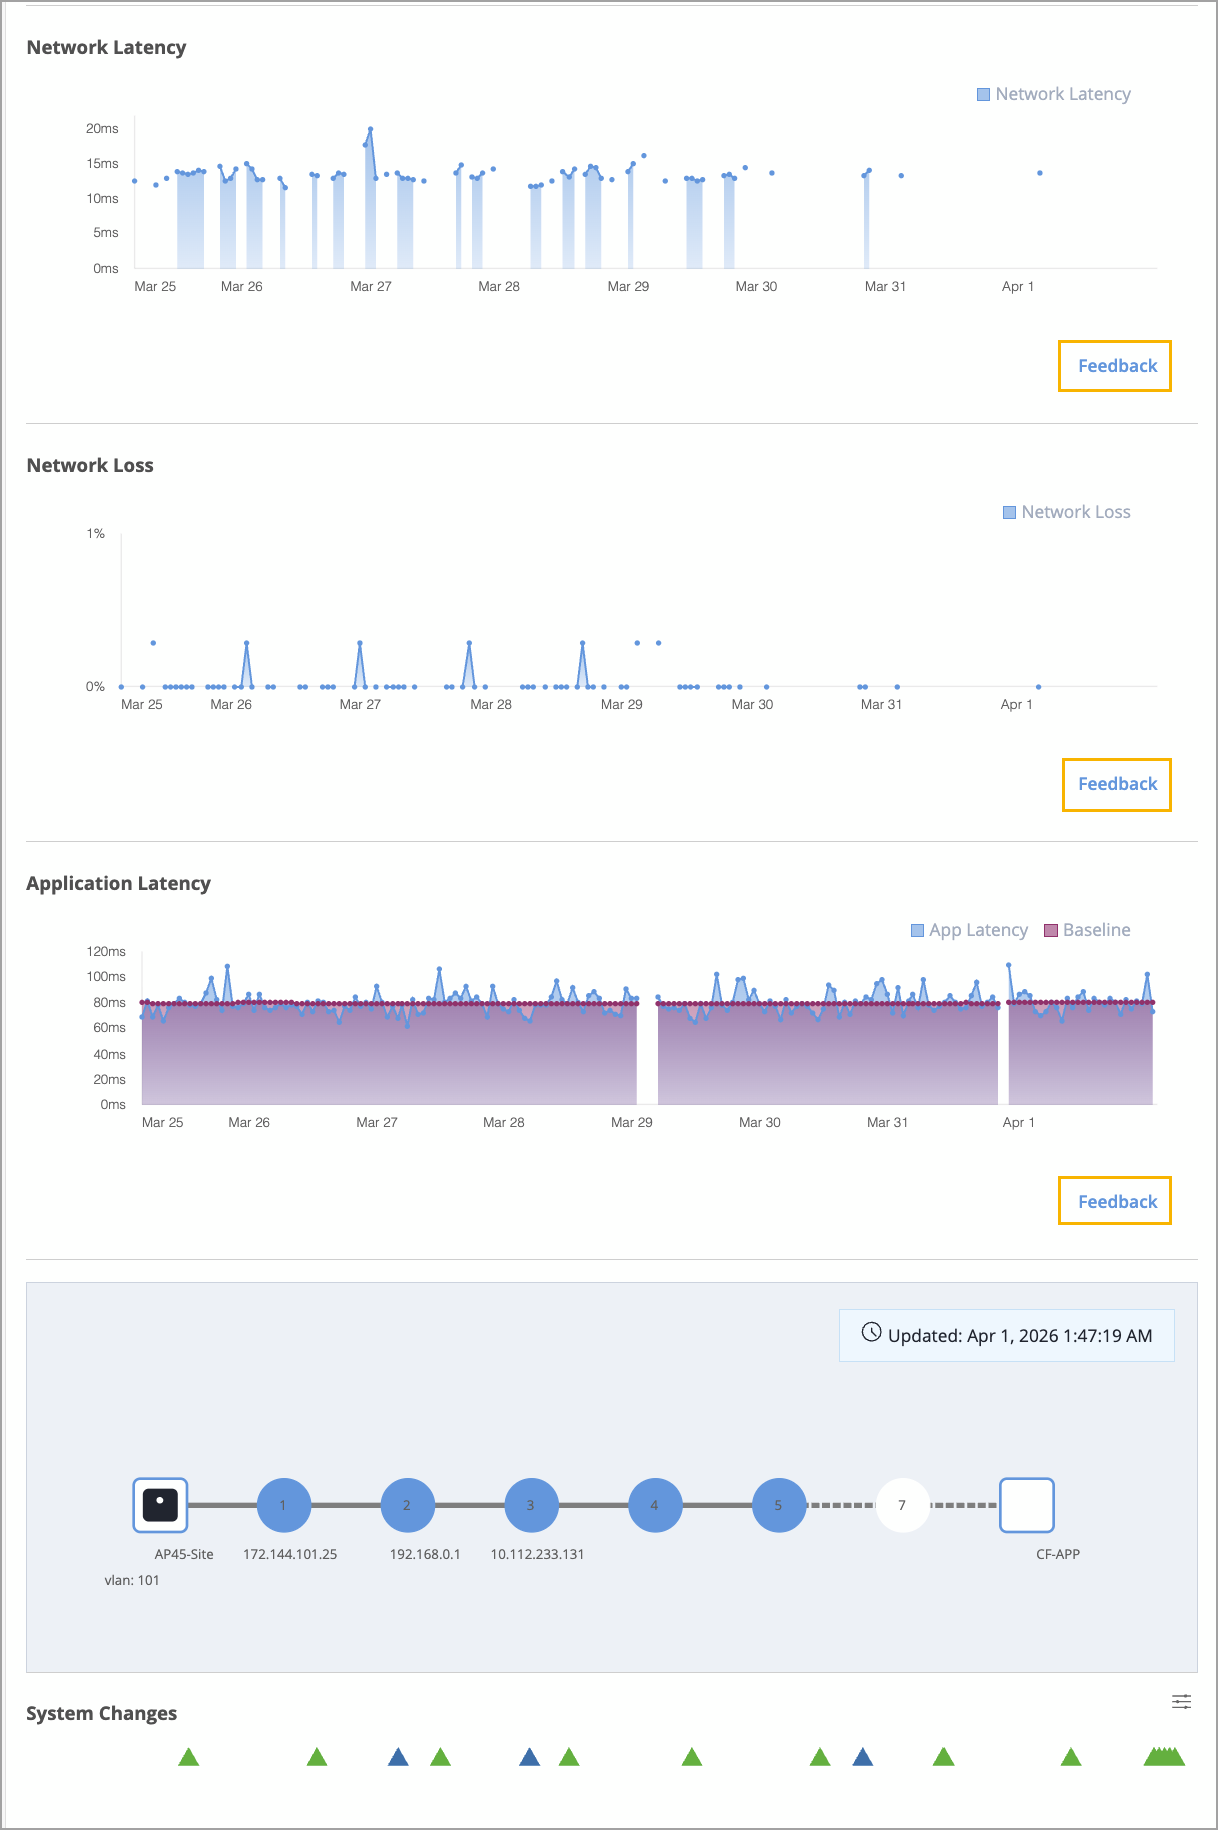
If your feedback pertains to a specific time range, simply select the relevant area on the graph. This action will open the feedback dialog box where you can enter your comments and observations.
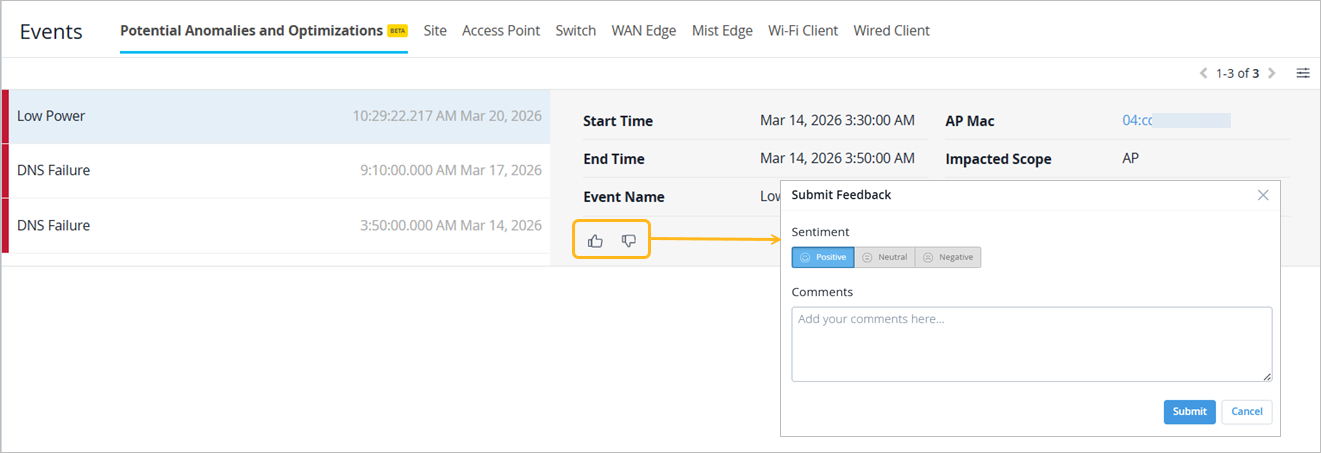
We are looking for feedback about potential anomalies detected by Marvis to enable ongoing enhancements to user experience. You can submit details about issues you encounter, as well as report undetected problems or incorrect information.
To submit feedback, use the feedback option located on the Potential Anomalies and Optimizations tab on the Insights page.
We are excited to introduce DFS Optimization, a new self‑driving Marvis Action designed to bring greater visibility and intelligence to how the Mist Radio Resource Management (RRM) system handles Dynamic Frequency Selection (DFS) radar events and their effect on Wi‑Fi channel assignments.
DFS Optimization gives customers clear insight into how radar‑impacted channels are evaluated over the last seven days and how that activity influences channel selection. Channels are classified as follows:
Normal—Assigned as usual.
Limited use—Restricted due to recent radar activity.
Restricted—Avoided because of heavy radar activity to reduce service disruption.
Limited capacity—Used when high AP density and limited available spectrum require it, helping to reduce co‑channel interference and contention even under challenging DFS conditions.
DFS Optimization eliminates guesswork by showing which channels are impacted, why they are classified that way, and how RRM is adapting its channel decisions. In addition, the Radio Management page, accessible from the left navigation under the site options, displays the number of radios assigned to each channel in the 5 GHz spectrum. This provides at‑a‑glance visibility into channel utilization and helps you better understand how the network distributes load across the available channels. When you open the DFS Optimization action (under the Wireless category in Marvis Actions), you will see a detailed table that includes site, last DFS event, and current channel classification (Normal, Limited use, Restricted, or Limited capacity). Selecting View more reveals DFS audit details such as radar event history over the past 7 days across the impacted channels and the categorization applied to each channel.
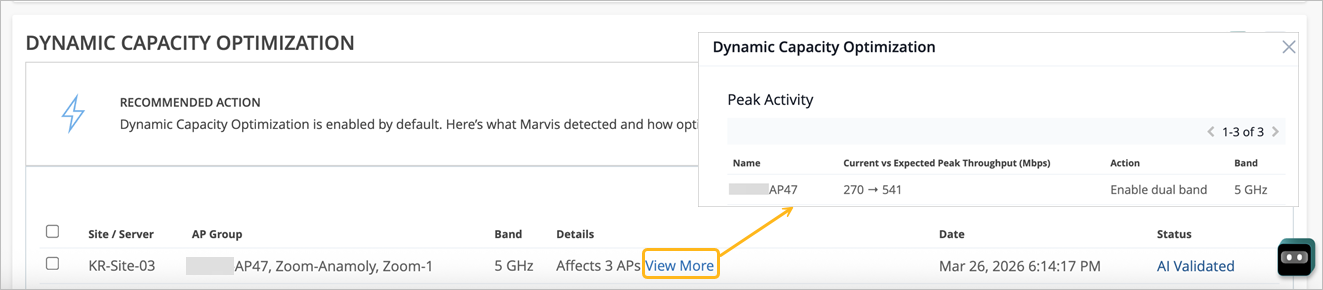
The Dynamic Capacity Optimization is a self-driving Marvis Action added to the Wireless category. When self-driving is enabled for this Marvis Action, it automatically adjusts the AP radio band and bandwidth settings to improve the overall Wi-Fi performance. In collaboration with RRM, the Dynamic Capacity Optimization Marvis Action focuses on band selection and channel bandwidth optimization to mitigate issues such as capacity constraints, high channel utilization, high client usage, and cochannel interference.
The Dynamic Capacity Optimization Marvis action is triggered when Marvis detects either a significant number of APs with insufficient capacity or a single AP that is consistently overloaded. To address these issues, the Dynamic Capacity Optimization action can enable dual band operation on APs so they can serve clients on dual 5 GHz or dual 6 GHz with 2.4 GHz auto-cancellation to increase capacity. It can also increase channel width (for example, from 20 MHz to 40 MHz) where conditions allow to provide more throughput per radio.
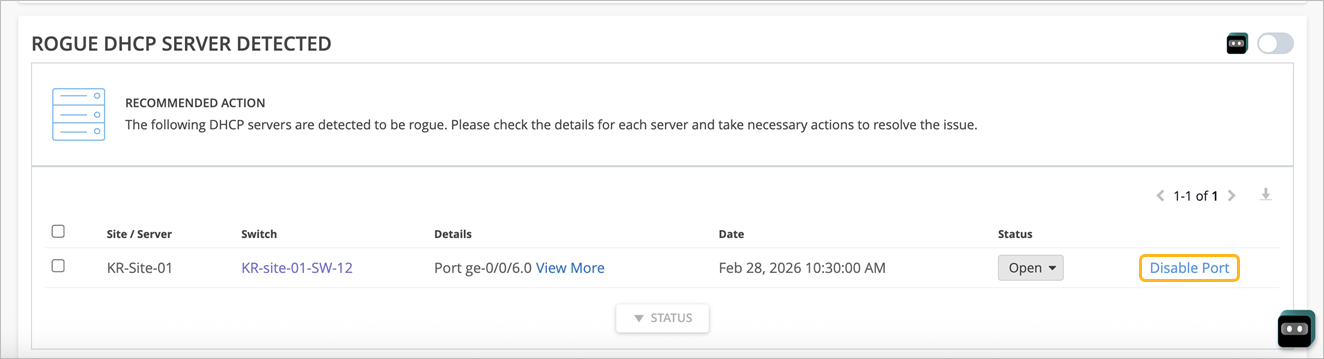
We have added a new self-driving Marvis Action called Rogue DHCP Server Detected under the Wired category. This action highlights unauthorized DHCP servers detected on EX Series access switches that have DHCP snooping enabled.
Marvis generates the Rogue DHCP Server Detected action after repeatedly observing DHCP offers from an unknown server and mapping the activity to a specific switch, port, VLAN, or site to confirm that it is an ongoing issue. When you enable the self-driving capability for this action, Marvis automatically disables the switch port used by the rogue DHCP server. Note that this only applies to access ports.
If self-driving is not enabled, you have the option to manually disable the port from the Marvis Actions page.
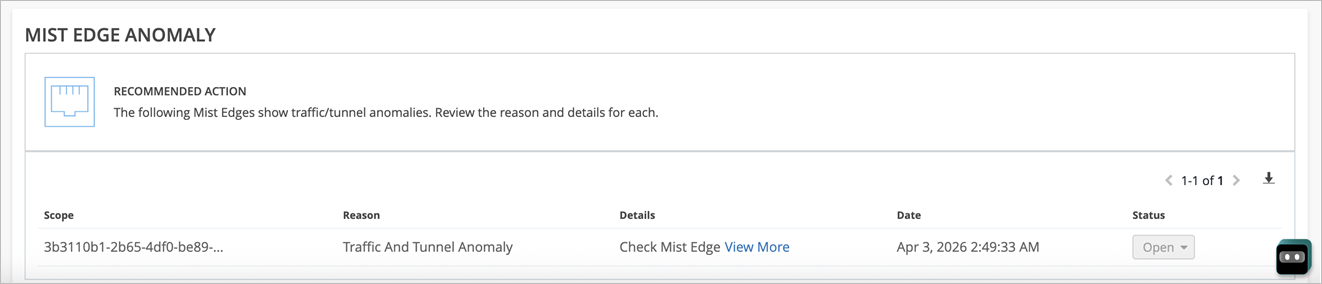
We have added a new Marvis Action called Mist Edge Anomaly under the Wireless category to highlight unusual traffic or tunnel behavior on a Mist Edge. Marvis leverages the telemetry data from the Mist Edges to detect and surface potential issues such as:
Abnormally low or huge spike in Tx/Rx traffic, which could indicate that traffic is not passing through the Mist Edge or a potential loop in the network.
Port/link errors potentially impacting connectivity and network performance.
Sudden drop in the number of AP tunnels terminating on the Mist Edge, suggesting that a large number of APs are unable to reach the Mist Edge.
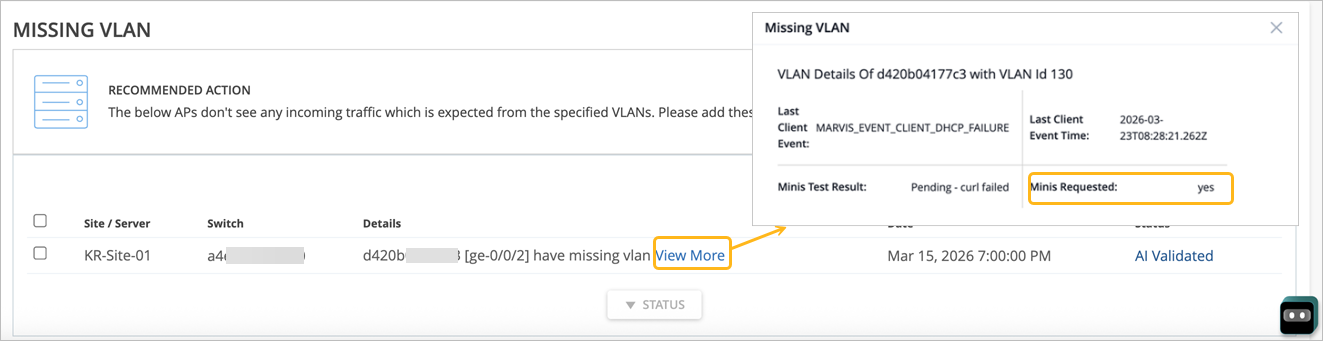
The scope of Marvis Minis validations has been expanded to cover detection of missing VLANs. When Marvis identifies a potential missing VLAN issue in the network, it now automatically initiates Marvis Minis validations (provided Marvis Minis is enabled for your organization). Marvis Minis tests and validates connectivity along the suspected VLAN path to confirm if the VLAN is missing and highlights issues with supporting evidence. The View More link provides details from the Marvis Minis validations.
We have expanded the potential anomaly visibility down to the device-level pages by introducing a new metric, Potential Anomalies, on the AP, Switch, and WAN Edge pages. Derived from the Marvis-detected potential anomalies, this metric represents the percentage of devices with no anomalies detected, providing visibility into both actionable and early-warning signals of issues.
To calculate this metric, Marvis evaluates the number of potential anomalies per device type:
If none of the devices have potential anomalies, the score is 100%.
If the devices have potential anomalies, the score decreases in proportion to how many devices are affected. For example, if a site has 10 APs and 2 of them have anomalies, the score is 80%.
Devices with potential anomalies are listed with a Troubleshoot button. Clicking the Troubleshoot button launches the conversational assistant with a pre-filled prompt such as “Troubleshoot <device> for last 7 days”, enabling you to view the detected anomalies without having to manually initiate troubleshooting.

Mist now automatically detects potential Layer 2 loops caused by VLAN ID overlaps between the EVPN overlay and the campus underlay on non‑core switches, especially when AP traffic is tunneled into Mist Edge.
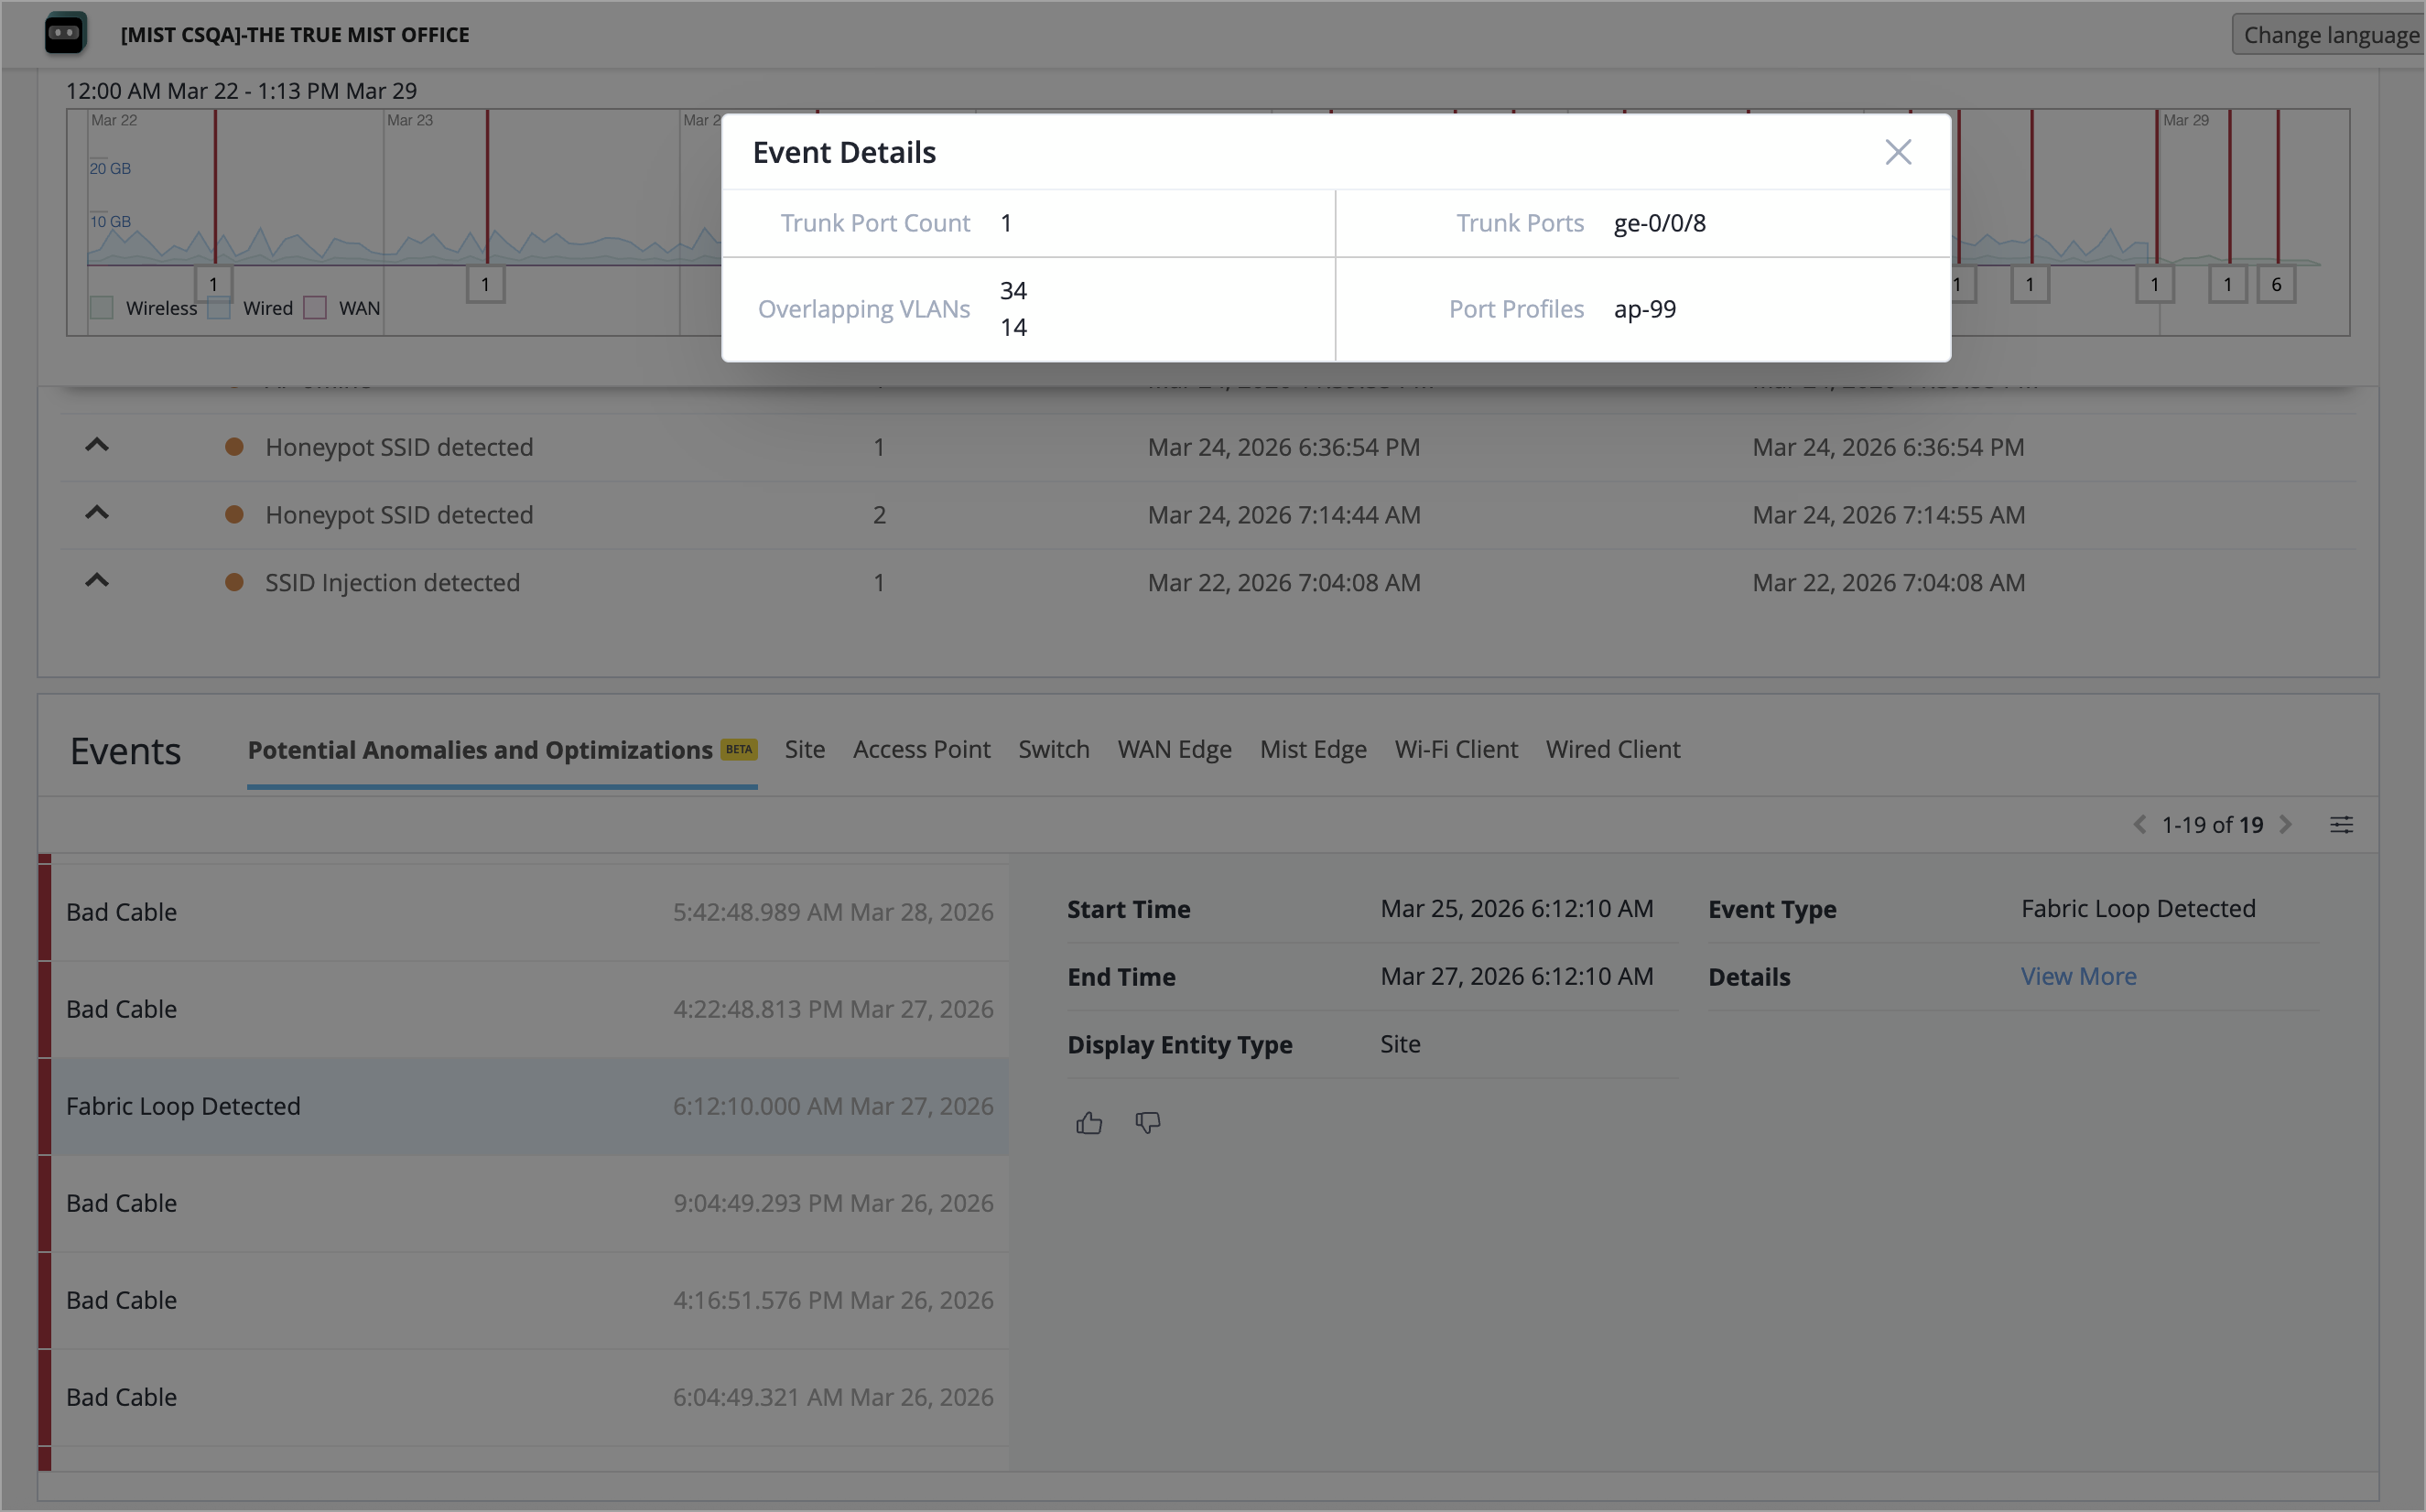
A VLAN ID overlap occurs when the same VLAN ID is used both as an EVPN overlay VLAN and as an underlay/access VLAN on non‑core switches (for example, on AP trunk ports). Such overlaps might cause the network to unintentionally create a parallel Layer‑2 forwarding path - one in the overlay and one in the underlay. This condition leads to bridging loops, broadcast storms, and service degradation. When Mist detects this issue at a site, it generates a site‑level event called Fabric Loop Detected. This event includes rich context so operators can quickly understand and fix the misconfiguration before it impacts user traffic.
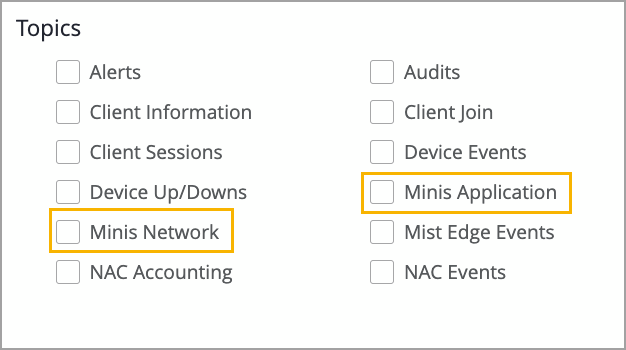
Mist has introduced two new webhook topics for Marvis Minis - Minis Network and Minis Application. These topics are available under site‑level and organization‑level webhook settings. These webhook endpoints allow external monitoring systems to consume network‑focused and application‑focused Marvis Minis insights separately, enabling cleaner, more efficient monitoring.
You will need a Marvis subscription (SUB-VNA) to subscribe to this webhook.
You can configure these webhook topics from the following pages:
Organization > Settings (organization-level settings)
Organization > Site Configuration > Site Name page (site-level settings)
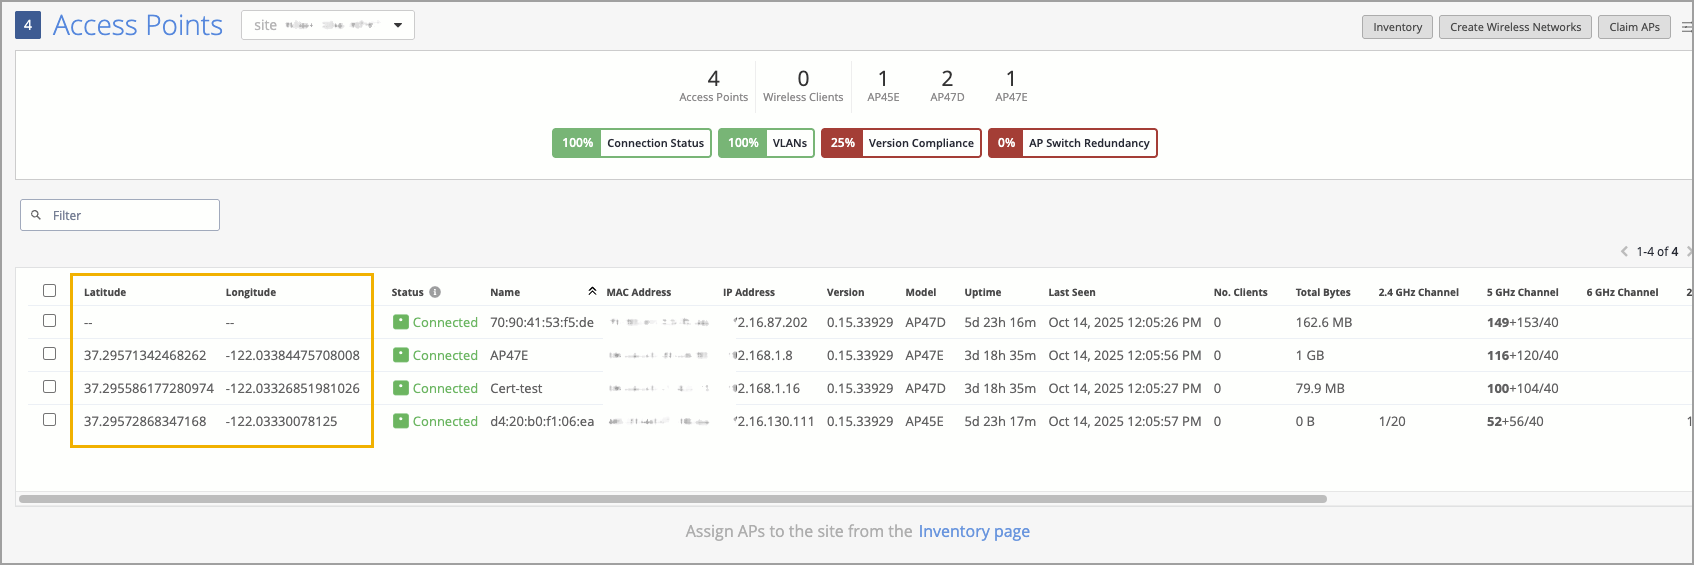
Juniper Mist now provides GPS‑based geolocation visibility for supported access points equipped with built‑in GNSS/GPS radios. When GPS data is available, Mist automatically displays APs' latitude and longitude coordinates across the AP List page, AP Details page, AP Insights, and the Location Live View. This enhancement provides administrators with location information determined by APs using GPS signals at their location.
For AP66D access points (APs), you can now select an antenna beam pattern in the Mist dashboard RF Templates (Organization > RF Templates) for the 5 GHz and 6 GHz bands. With the improved signal control, you can better align the RF signal to the shape of your physical environment. The beam patterns are: Wide (90° × 90°), Medium (30° × 90°), and Narrow (30° × 30°). The Wide beam pattern is useful in open areas, while Medium directs coverage along one dimension, such as a row, and Narrow concentrates RF coverage into a specific zone.
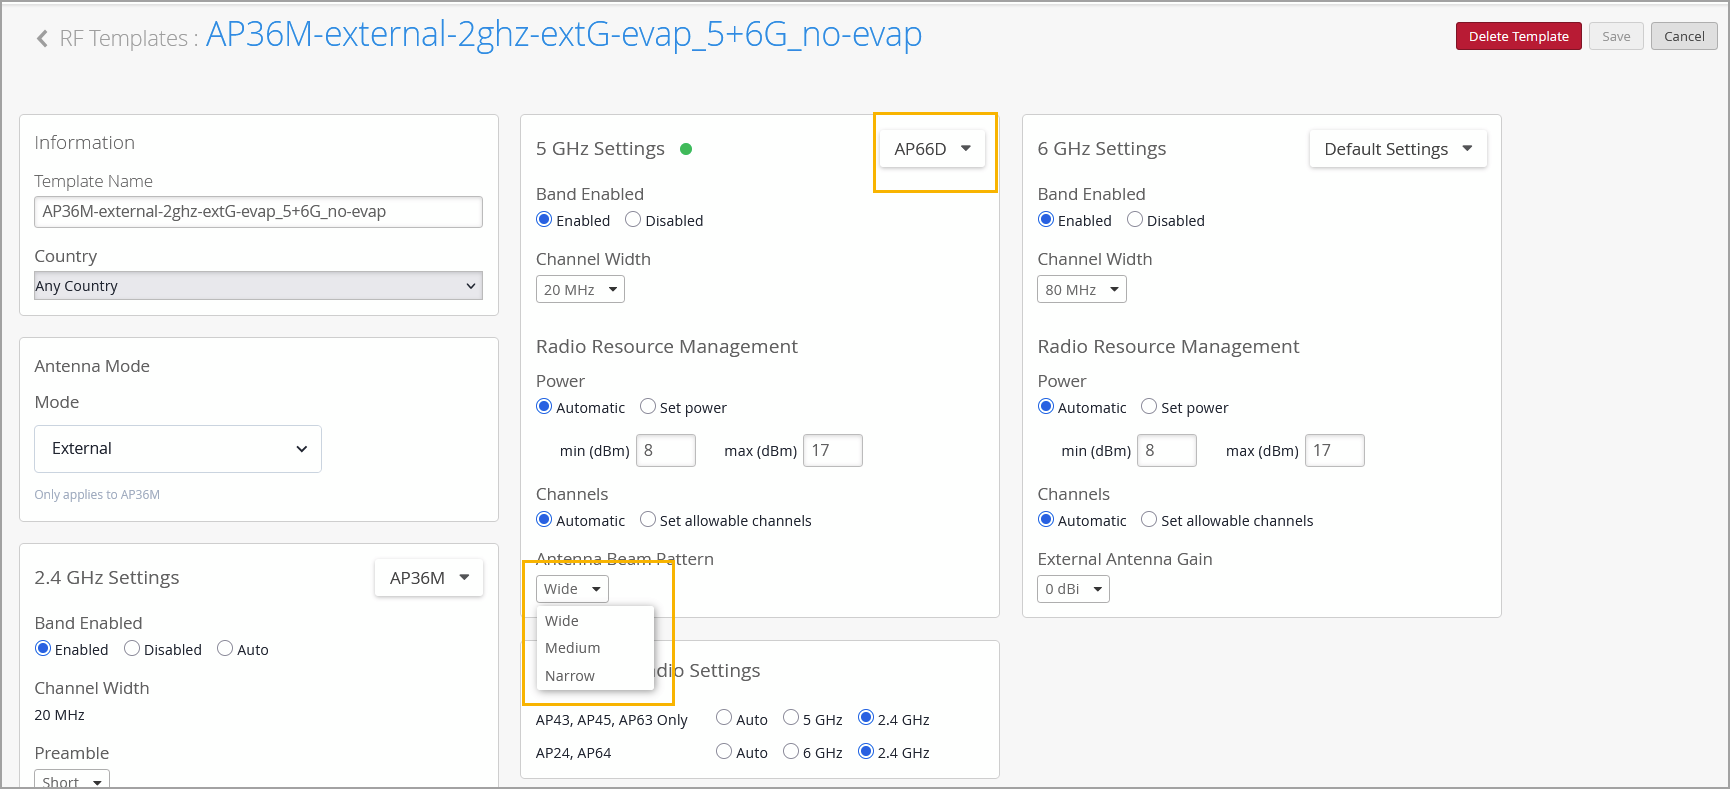
For more information, refer to RF Template Configuration.
For AP36M access points (APs), you can now select the antenna modes you want, Internal or External, in the Mist dashboard RF Templates (Organization > RF Templates). Internal antennas are best in deployments where omni-coverage from the AP’s mounting location is sufficient and installation simplicity is a priority, such as offices, classrooms, and open areas. External antennas provide more options in challenging deployments, such as long corridors, high-ceiling venues, and areas that require directional or specialized antennas.
Note: Changing the antenna mode on AP36M requires an AP reboot, so you should plan to do your changes during a maintenance window.
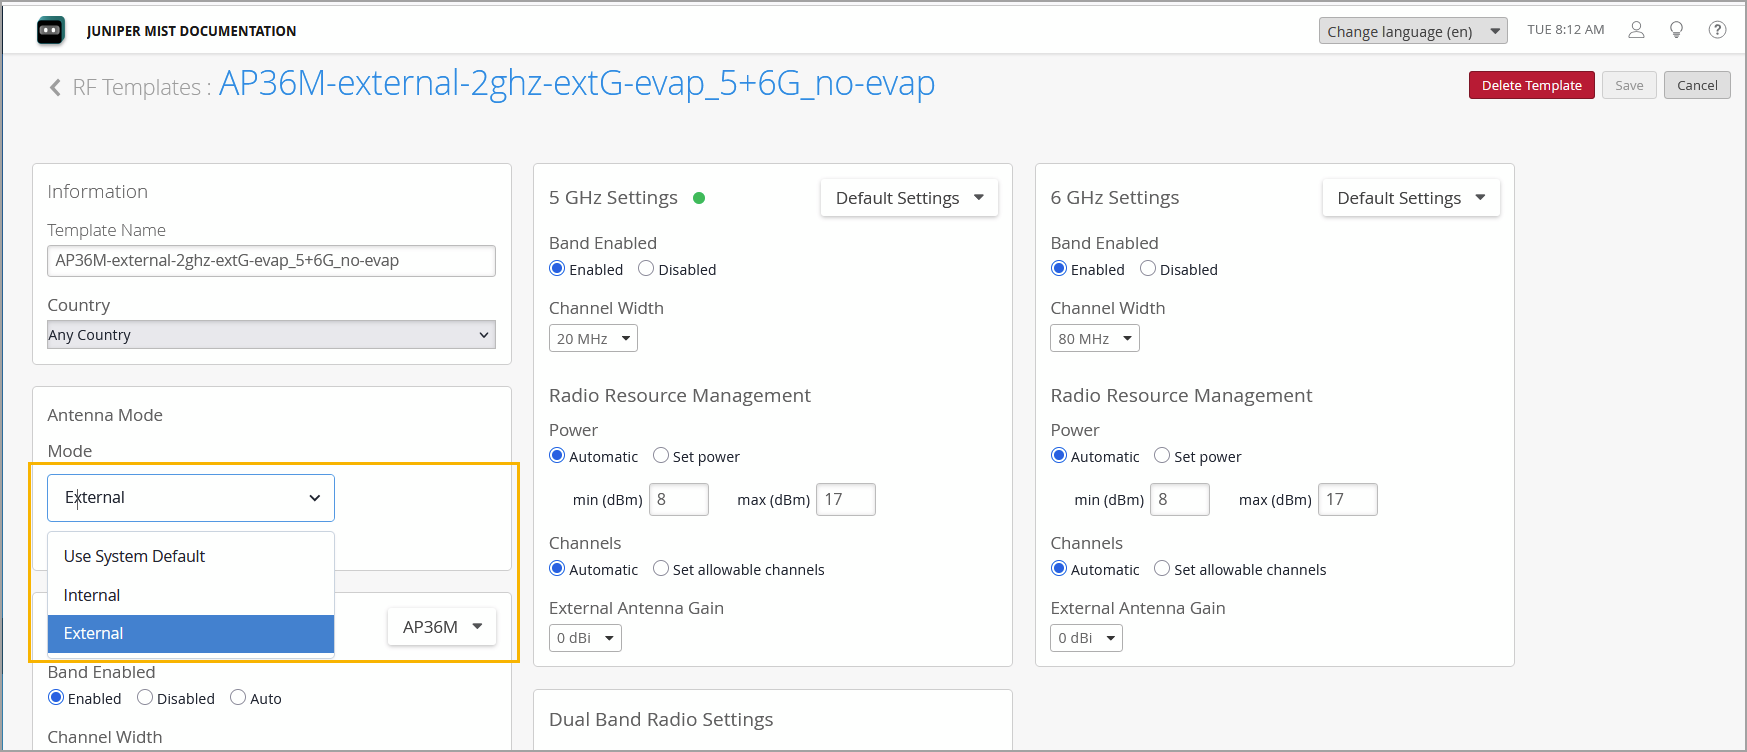
For more information, refer to RF Template Configuration.
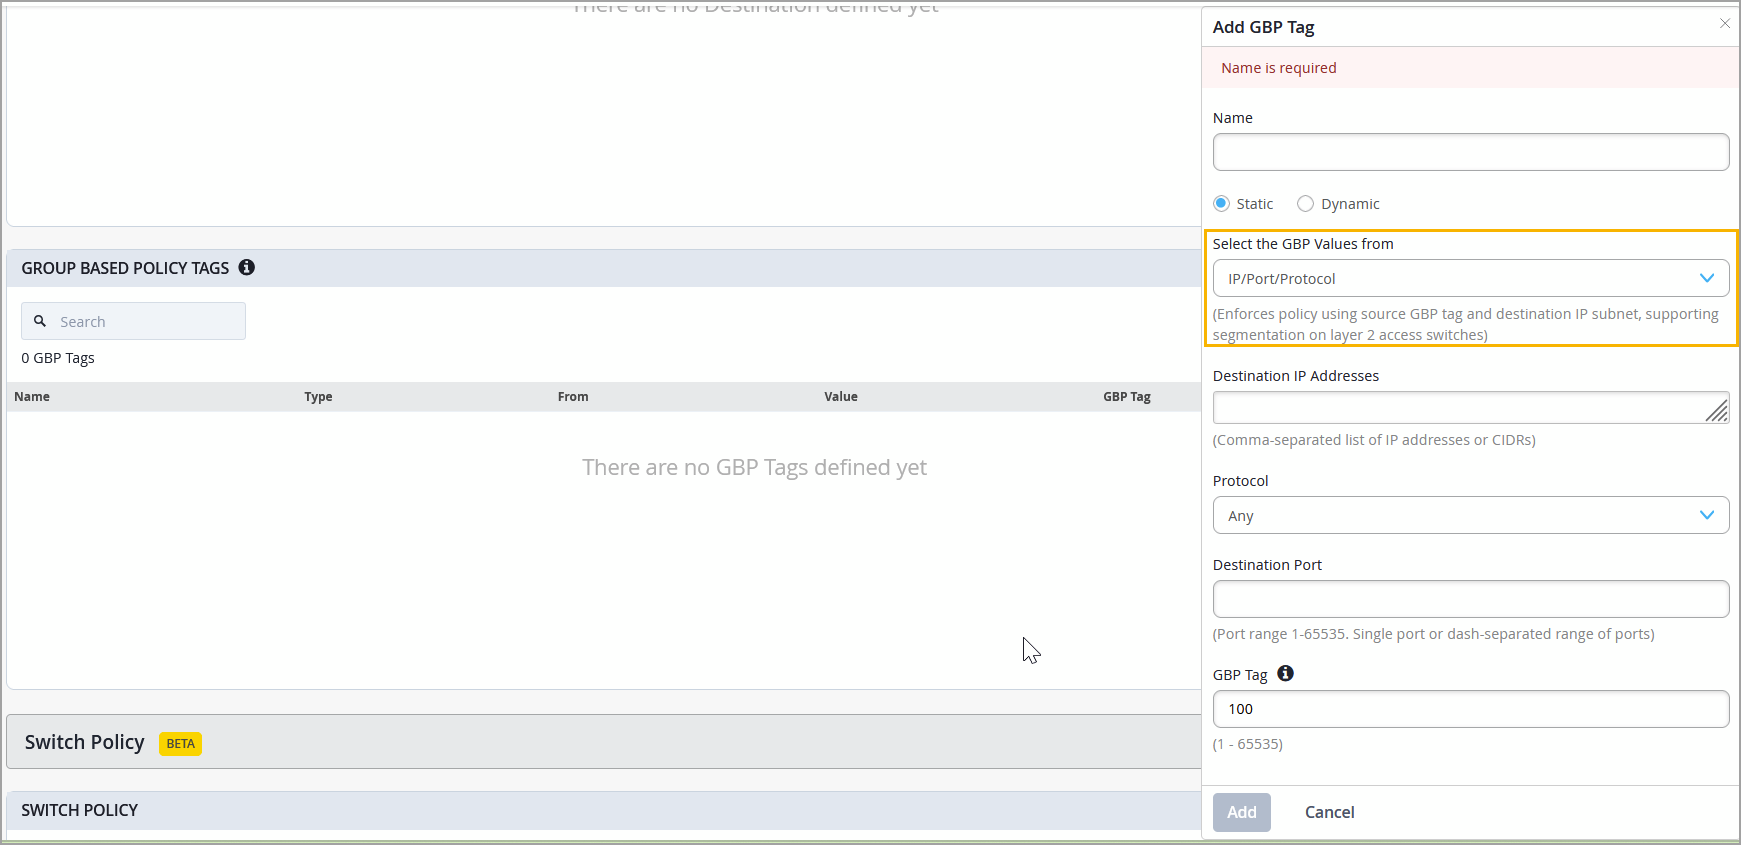
Mist now supports Zero Trust Inline Segmentation (ZTIS) which allows microsegmentation even in simple branch deployments without requiring an EVPN fabric.
Traditionally, micro segmentation has been exercised in the campus fabric IP Clos deployments. ZTIS simplifies micro segmentation by enforcing security policies inline at the access layer in branch deployments, eliminating the requirement for L3 gateways at the access layer. It enables consistent, identity‑based segmentation across wired clients without the complexity of private VLANs, VXLAN group‑based policies, or EVPN fabric designs. It improves lateral threat protection by allowing granular control of traffic between clients and toward external networks.
ZTIS leverages a Group‑Based Policy (GBP) tag that uses IP, port, or protocol as match conditions. Policies are enforced using a source GBP tag and destination-based GBP tags within the same VLAN. ZTIS extends microsegmentation to traffic leaving the client VLAN by enforcing policies at the L2 access switches using source GBP tags with destination IP prefix and L4 port matching. You must apply ZTIS via switch templates (Organization > Switch Templates) for consistent and synchronized configuration across switches within a site.
Notes:
ZTIS enforcement is supported on EX4400,EX4100,EX4650 and QFX5120 switches running Junos OS 25.4R1‑S1 or later (or 24.4R2‑S3).
Virtual switches VMs , including vJunos‑Switch, do not support ZTIS enforcement.
For more information, refer to ZTIS Configuration and Testing Examples.
For EX4100, EX4400, EX4000, and EX4100‑H switches running Junos OS 25.4R1 or later, Mist now offers enhanced visibility into DDoS protocol‑violation events. The Switch Events section on the Switch Insights page now displays the top packet sources contributing to each DDoS protocol violation, enabling faster analysis and more effective troubleshooting. The packet source information includes:
Protocol—The protocol associated with the violation.
MAC Address—The MAC address of the packet source that triggered the event. You can click the MAC address to navigate to the affected client.
IP Address—The packet source’s IP address, when available.
Count—The number of packets observed from that source.
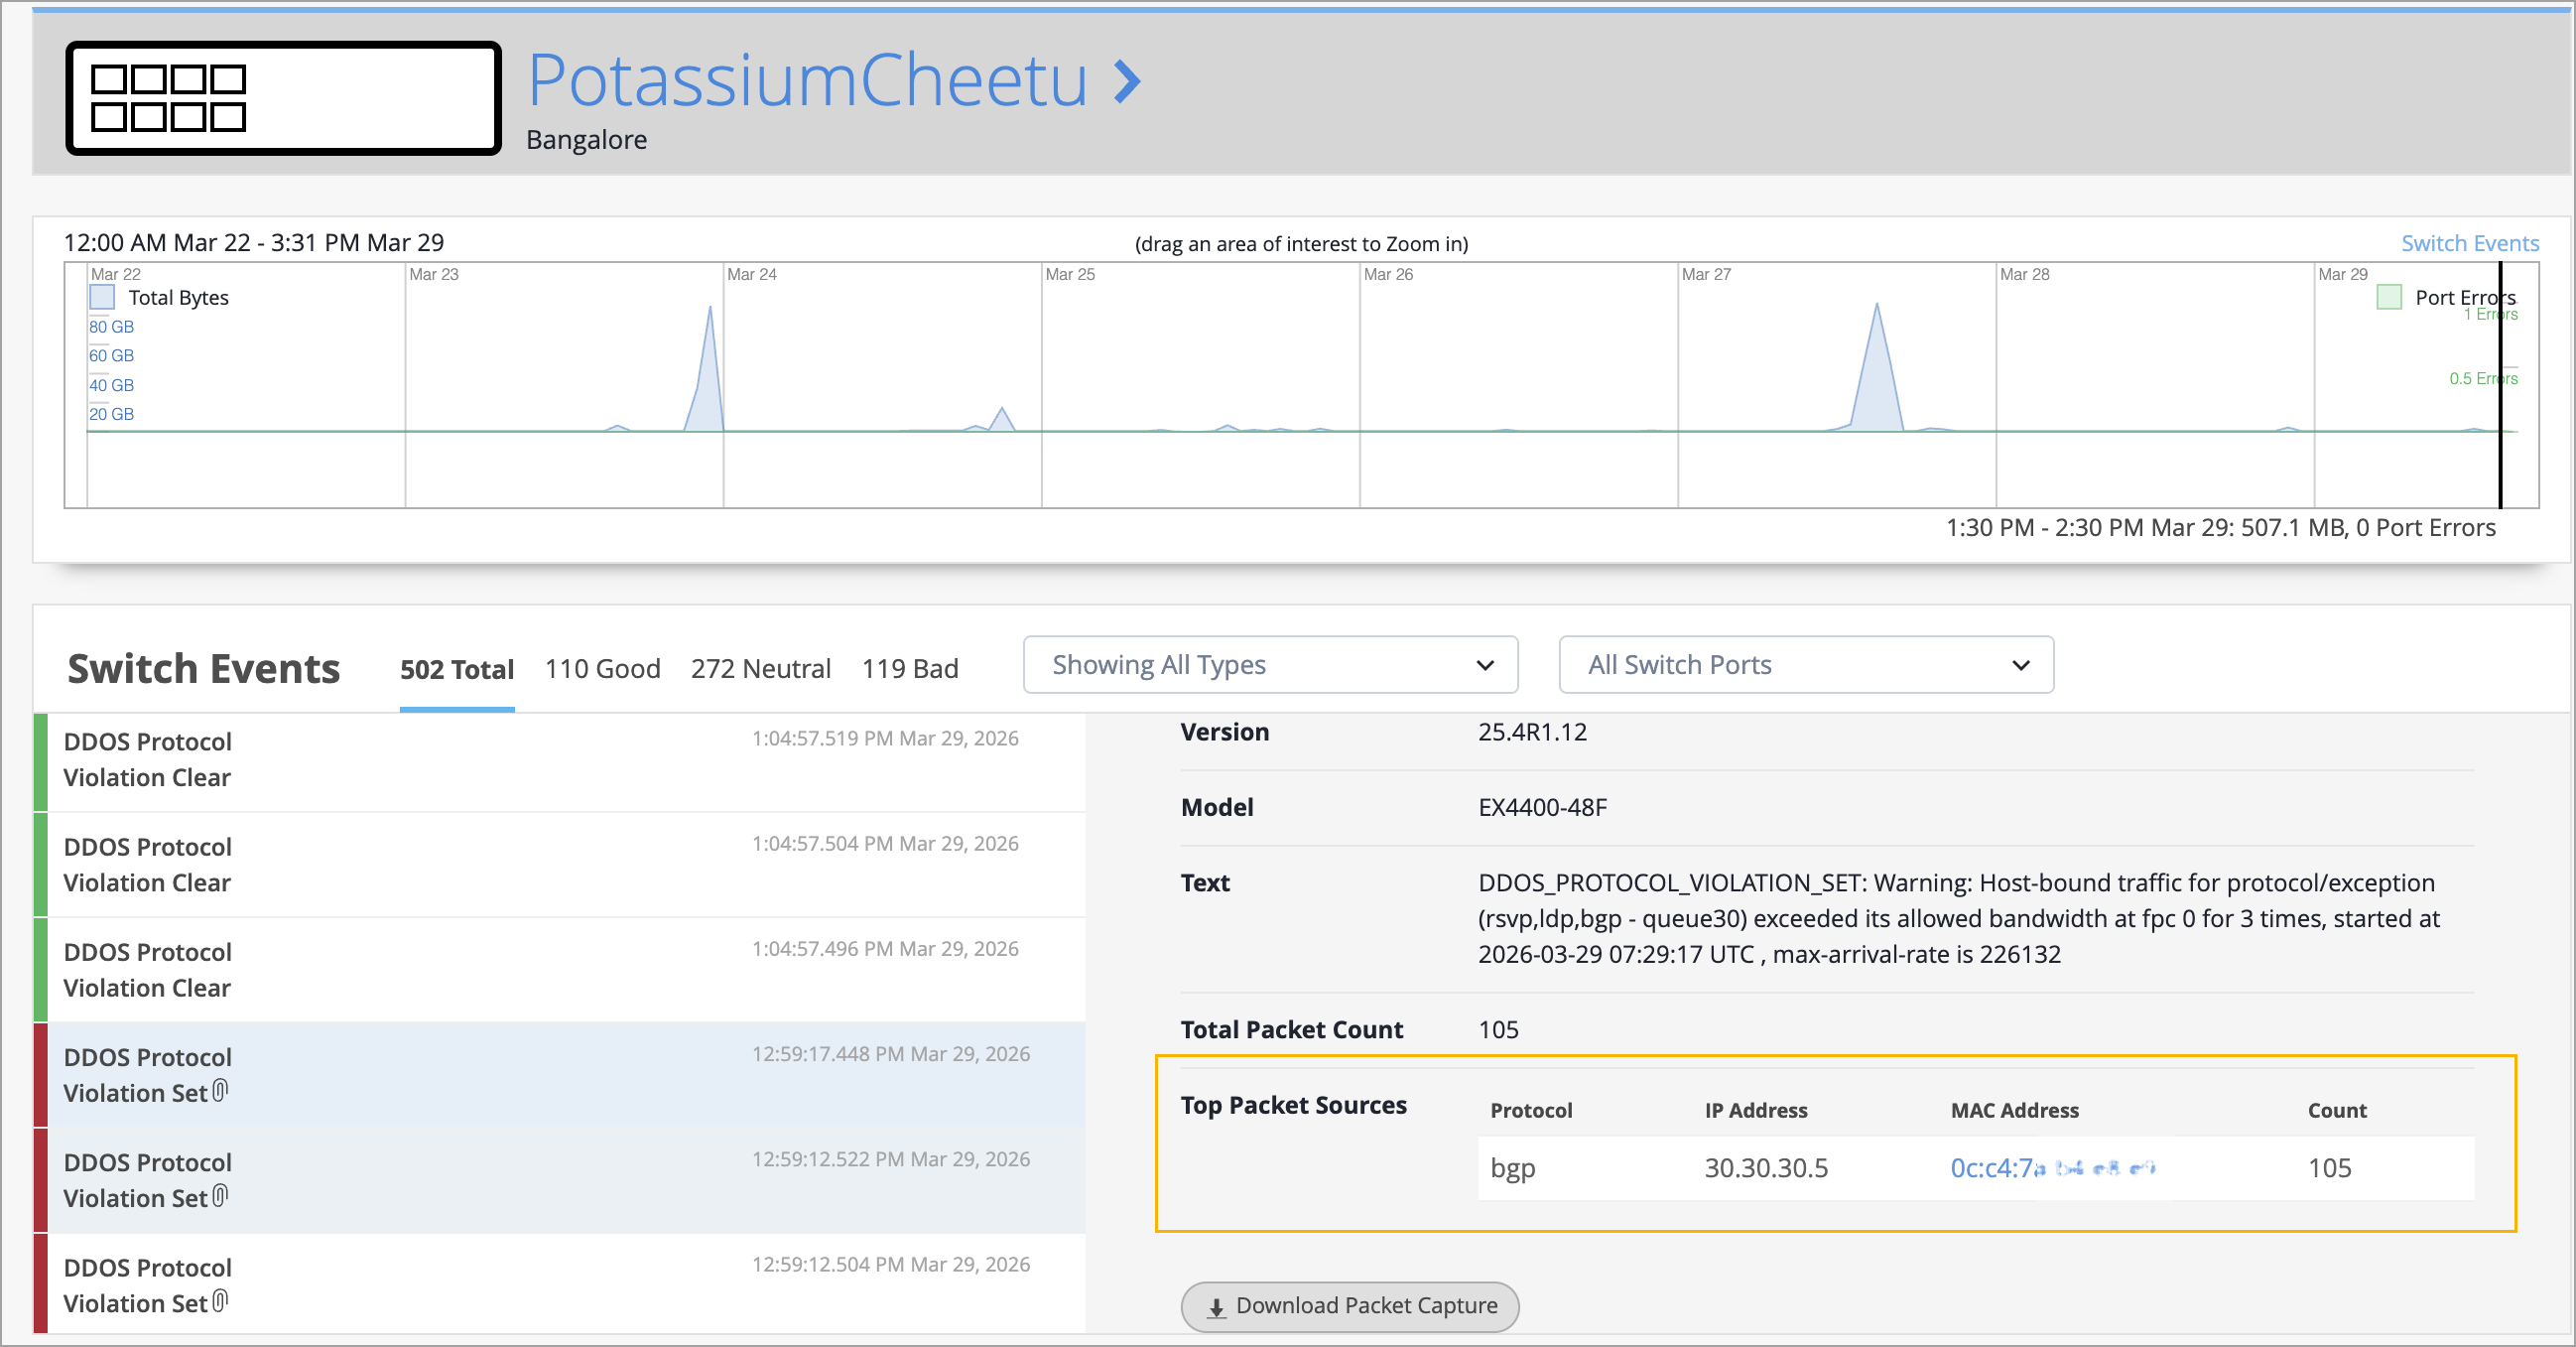
DDoS protocol‑violation events are triggered when host‑bound traffic for a specific protocol exceeds its configured bandwidth threshold. With the current enhancement, operators receive a clear, actionable list of top packet sources, along with one‑click navigation to affected clients, significantly improving the DDoS troubleshooting experience.
We have enhanced the switch policy configuration with the following options:
Clone—Lets you use the parameters (source and destination) of an existing policy to quickly create a new policy with a single click.
Clear Policy Counters—Lets you reset the policy hit count and start from a clean slate when diagnosing issues. After making configuration changes, you can reset the counters and observe only the new policy hits, making it easier to confirm whether a rule is still being triggered.
Note: This option is available only at the switch level (switch details).
Move Up/Move Down—Lets you reorder switch policies.
Enable or Disable—Lets you disable a policy without deleting it and re-enable it when needed.
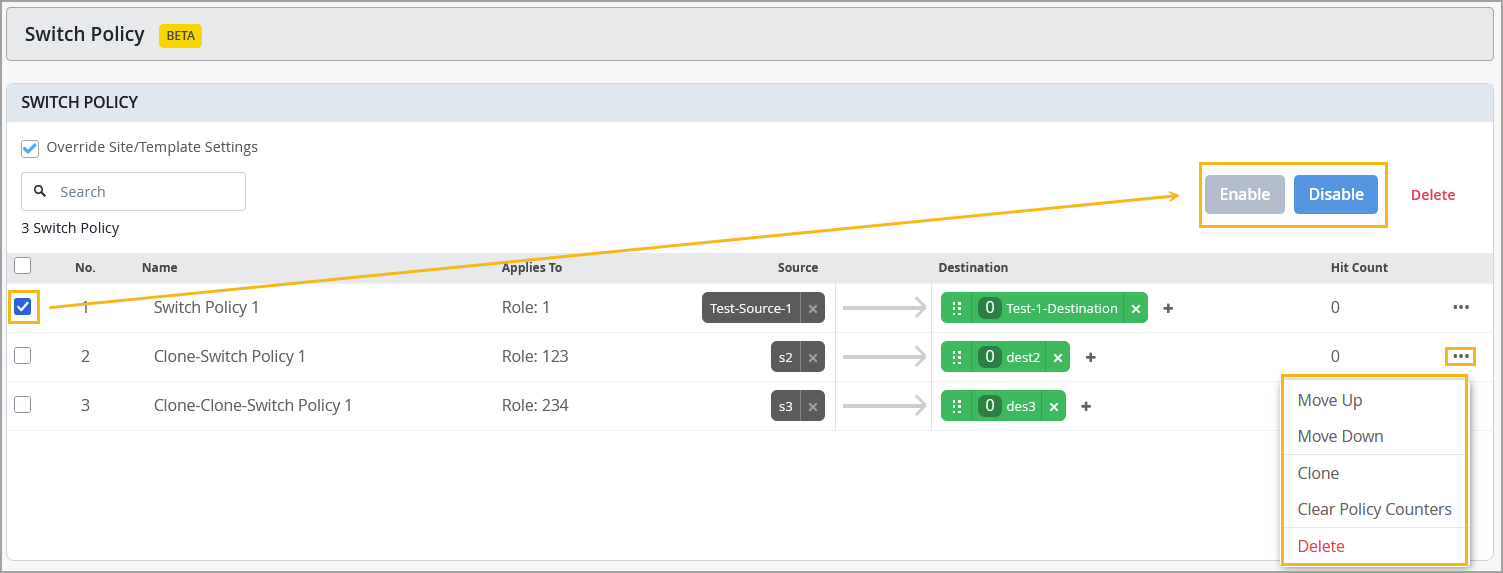
For more information on how to use these options, refer to Manage Switch Policies.
We have added the following new switch metrics to the Switches page:
Switchport Usage—This metric helps you quickly assess the availability of switch ports. This metric displays the percentage of ports that are currently in use. You can hover over the metric icon to view a breakdown of total, active, and inactive port counts. If the switch port usage is at 90 percent or higher, the metric icon turns red to indicate that the number of ports available for use is low. This metric is available in both the site-level and organization-level view of the Switches page.
Config Success—This metric shows the percentage of switches that are currently in a configuration success state, providing quick visibility into overall network health. If the success rate is below 100 percent, you can click the metric to view the switches that are in a configuration failed state, enabling faster troubleshooting. A switch is marked as configuration failed when its most recent configuration event (within the past 7 days) has failed. This metric is already available at the site level, and we are now adding it to the organization-level view.
Potential Anomalies—Shows percentage of devices with no anomalies detected, providing visibility into both actionable and early-warning signals of issues. If none of the devices have potential anomalies, the score is 100%. If the switches have potential anomalies, the value decreases in proportion to how many are affected. If the percentage is less than 100%, you can click the metric to view the switches with anomalies.
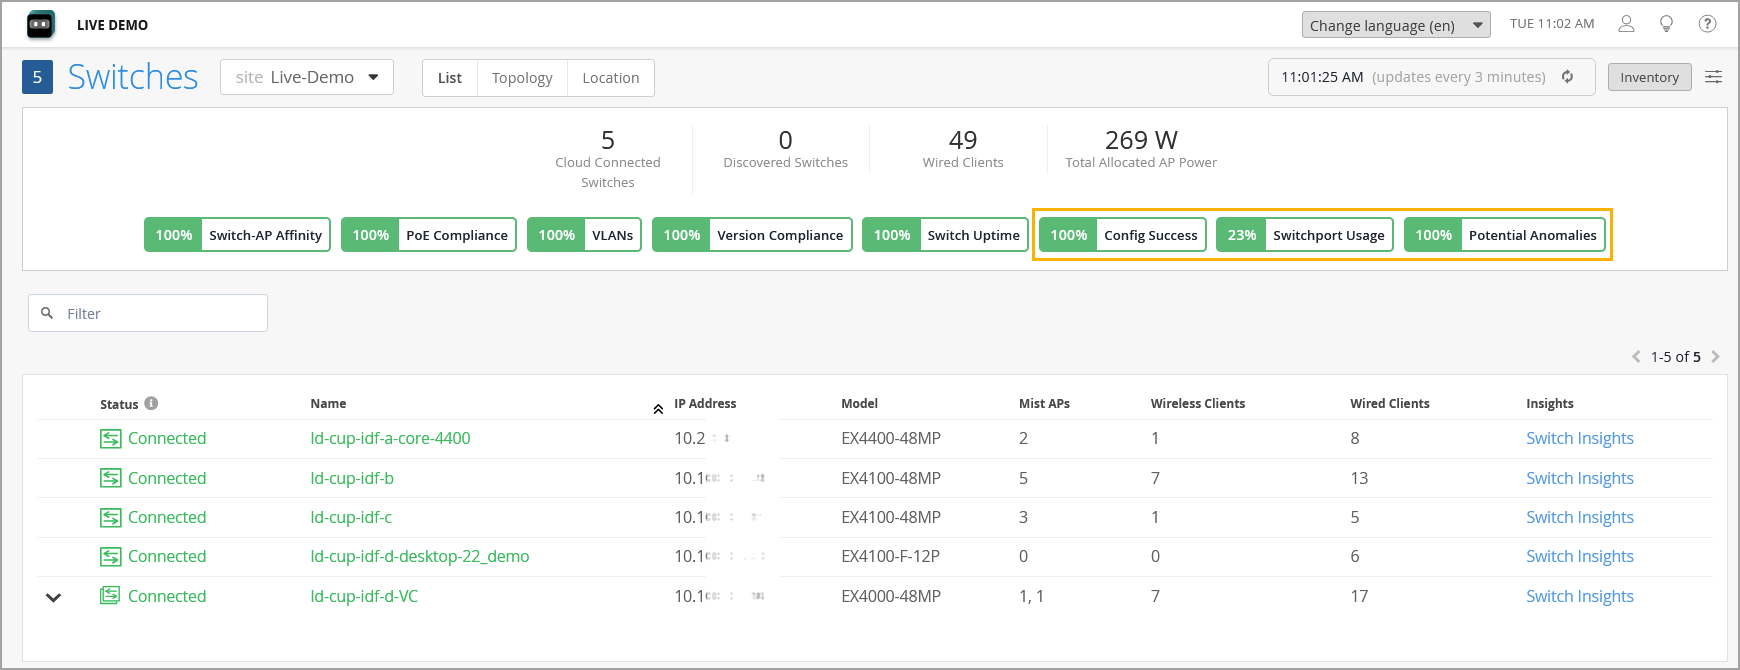
For more information, refer to Switch Metrics.
You can now configure a switch’s time zone using switch templates (at the organization or site level) or directly on an individual switch (at the switch level). This configuration is available under the Management section on the Switch Details page as well as within templates. This enhancement introduces the Use Site Timezone option, which allows you to configure a switch to automatically align its time zone with the site’s configured time zone.
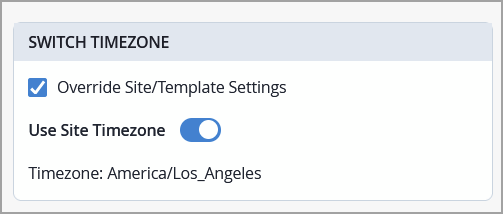
When this option is enabled and saved, the effective time zone is displayed on both the site and switch detail pages and is pushed to the device. If Use Site Timezone is disabled, the switch defaults to UTC. Note that the switch time zone configured via the additional CLI commands takes precedence over the time zone configured using the Use Site Timezone option.
To provide a more intuitive experience when working with site variable configuration, we have introduced the following enhancements:
VAR label next to supported fields—A VAR label now appears beside fields that support site variable configuration, making them easier to identify.
Autocomplete—When you begin typing a site variable value, the field now displays autocomplete suggestions in a drop‑down list.
Resolved values—For any field configured using site variables, the resolved value is displayed directly beneath it.
Warning about unresolved fields: If a site variable cannot resolve the configuration value, a warning message is displayed at the top of the configuration page.
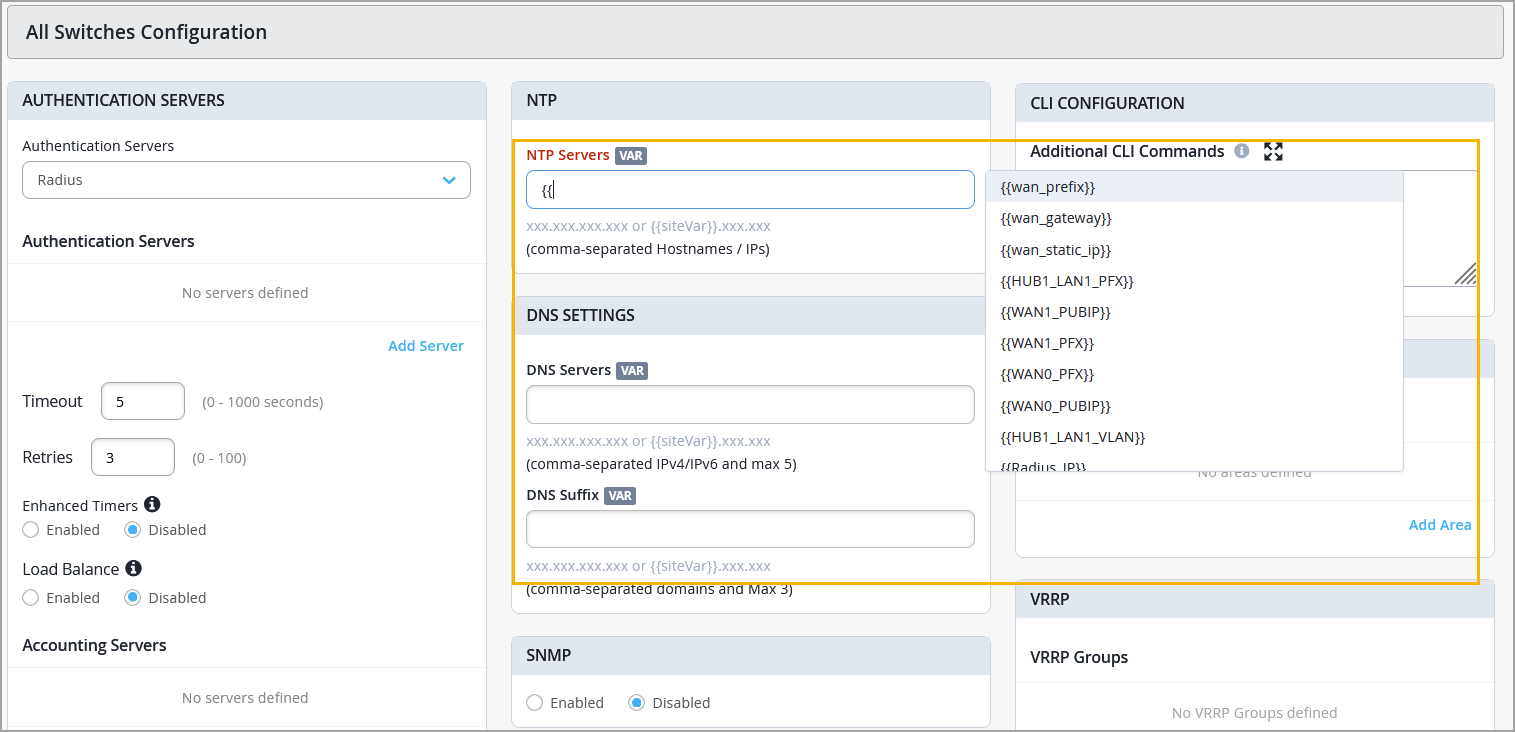
These fields already include help text that explains the site variable configuration format. With these new enhancements, configuring site variables is now simpler and more user‑friendly.
We have enhanced the switch Port List view to deliver a more informative viewing experience and deeper operational insights. The improvements include new columns in the Port List and Wired Clients views, refined table controls, and usability enhancements.
Updates to columns and table settings—The switch Port List view (in Switch Insights and Switch Details), as well as the Wired Clients view, now support additional configurable columns. You can enable or disable these columns using Table Settings:
VoIP Network—Shows the VoIP VLAN configured on the port profile bound to the port.
Note that this column is not applicable to the Wired Clients view.
VLAN (Assigned By RADIUS)—Shows the VLAN ID that the RADIUS server dynamically returned during the client authentication.
RADIUS Returned VoIP VLAN—Shows the VoIP VLAN that the RADIUS server dynamically returned for a wired client or port during authentication.
Dynamic Filter—Shows the name of a firewall filter (ACL) dynamically applied to the switch port during authentication. This filter is typically returned by the RADIUS server.
Auth Domain—Shows the authentication domain used for the client or port.
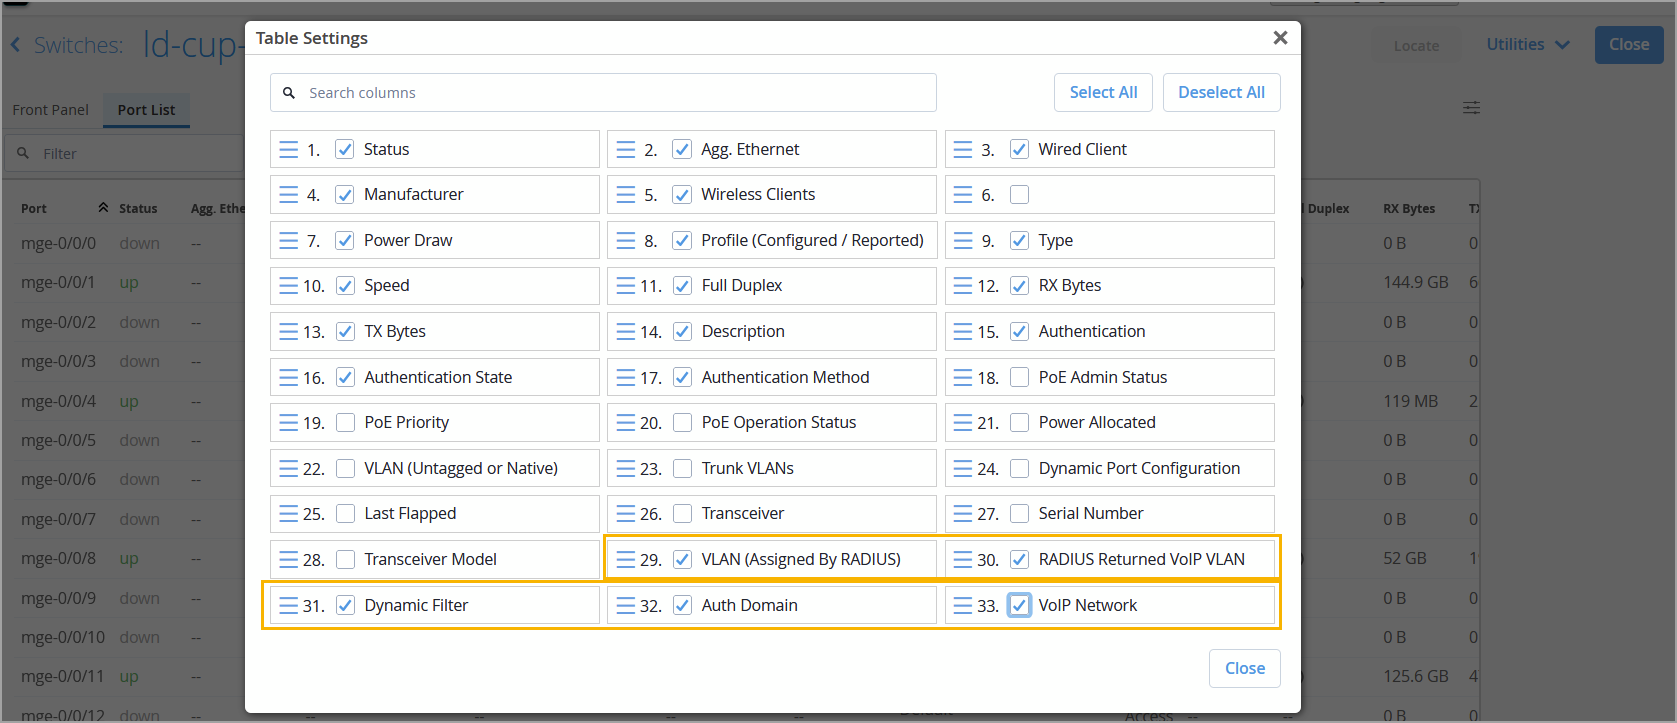
We have also removed the option to enable or disable the Port column from the table settings of the Port list view, as the Port is essential information in this view.
Locked header row and Port column—The column headers and the Port column in Port List now remain in place as you scroll up, down, or side to side, making it easier to interpret port data without losing context.
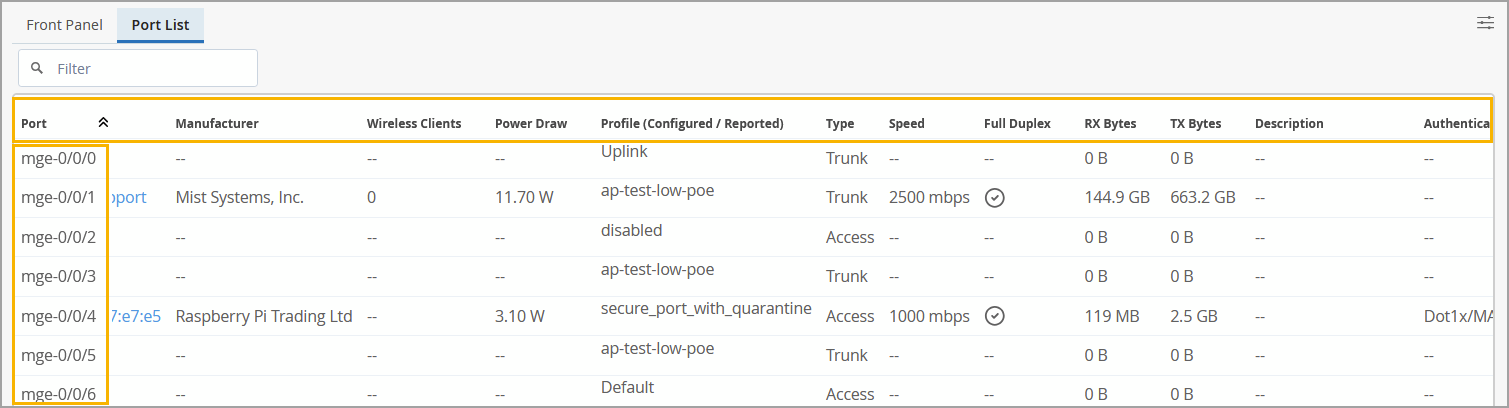
Larger viewing window—The Port List view now has a larger window than it did previously. This allows you to view a fuller list, while reducing the overall amount you may have to scroll.
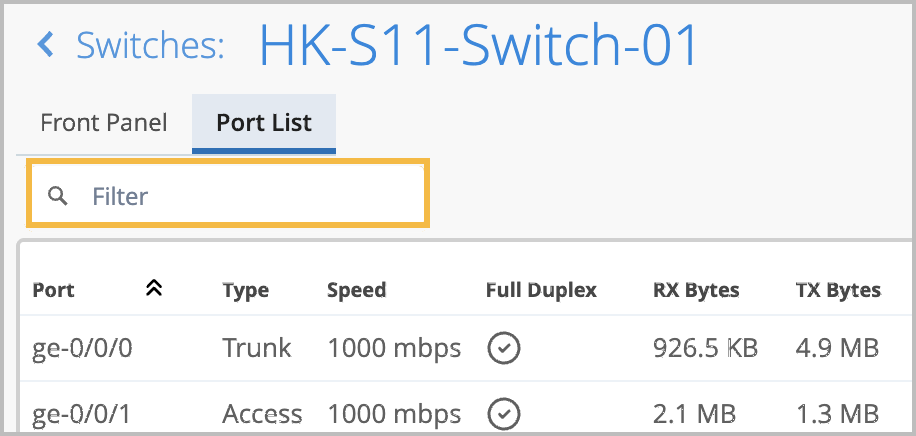
Filter option—A new Filter field in the Port List. You can use this search field to find any information regarding your switch ports, including information that is available in the additional columns in the Table Settings.
You can now configure bridge priority at the switch template (organization) level. This configuration can be overridden at both the site and device levels, providing additional flexibility.
To configure bridge priority at the switch template level, navigate to Organization > Switch Templates > Template Name, and scroll down to the Select Switches Configuration section. From there, open an existing rule or click Add Rule to create new rule. Then, go to the STP Bridge Priority tab, and select the desired Bridge Priority value.
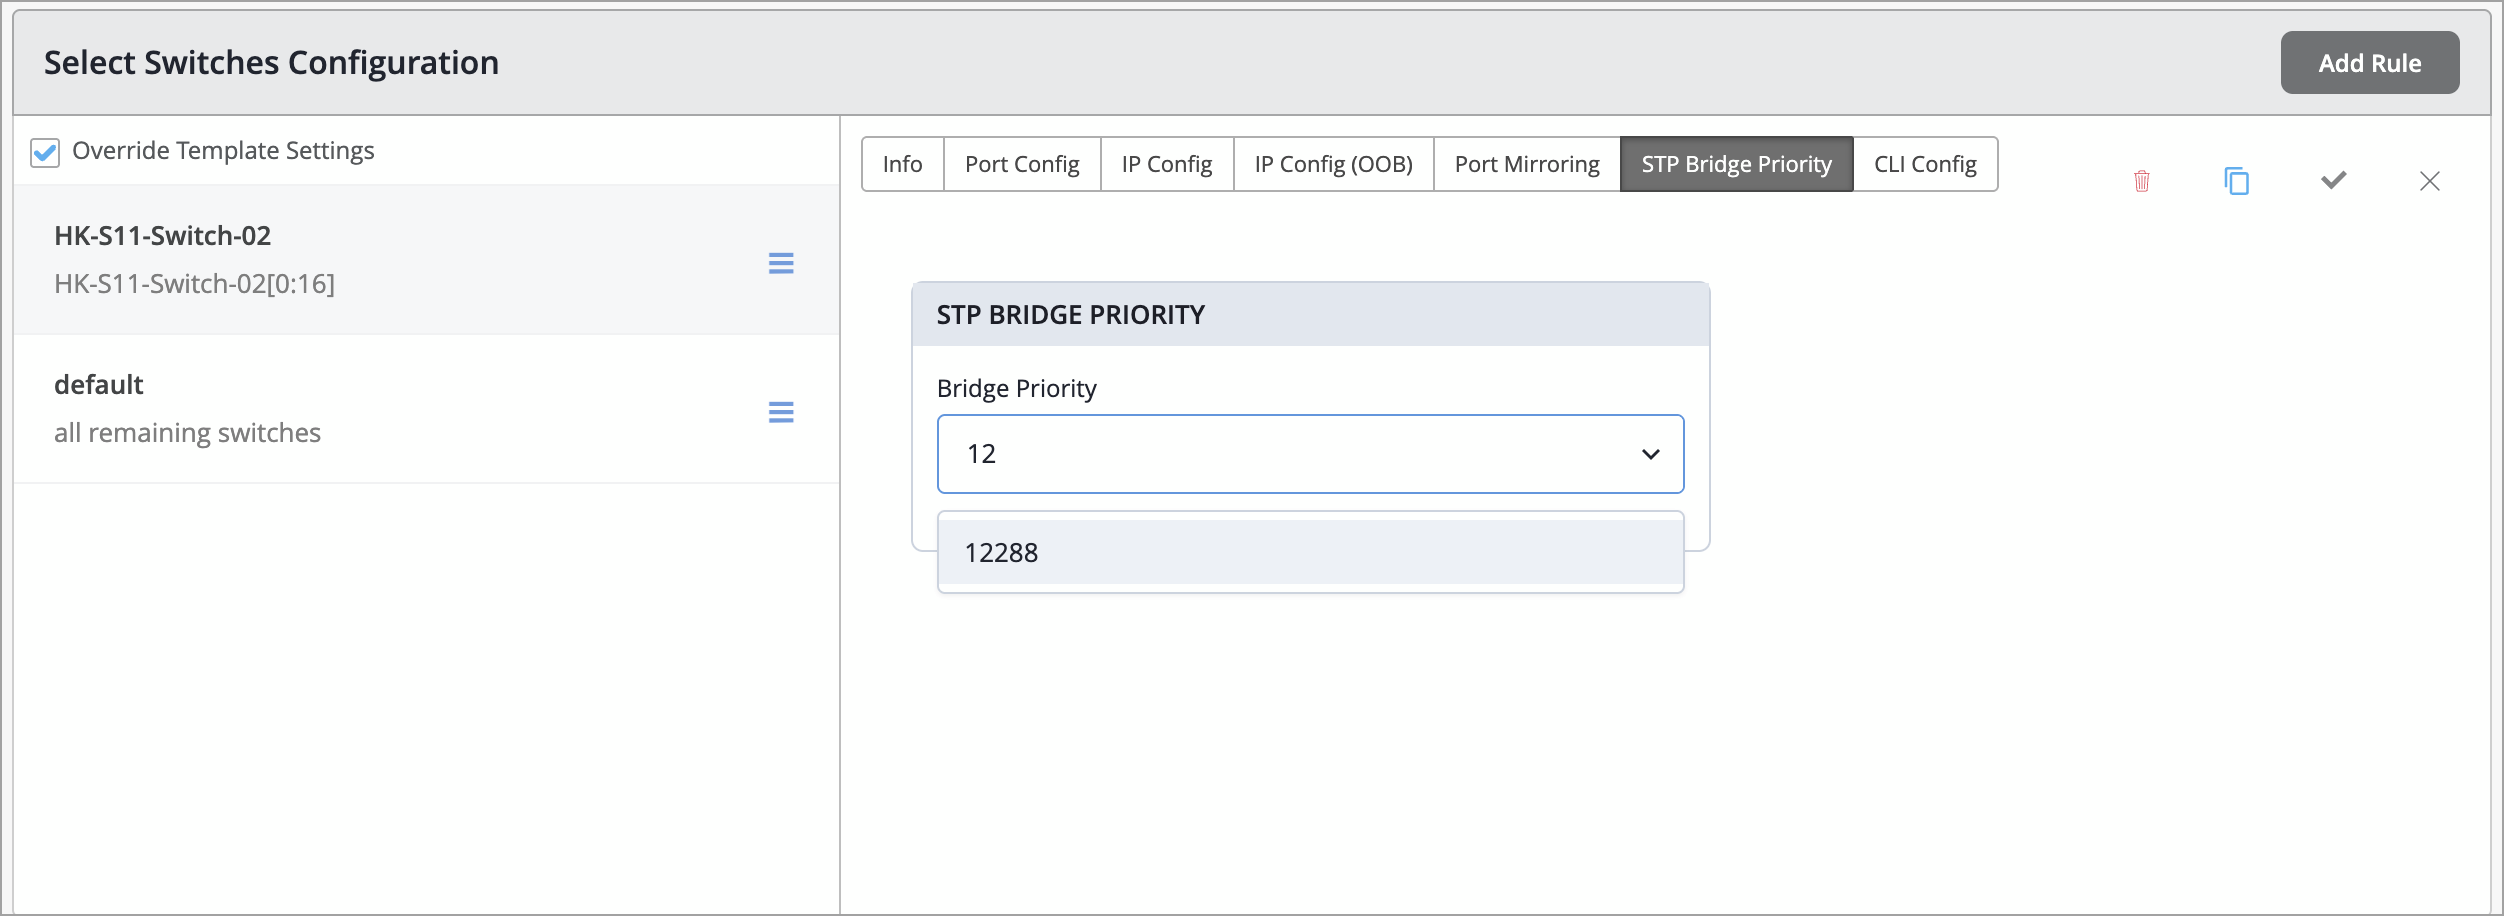
Note: Bridge priority that was configured using Additional CLI commands takes precedence over the value selected in the UI.
The WAN Topology Builder now supports hub and spoke topologies. This enhancement provides a single place to see all the configured Overlay Paths as well as customize Overlay Setting when required. A hub and spoke WAN topology is a design where hub sites act as the central aggregation points, while spoke sites connect primarily to the hub (rather than building tunnels to every other site).
The hub and spoke topology is created as a standardized OrgOverlay. Only one hub and spoke topology can exist per organization. If a hub and spoke topology already exists, such as for existing customers, Mist does not allow the creation of an additional one. To ensure consistency across site deployments, the topology name (OrgOverlay) is system-generated and cannot be customized. Within the topology, you can configure the following overlay parameters: Overlay IP subnet (SSR only), BGP AS, and IPv6 enablement (SSR only).
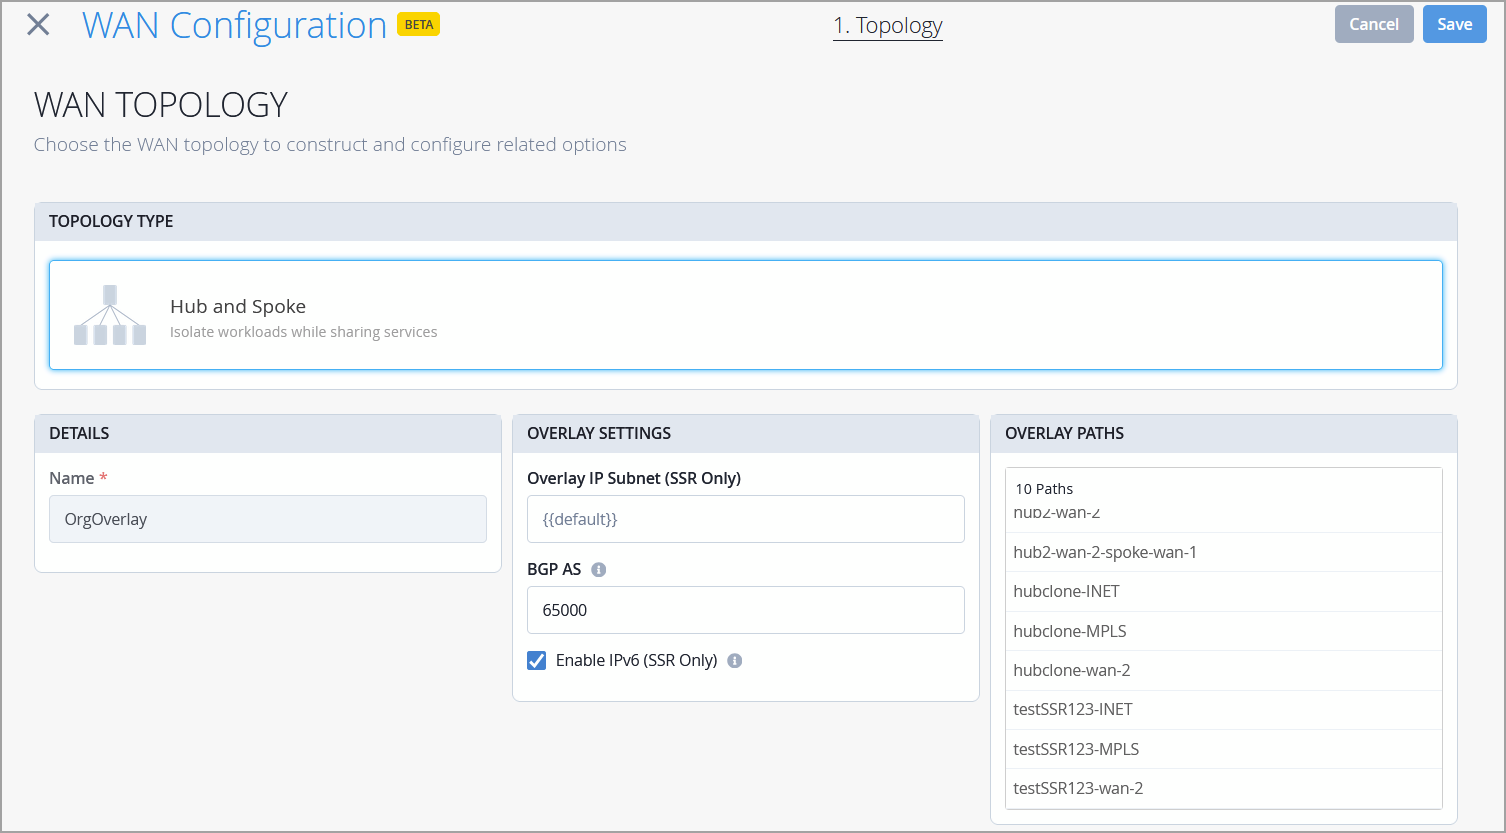
The BGP AS should be customized only when the default AS conflicts with your existing environment, or when additional considerations, such as overlapping AS numbers, require a different configuration.
We have enhanced the statistics view on the WAN Edge Insights page to make it easier to view and assess probe statistics. This update introduces a renaming of the section from Peer Path Stats to Probe Stats.
We have also added a new WAN Probes tab, where the jitter, loss, and latency data are presented in a time series format. This new tab features a dropdown menu, where you can select an interface to see probe stats for. The WAN Probes tab is now the default view of the Probe Stats section, making it easier to assess WAN probe health.
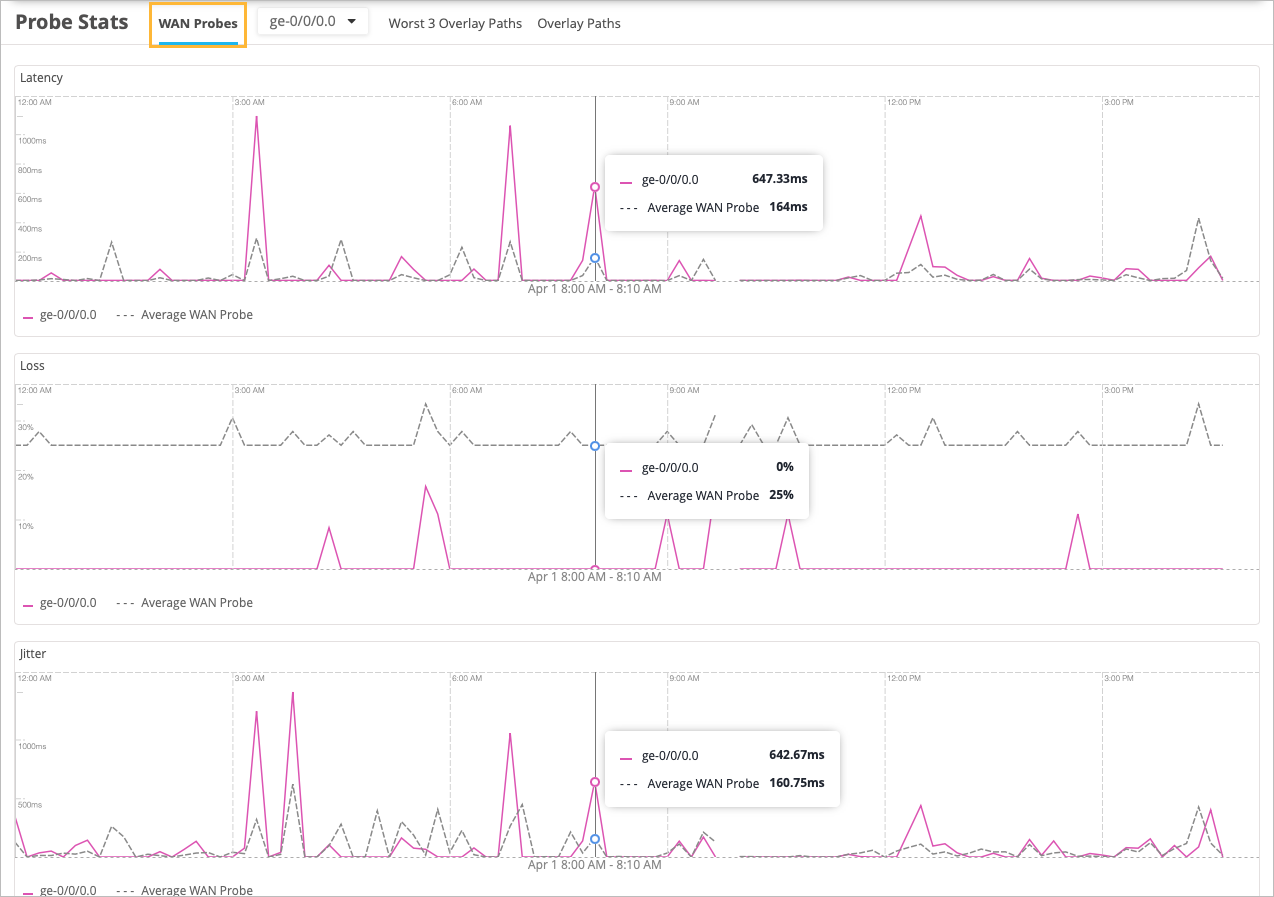
This update also introduces new naming to the pre-existing tabs:
Worst 3 Peer Paths tab has been renamed Worst 3 Overlay Paths.
Peer Paths tab has been renamed Overlay Paths.
These tabs still display the same data as they did previously, and you can drag your mouse across any of the graphs to get detailed data as before.
For information on how to configure real-time performance monitoring (RPM) probes for monitoring WAN link health, see Customizable IPv4 and IPv6 RPM probe configuration and WAN Settings.
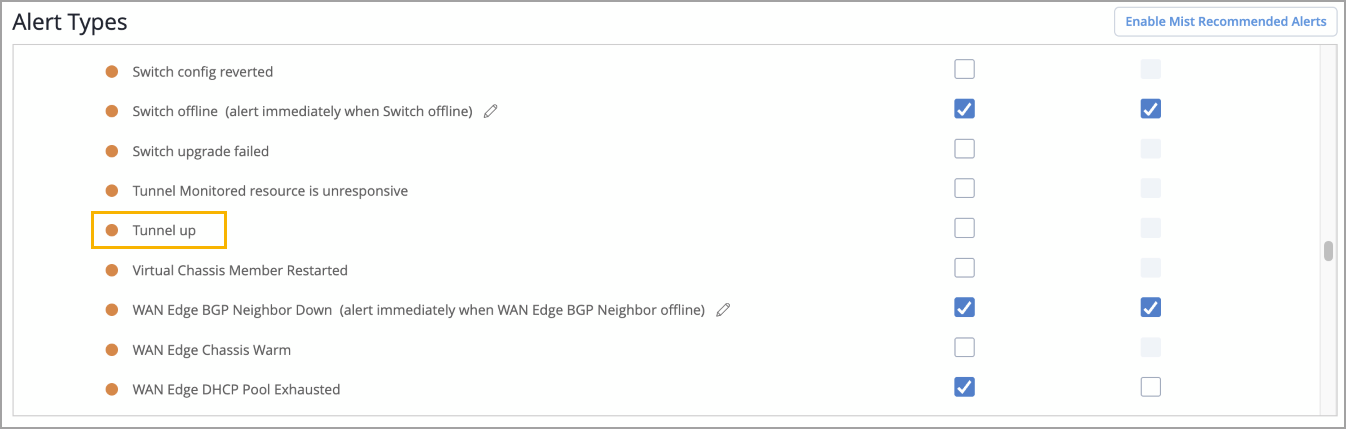
You can now configure Mist to alert users to an SRX or SSR IPsec VPN tunnel up event. You can configure the Tunnel Up alert from the Monitor > Alerts page. This alert gives operators a clear, time‑stamped confirmation that connectivity has been restored. Previously, the Alerts page only reported Tunnel Down conditions, while Tunnel Up was visible only as an event under Insights. This enhancement aligns outage and recovery visibility, improving troubleshooting, post‑incident verification, and operational auditing.
A new base OS version is now available for Mist Edge devices (except for the ME‑X5M and ME‑X10 models). As a result, most customers will begin seeing a ‘Firmware Upgrade Recommended’ notification for applicable Mist Edge devices.
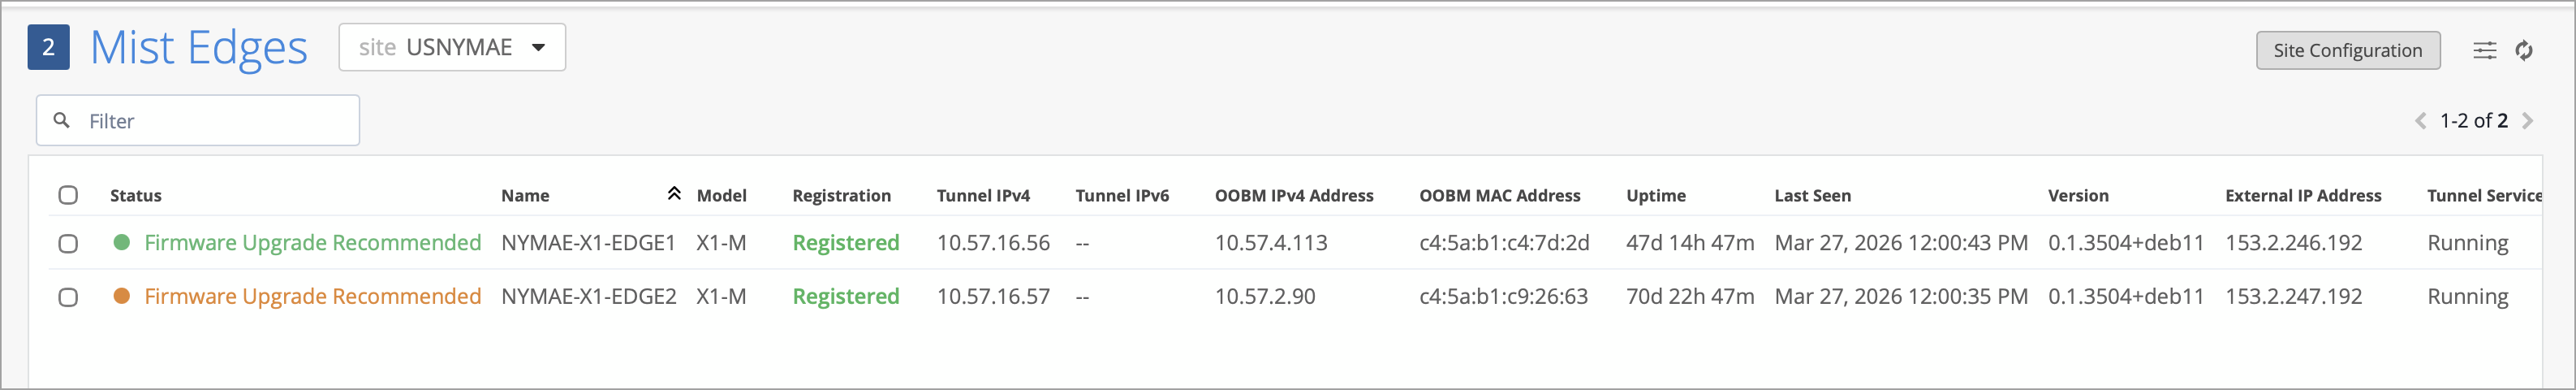
We have also enhanced the Mist Edge upgrade experience by separating the tunnel service upgrade from the base OS upgrade. This gives customers more flexibility: you may choose to remain on the current base OS and upgrade only the tunnel service (if an update is available), or you can upgrade both the base OS and the tunnel service together. The Upgrade Mist Edge page now includes a drop‑down menu that allows you to select one of the following options:
Upgrade Service—Upgrades only the tunnel service.
Upgrade Service and OS—Upgrades both the base OS and the tunnel service.

The Mist Edge upgrades are incremental. If your Mist Edge device has not been upgraded in the past two years, you may need to perform the upgrade sequence more than once.
Note: For a Mist Edge device that is functioning only as a proxy and doesn’t have an active tunnel service to upgrade, the option 'Upgrade Service and OS' is chosen by default; you cannot choose the upgrade type.