Potential Anomalies Detected by Marvis
Potential anomalies help identify user-impacting site-level and device-level operational issues.
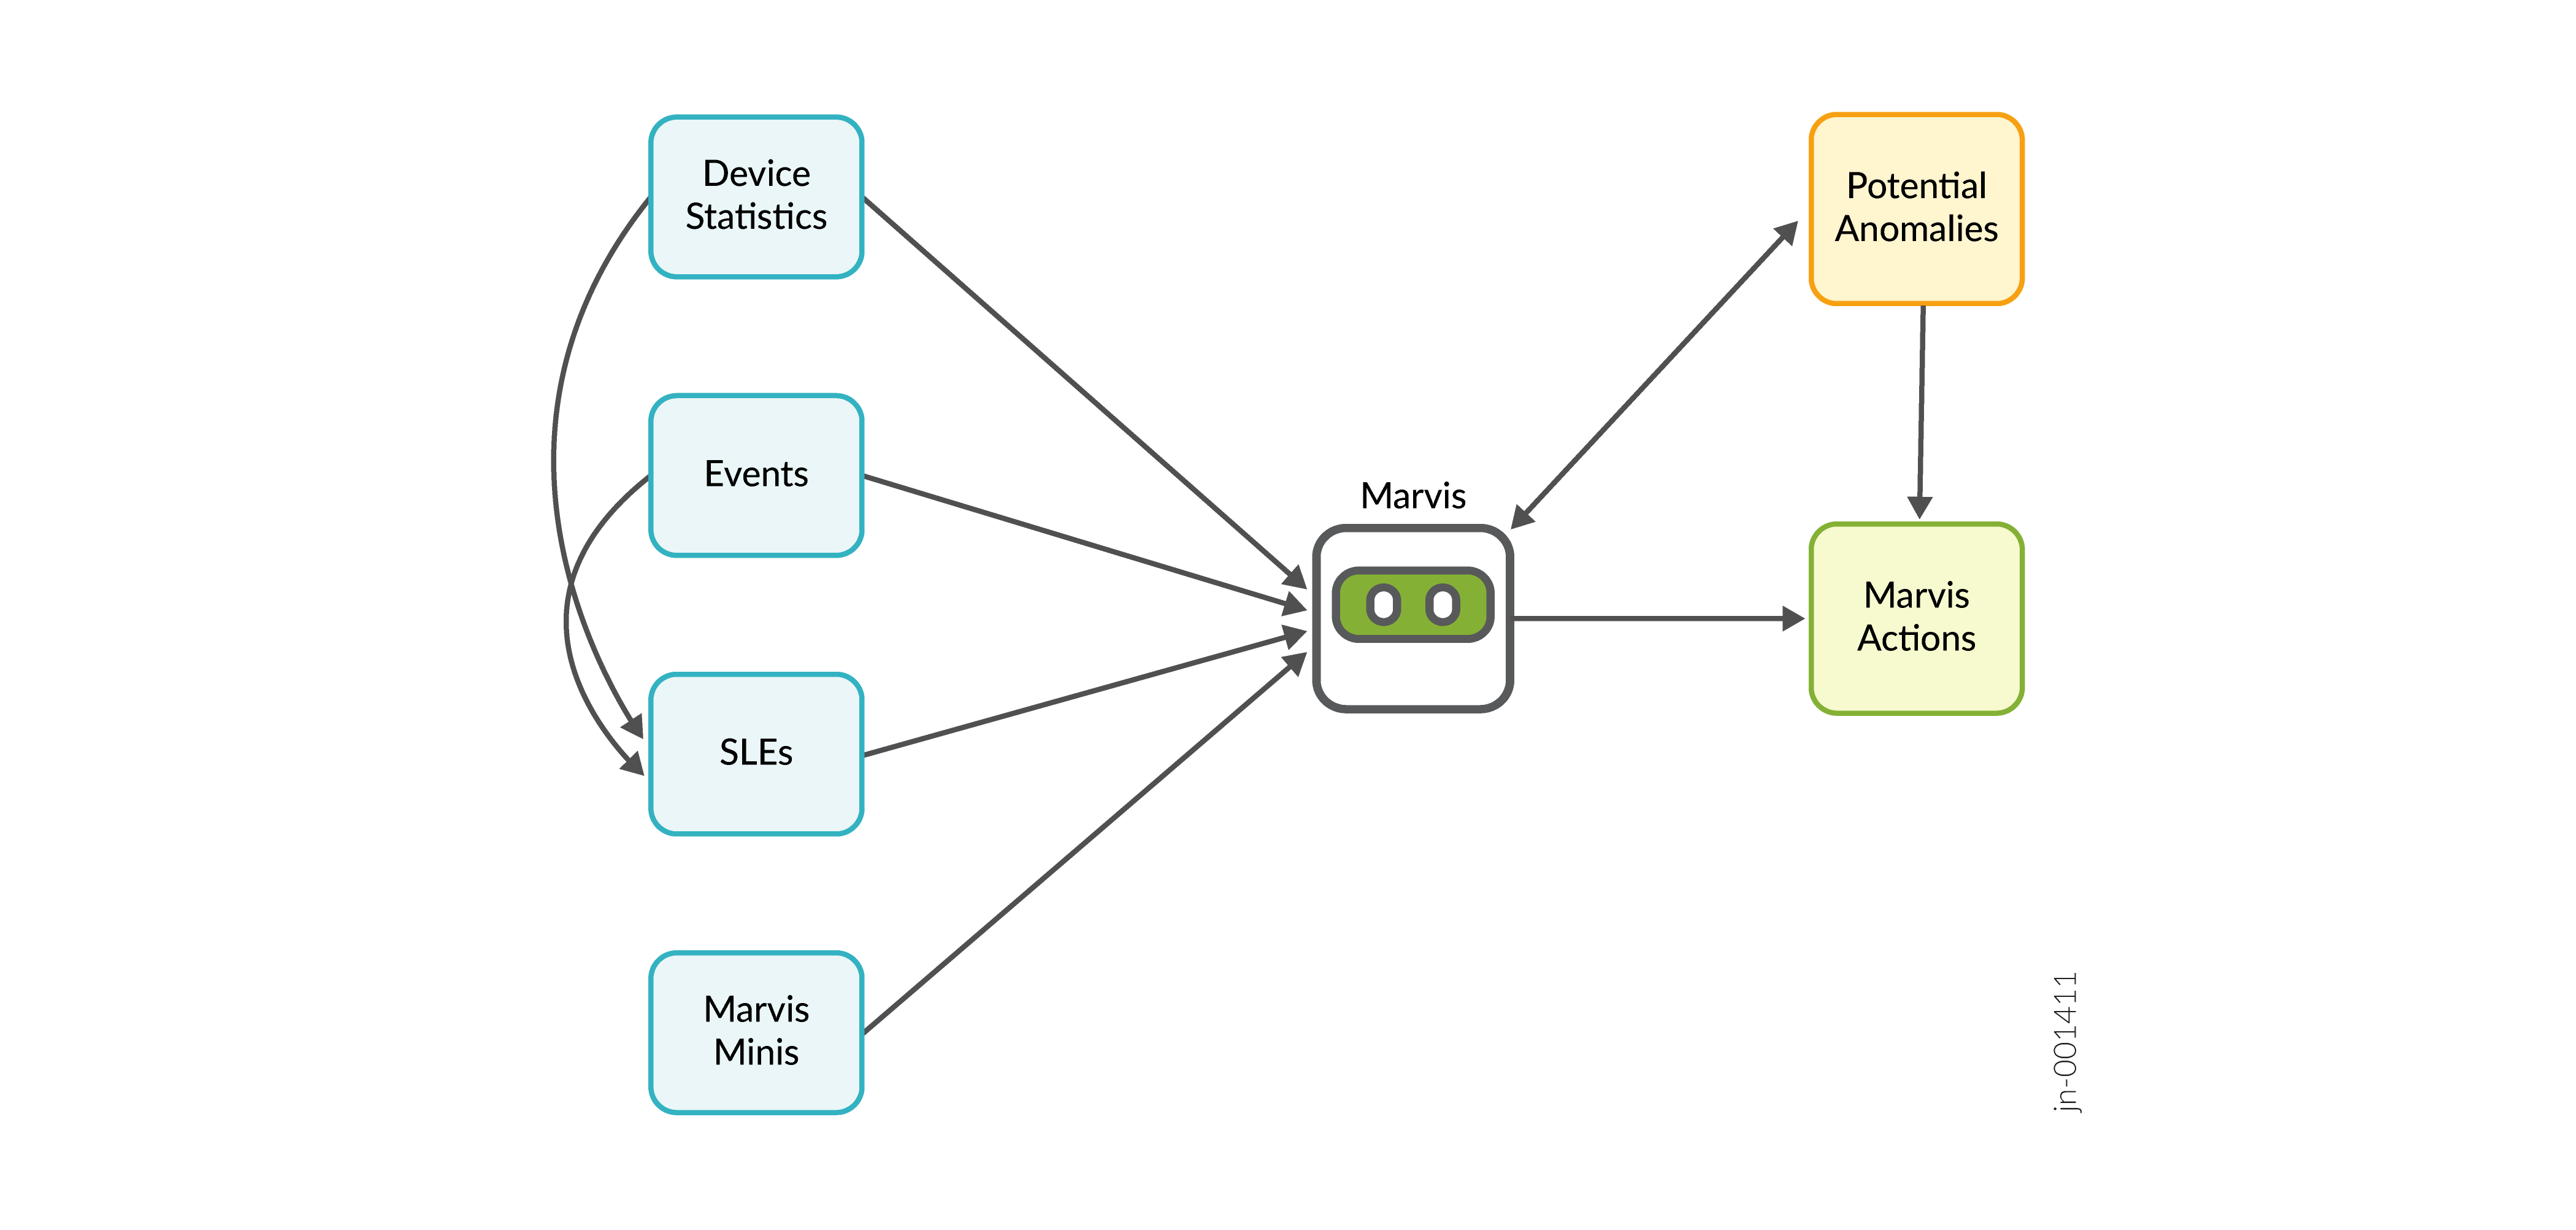
Marvis continuously monitors and analyzes data and events generated by APs, switches, and WAN Edges in real time. Marvis leverages information from device telemetry, system logs, and performance metrics to intelligently surface events that signal user-impacting issues across your network. These events are flagged as potential anomalies and are displayed on the Insights page in the Juniper Mist portal. For every potential anomaly detected, Marvis also provides a recommended remediation step that you can follow to resolve the issue.
Covering a wide range of issues ranging from hardware and connectivity issues to configuration inconsistencies and performance degradations, these anomalies can be at the site level (for example, DHCP failure) or device level (for example, device health). Marvis-highlighted anomalies are an indicator of issues that might translate into Marvis Actions.
The potential anomalies serve as early warning signals enabling administrators to take action before minor issues escalate into major disruptions. Network administrators gain precise, real-time visibility into where and why issues occur, resulting in a significant improvement in operational efficiency and reduction in troubleshooting effort and time.
Subscription Requirements
Similar to Marvis Actions, you can view the list of potential anomalies based on your subscription type—Marvis for Wired, Marvis for Wireless, and Marvis for WAN. For example, if you have a Marvis for Wired subscription, you can view only the switch-related anomalies.
However, you can view site-level potential anomalies such as DHCP, DNS, and ARP-related events even if you do not have a Marvis subscription.
List of Potential Anomalies for APs
You can view the anomalies detected for APs if you have a Marvis for Wireless subscription.
| Anomaly | Factors Triggering the Anomaly |
|---|---|
| Bad Cable |
Speed transitions, port errors, or frequent device restarts. |
| Missing VLAN |
AP unable to detect or operate on its assigned VLAN. This issue can be attributed mostly to one of the following:
|
| Ethernet Error |
Ethernet interfaces on the AP report generic errors such as CRC errors and input-output errors. |
|
AP Loop Detected |
AP detects a potential loop in the network topology. A loop can
be caused due to an incorrect configuration. Some common issues that
can cause loops are:
|
| Low Power |
AP receiving less PoE from the switch port. A common cause for this issue can be one of the following:
|
| Low Ethernet Speed |
The Ethernet port on the AP negotiates at a speed lower than expected (for example, 100 Mbps instead of 1 Gbps). The low speed can be due to one of the following:
|
List of Potential Anomalies for Switches
You can view the potential anomalies for switches if you have a Marvis for Wired subscription.
| Anomaly | Factors Triggering the Anomaly |
|---|---|
| Bad Cable |
Physical layer issues such as speed changes, errors reported on ports, and active switch port links not passing traffic. |
| Switch Health |
Switch health impacted by one of the following:
|
| Negotiation Mismatch |
Ethernet links with inconsistent settings across peers, such as MTU mismatches causing packet fragmentation or auto-negotiation failures leading to duplex mismatches. |
|
Switch STP Loop |
The Spanning Tree Protocol (STP) identifies a loop in the Layer 2 network, which might cause broadcast storms or connectivity issues. |
| DHCP Pool Exhausted |
The DHCP server associated with the switch runs out of IP addresses, preventing devices from obtaining IP addresses for network connectivity. |
List of Potential Anomalies for WAN Edges
You can view potential anomalies for WAN Edges if you have a Marvis for WAN subscription.
| Anomaly | Factors Triggering the Anomaly |
|---|---|
| Backup Firmware Invalid |
Missing backup firmware, difference in the active and backup firmware versions, or outdated firmware version. |
| Gateway Health |
A major WAN Edge subsystem experiences high load due to control plane CPU overload, high memory usage, or data plane CPU overload, potentially impacting routing, management, and packet forwarding. |
| Path Flap |
Network paths between the WAN Edge and upstream peers change frequently enough to be considered as instable rather than a failure. |
|
Port Flap |
An interface repeatedly switches to the Up or Down state over a monitored window, indicating cable issues, loose connections, or negotiation errors. |
| Bad Cable |
Physical layer issues such as speed changes and errors reported on ports. |
| Negotiation Mismatch | An MTU configuration mismatch between the WAN Edge and peer devices. MTU mismatches can cause packet fragmentation or packet drops. |
| Network Issue | The WAN Edge detects excessive packet loss, latency, jitter, or IPsec errors that might indicate tunnel instability. |
| HA Control Link Down | The High Availability control link between redundant WAN Edges is lost, preventing failover synchronization or role transitions. |
| LTE Signal | The LTE modem reports low signal quality, impacting cellular failover or primary transport. |
| ISP Reachability | The WAN Edge is unable to reach the ISP due to upstream service failures such as ARP resolution issues or DHCP IP configuration failures. |
| Congestion | High queue occupancy or output drops that indicate congestion on a WAN Edge interface. |
List of Potential Anomalies for Sites
You can view site-level pre-connect (DHCP, DNS, and ARP) anomalies even if you do not have a Marvis subscription.
| Anomaly | Factors Triggering the Anomaly |
|---|---|
| Failed Scope DNS/DHCP/ARP |
Site-level client connectivity failure due to DHCP, ARP, or DNS issues. |
| DNS/DHCP/ARP failures |
A sudden increase in DNS, DHCP, or ARP failure events, indicating potential user-impacting issues. |
View Potential Anomalies on the Insights Page
You can view the potential anomalies detected by Marvis under the Events section on the Potential Anomalies and Optimizations tab on the Monitor > Service Levels > Insights page.
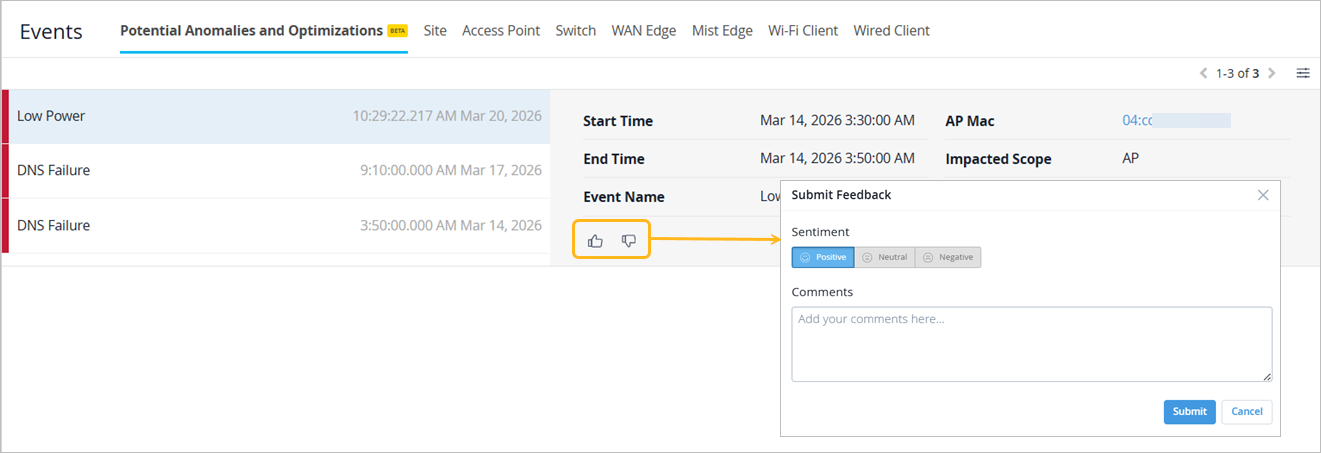
You can share feedback about potential anomalies using the thumbs-up or thumbs-down icon. Highlight any issues encountered, undetected anomalies, or incorrect information,
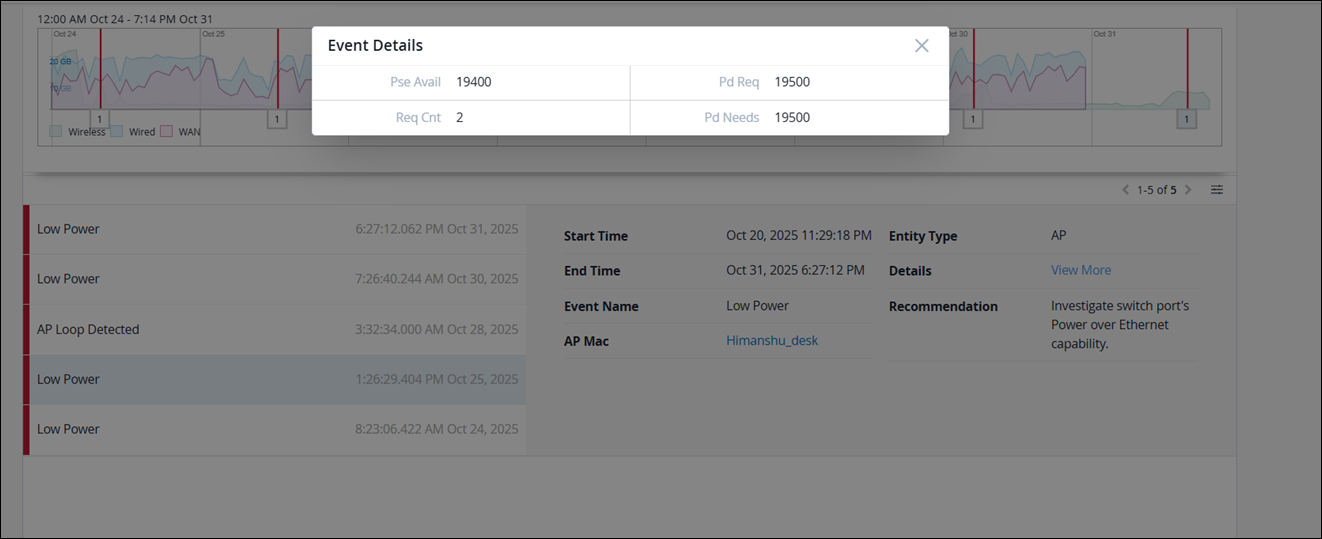
To view more details of an anomaly, you can click the View More link.