Help us improve your experience.
Let us know what you think.
Do you have time for a two-minute survey?
Help us improve your experience.
Let us know what you think.
Do you have time for a two-minute survey?
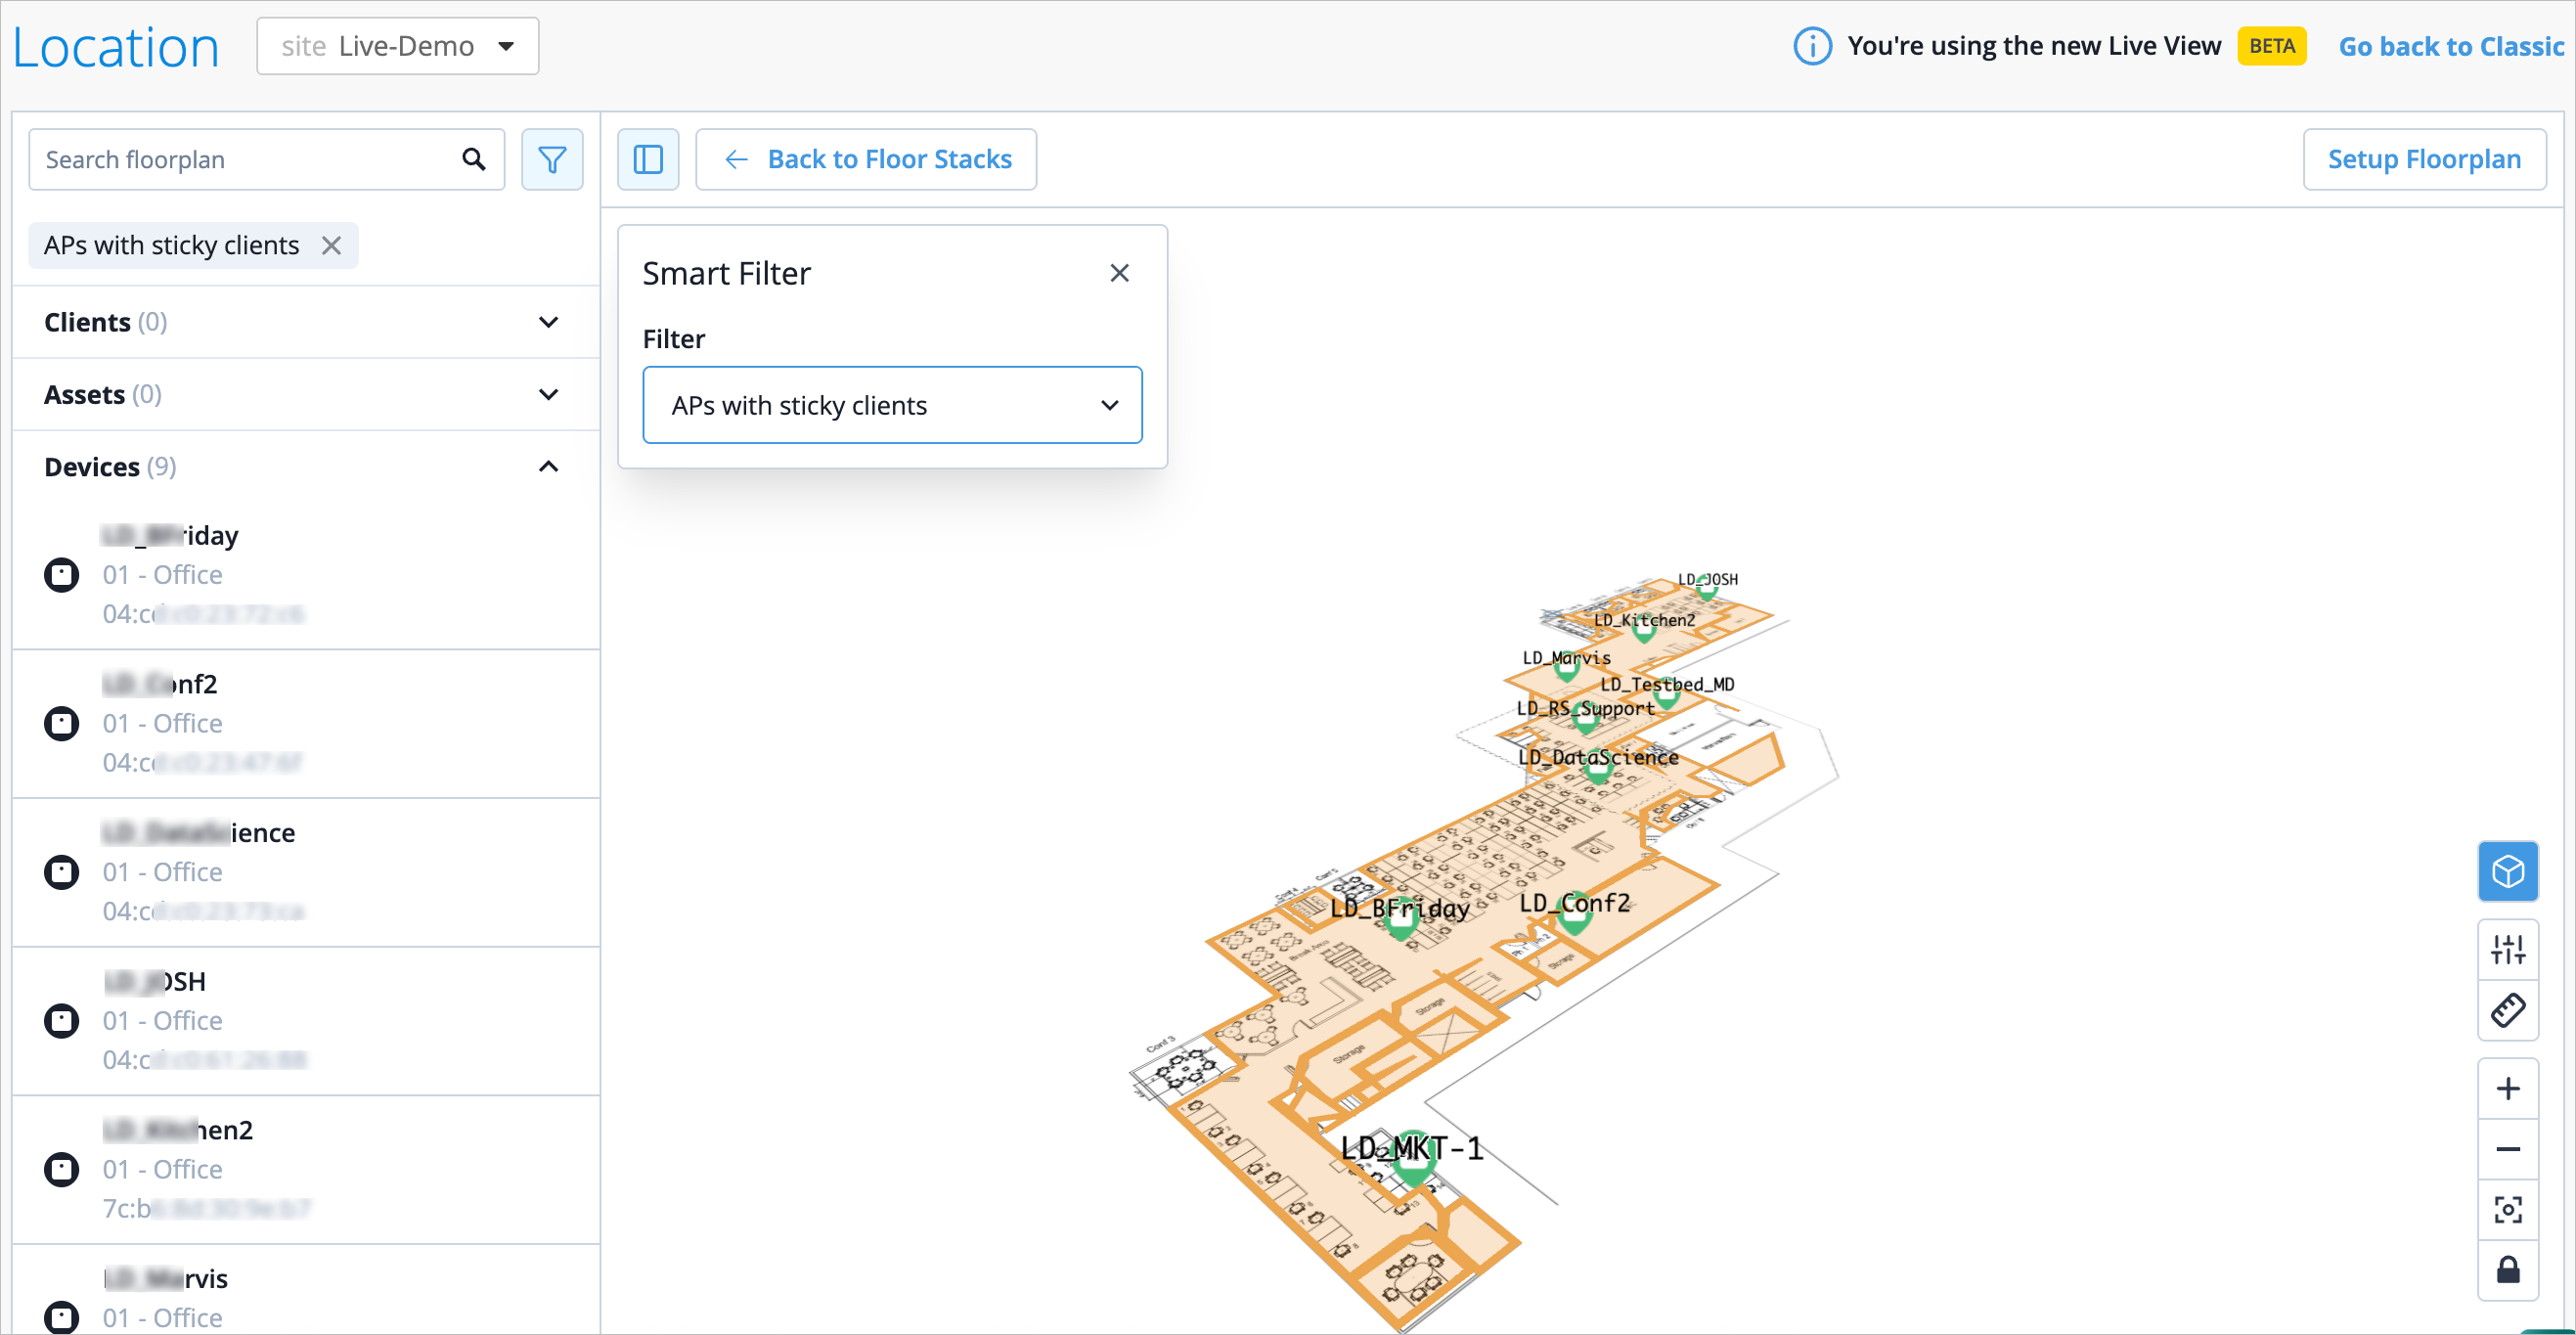
We are excited to unveil the redesigned Location Live View in Beta, built to deliver a modern, visually rich experience and streamlined navigation. The enhanced interface offers a more intuitive design alongside new interactive visalizations that let you explore floorplans in multi‑level floor stacks. To experience the new Live View, navigate to the Live View page (Location > Live View) and then click Try the new experience on the upper right of the page.
The updated Live View introduces smart filters, including insights into APs with high usage, low coverage, or sticky clients; clients with low signal strength; and poor Teams call quality—making it easier to quickly identify and troubleshoot issues. The following image shows a view filtered for APs with sticky clients.
We are excited to introduce the enhanced Org Insights dashboard. As announced in our September 2025 release note, Network Operation Center (NOC) users can use the Org Insights dashboard to access a single-pane-of-glass that displays any potential issues affecting the network.
You can access this page by navigating to Monitor > Service Levels > Insights, then select Entire Org.
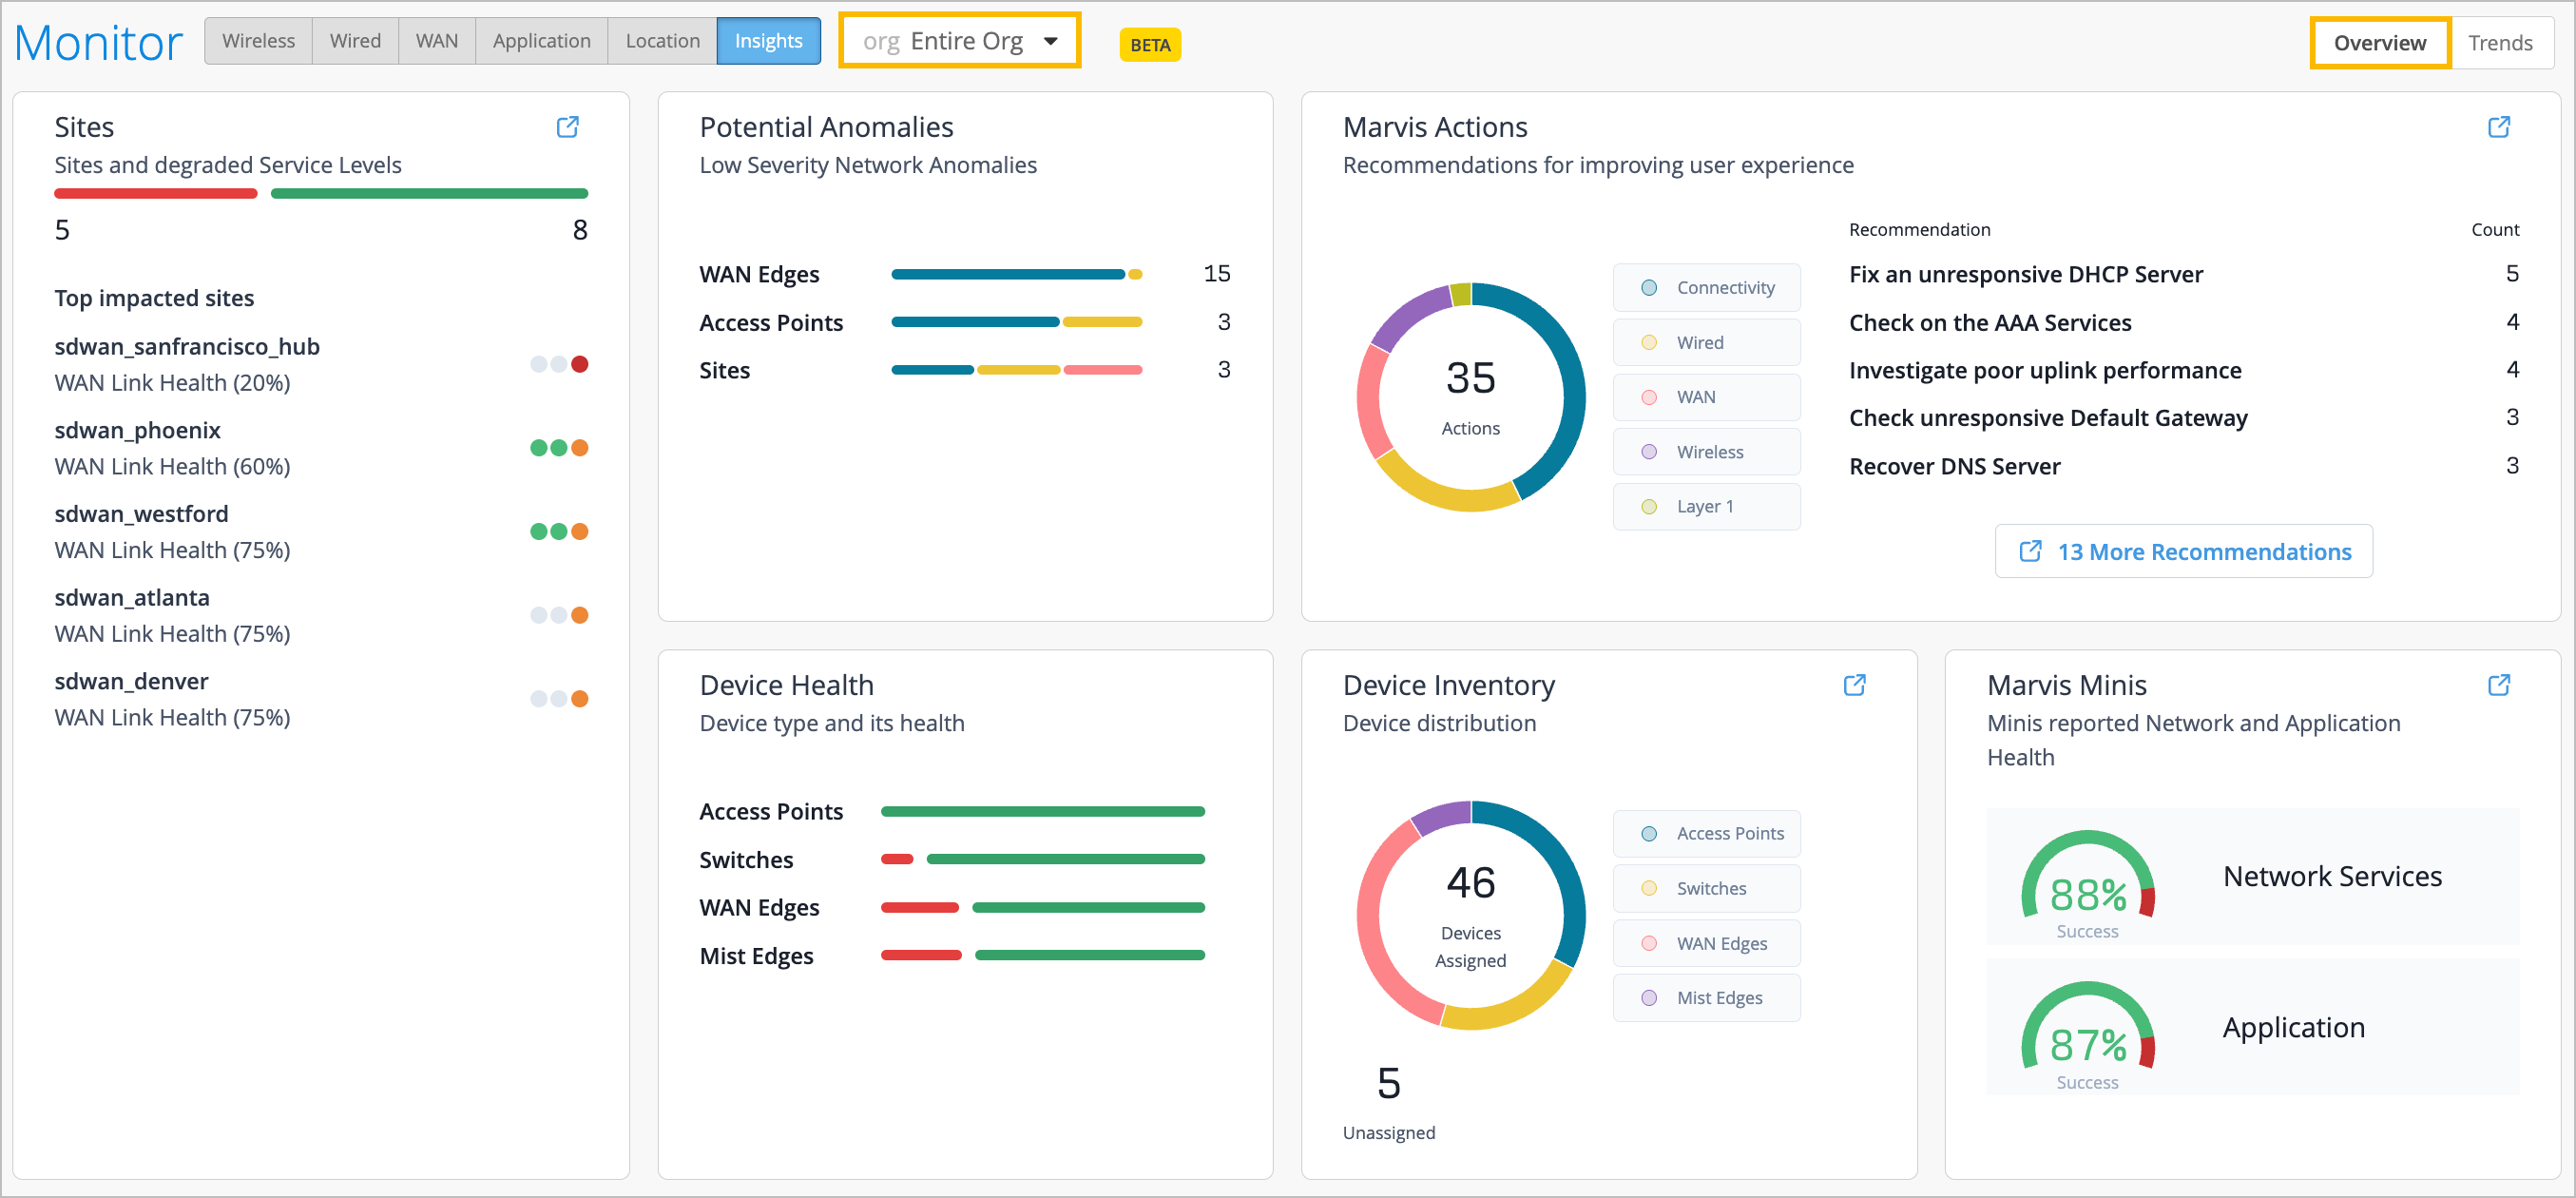
The Organization Insights Overview delivers actionable and relevant information on the health of user experience across all sites and includes the following key information that includes not only the typical device health and inventory views, but focuses on our Service Level Expecation framework to measure user experience, and bubbles up any potential anomalies, Marvis Actions or proactive issues found by Marvis Minis digital twin that are impacting user experience.
Sites—View the top 10 worst sites in relation to degraded WAN, wired, and wireless health Service Level Expectations impacting end user experiences.
Device Health—View the overall health by device type for your organization.
Device Inventory—View device distribution and activities. Quickly glance at the number of devices in your organization that require site assignment.
Potential Anomalies—Gain visibility into the low-severity network anomalies for the organization that indicate potential issues that could impact users, before they transalte to a Marvis Action with high efficacy. Categories that display here include Sites, Servers, ISP, Application, Access Points, Mist Edges, WAN Edges, Switches, Routers, and Clients.
Marvis Actions—See the Marvis Actions recommendations for optimizing network performance and improving user experience. The categories are Layer 1, Wireless, WAN, Wired, and Connectivity.
Marvis Minis—Learn the Marvis Minis reported information regarding network and application health.
You can click on the information within the widgets to gain insight into the issue affecting end users. For example, when you click on a site from the Sites widget, you are brought to the Site Insights page for that site, and when you click on the color coding to the right, you are brought to the corresponding WAN, wired, or wireless SLE. In some widgets, such as the Potential Anomalies widget, clicking on the color-coded status line opens a window containing further details. You can hover your mouse over any of the color coding on the Org Insights page to understand its meaning.
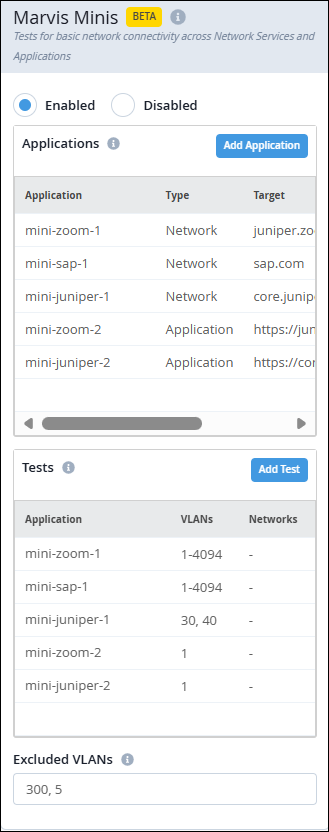
The updated version of Marvis Minis configuration now allows users to name their monitored custom applications. Users can define the applications and set up automated tests to continuously monitor their performance at both the organization and site levels. For each application, users can list the VLANs on which the tests need to be run. There is no change to the Marvis Minis functionality and the validations will continue to run on an hourly basis. For more information, see Add Custom URLs for Marvis Minis Validation.
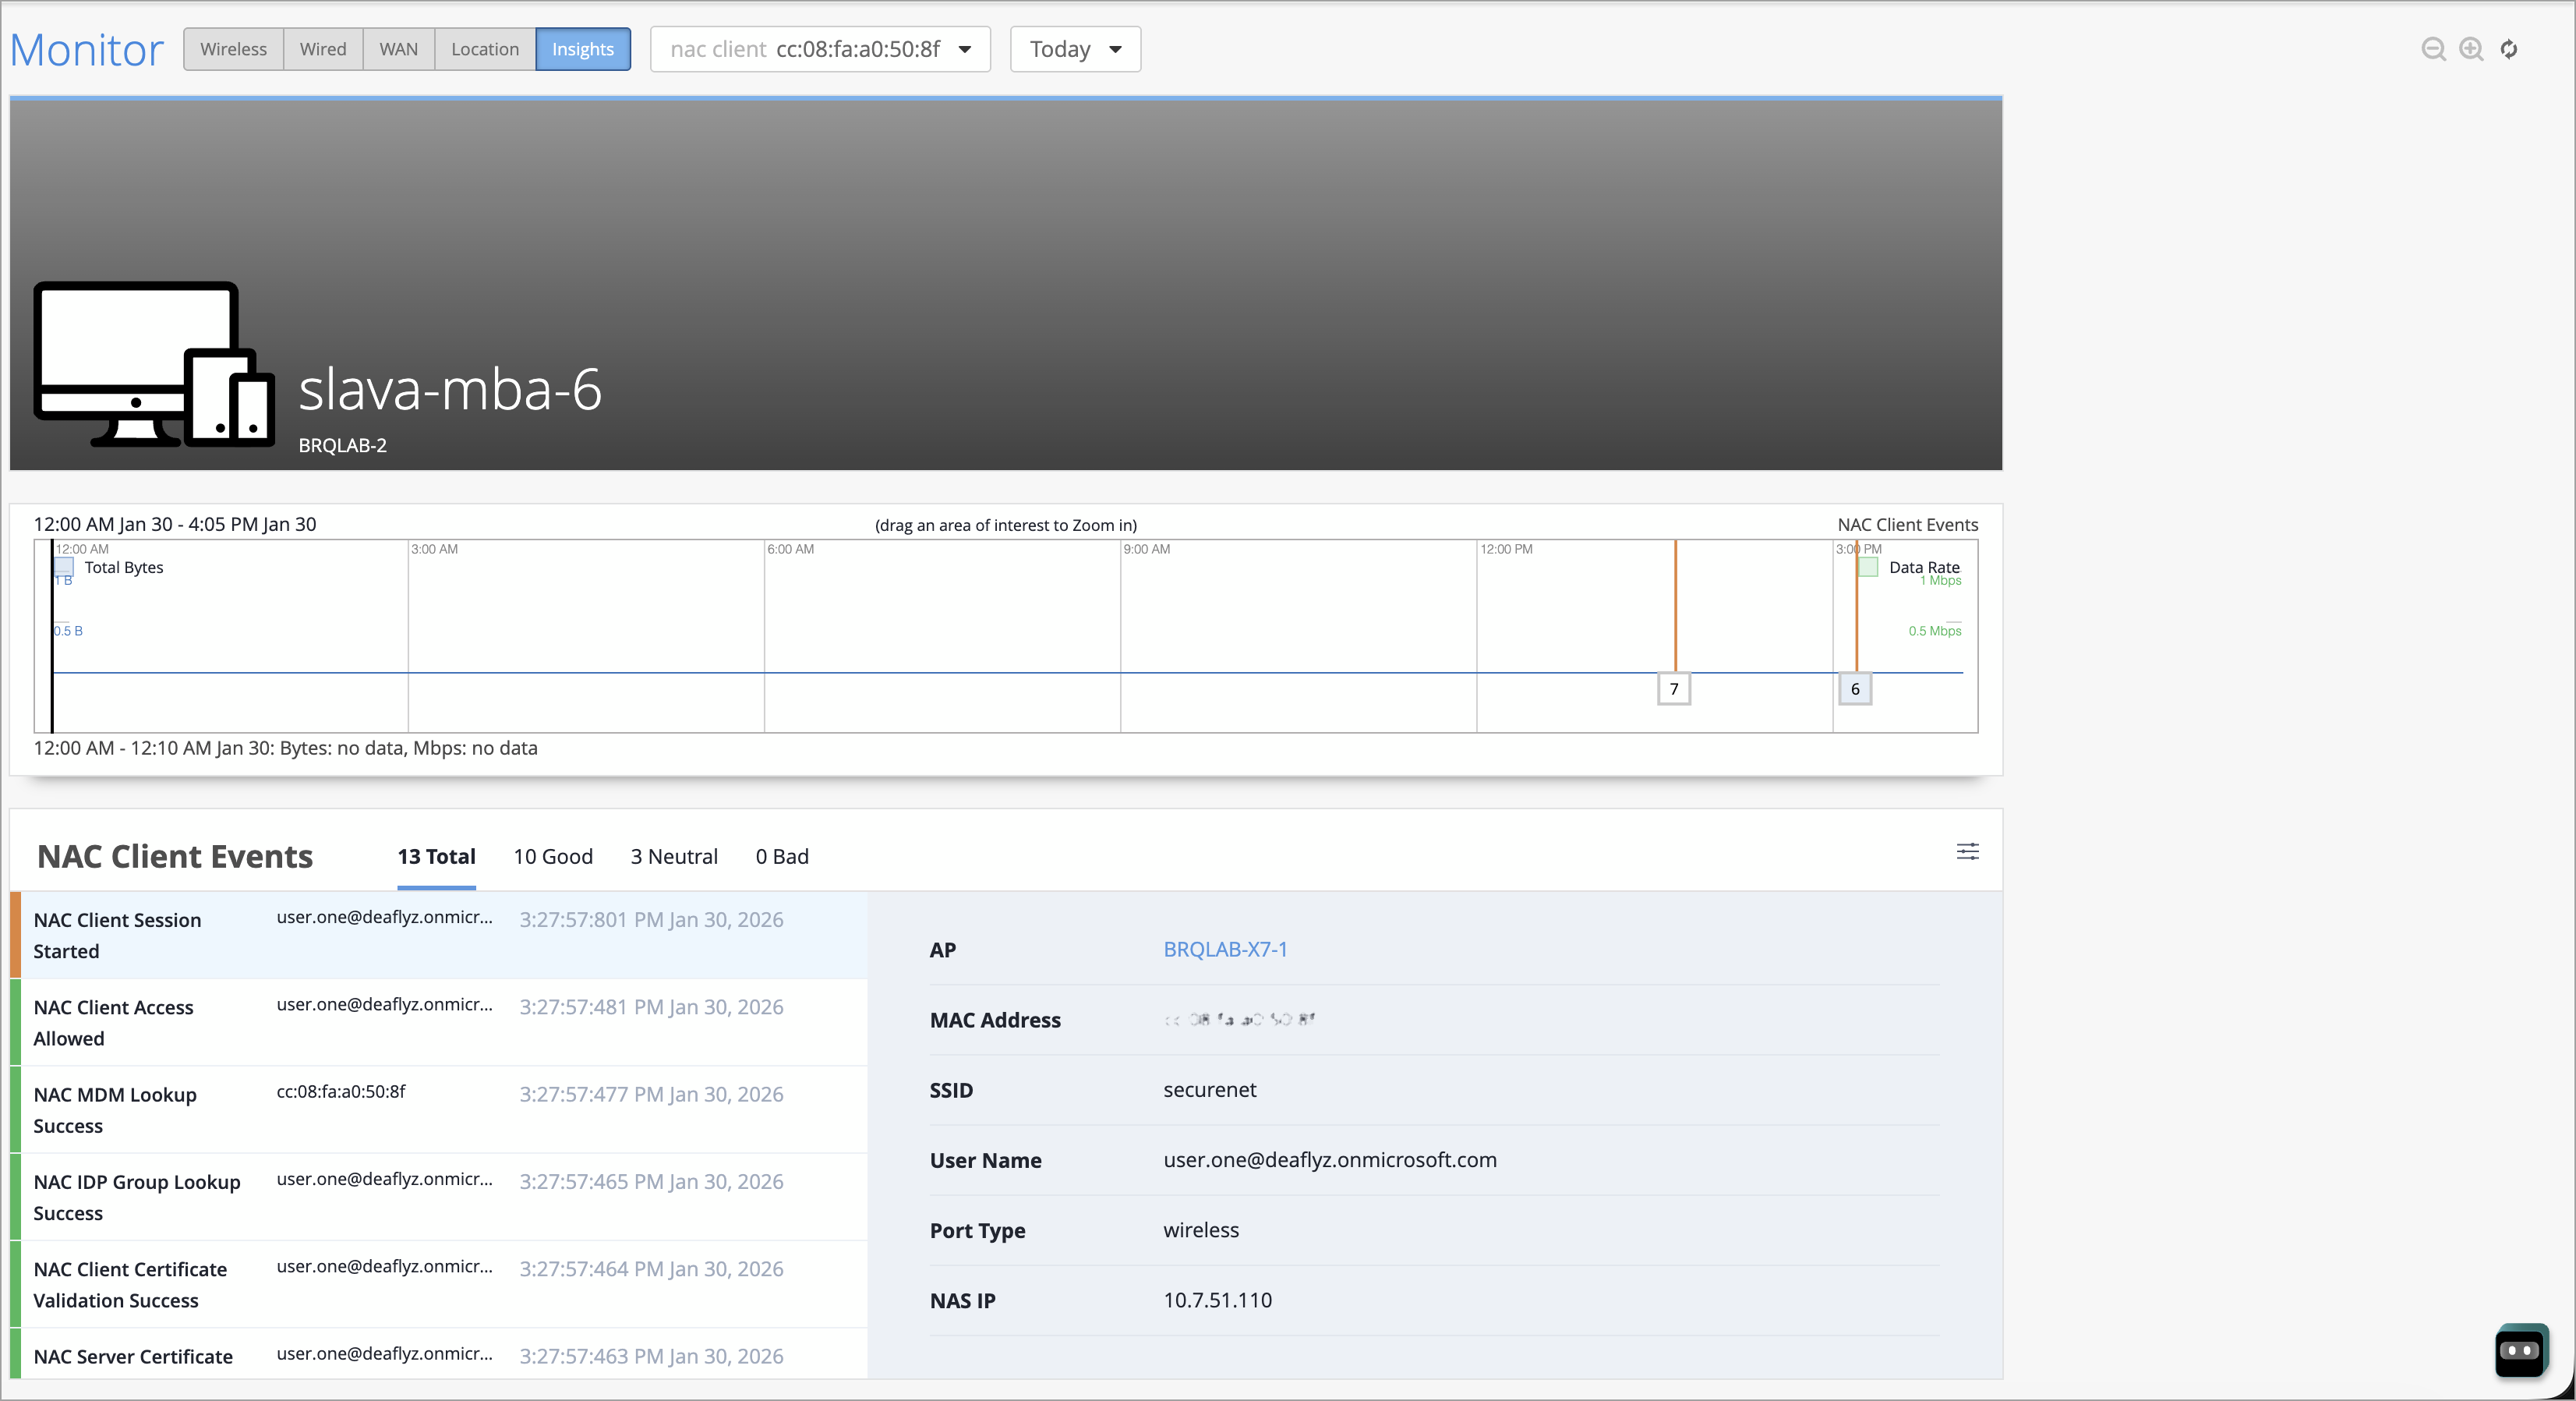
We are excited to introduce NAC Client Insights, which provides a quick overview of potential issues that affect the NAC clients' network experience. You can access this page by navigating to Monitor > Service Levels > Insights. Click the context menu at the top of the page, then click NAC Client on the left, and then select the client to view insights.
The page shows NAC Client Events with tabs: Total, Good, Neutral, and Bad. You can also click the Settings button at the upper-right corner to select the event types to include. The Current Values section at the end of the Insights page shows:
Properties—details such as User, MAC address, Auth Type, Client Type, and VLAN ID
Connection Status—details such as State, Client Type, and NAS Vendor
We have added several features to the Auth Policies page to make it easier for you to create, manage, and monitor your policies. You can see the new features by going to Organization > Access > Auth Policies.
Now you can:
Drag and drop labels onto your rule from the new Assign Labels window.
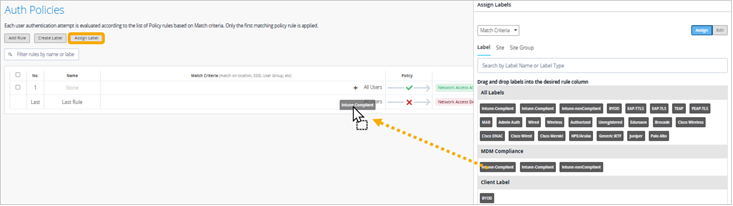
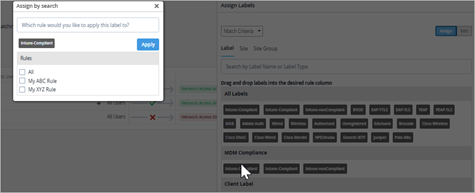
Batch-assign a label to multiple rules. In the new Assign Labels window, double-click a label, and then select the rules that you want to assign it to.
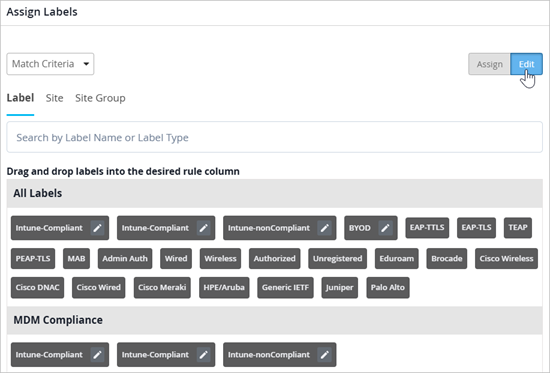
Edit labels quickly and easily. In the new Assign Labels window, click the Edit button, then click the pencil icon for the label to modify. You can change the label name and properties.
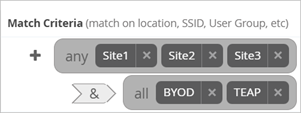
Assign policies. In addition to the match criteria as shown in the previous examples, you can change the selector to Policies, and then assign policies to your rules.

Interpret nested rules more easily. Visual cues indicate which labels are “match any” or “match all.”
View NAC events for your policies without navigating away from the Auth Policies page. Click a number in the Hit Count column to see NAC events for a particular rule, or click the new Show NAC Events button to see all events in an overlay window. Close the overlay window to see your rules again.
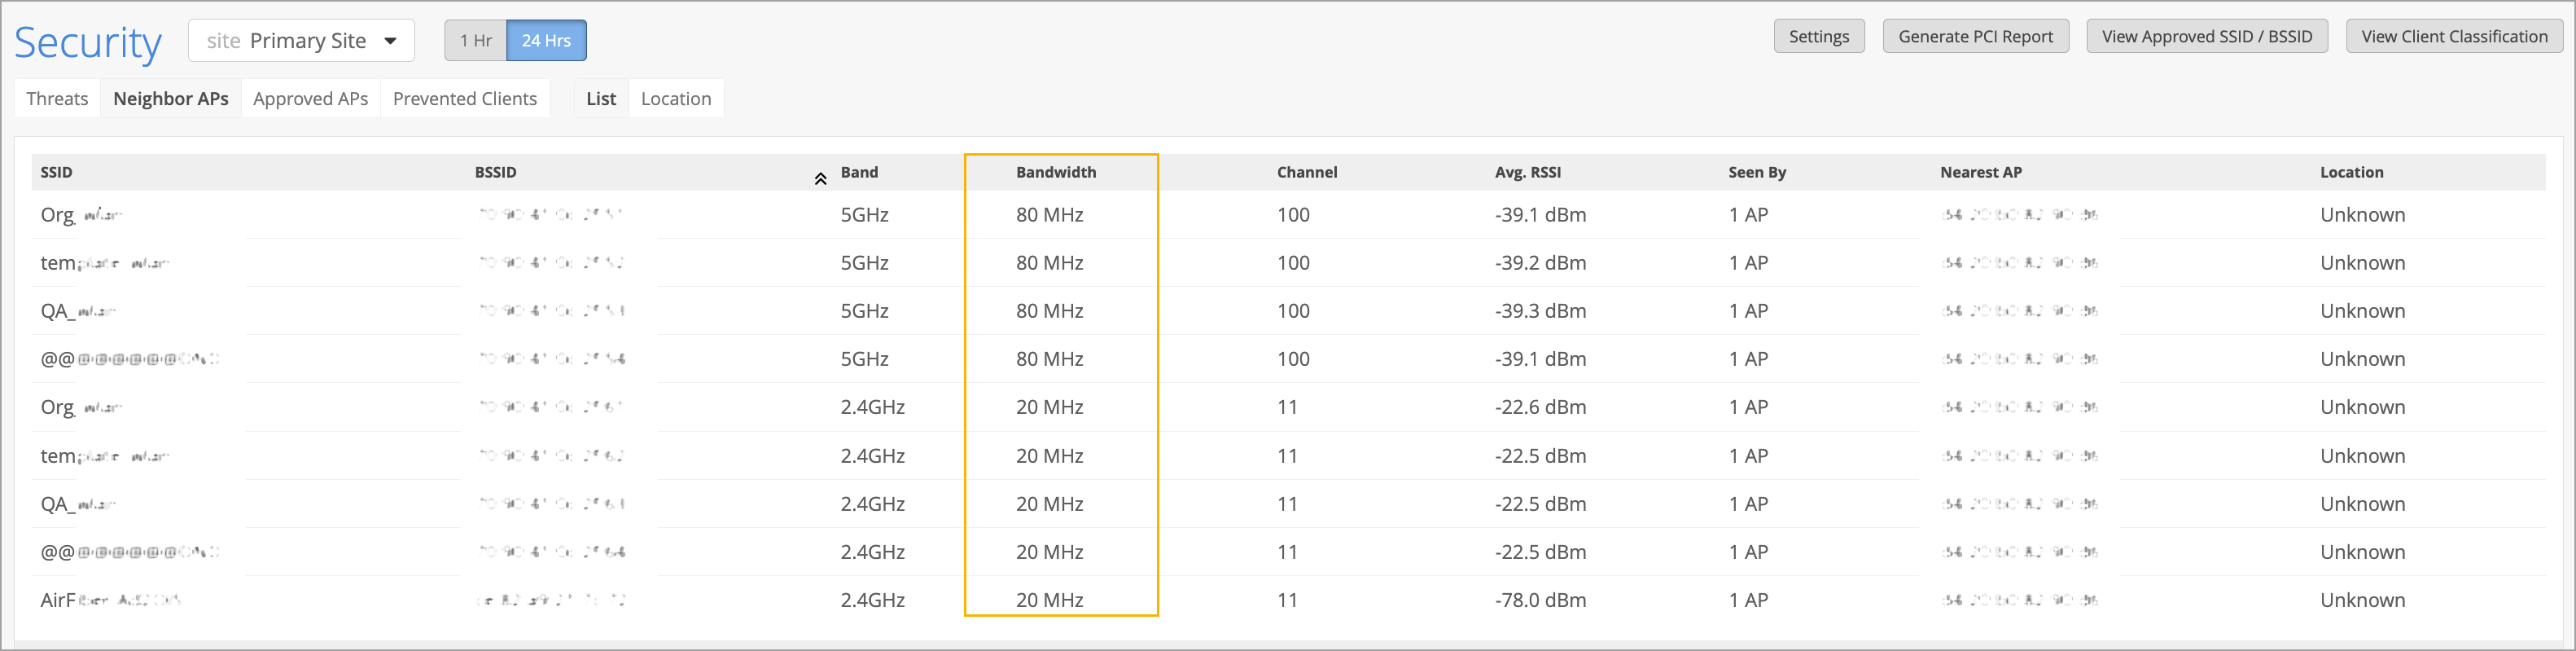
The security dashboard in Mist now displays the channel width (20/40/80/160/320 MHz) used by detected neighbor APs and threat APs. This information is collected by the Mist APs' dedicated scanning radios, which monitor nearby wireless devices. Channel width visibility helps to identify potential RF congestion or interference, as different channel widths impact how much spectrum an AP uses. You can view channel width for neighbor APs and threat APs in the Bandwidth column on the Site > Security page.
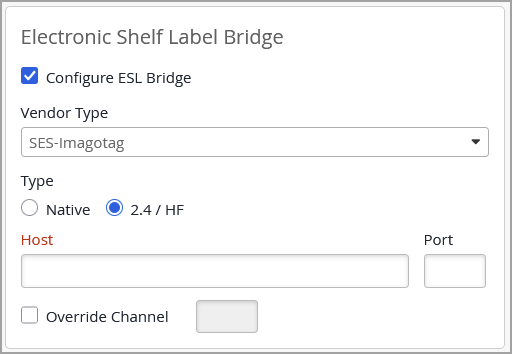
Support for configuring Electronic Shelf Label (ESL) bridges in Mist is now generally available. ESLs are small, battery‑powered e‑paper displays that present product and pricing information at the shelf edge, replacing traditional paper tags. They connect wirelessly to a central hub, enabling real‑time pricing updates and automated inventory workflows. Configuring an ESL bridge via Mist involves enabling the USB port on supported Access Points (APs) through the AP page or Device Profiles. This allows the AP to communicate with third‑party ESL vendor dongles, forming the link between the wireless network and the ESL management system. For more information, refer to Electronic Shelf Labels.
Mist Campus Fabric now supports assigning distinct VLAN sets for ESI‑LAG connections between distribution and access switches across different pods. This enhancement allows you to create different port profiles for each pod, enabling greater flexibility in segmentation and design. You may reuse the same VLANs across multiple pods or define unique VLANs per pod depending on your requirements. Each port profile may include different or overlapping VLANs.
This capability is supported only in Campus Fabric Core–Distribution CRB and ERB topologies. VLAN assignments are configured through port profiles on the Distribution / Access Port Configuration tile on the Campus Fabric Configuration > Network Settings page.
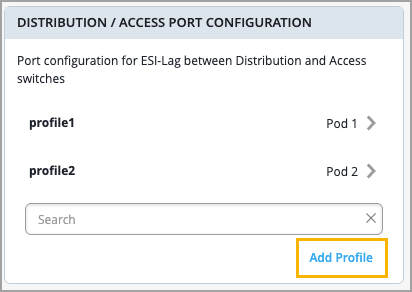
A pod is an existing Mist feature designed for improved scalability and simplified management. Access and distribution devices are grouped into pods, which often represent physical locations such as buildings.
To simplify switch monitoring, Mist has added a new Digital Optical Monitoring chart for fiber-optic switch ports. The chart displays five port properties, and you can filter the chart by clicking the respective buttons. Each of the five properties has a minimum, maximum, and average value.
The five properties are:
Rx Power
Tx Power
Voltage
Current
Temperature
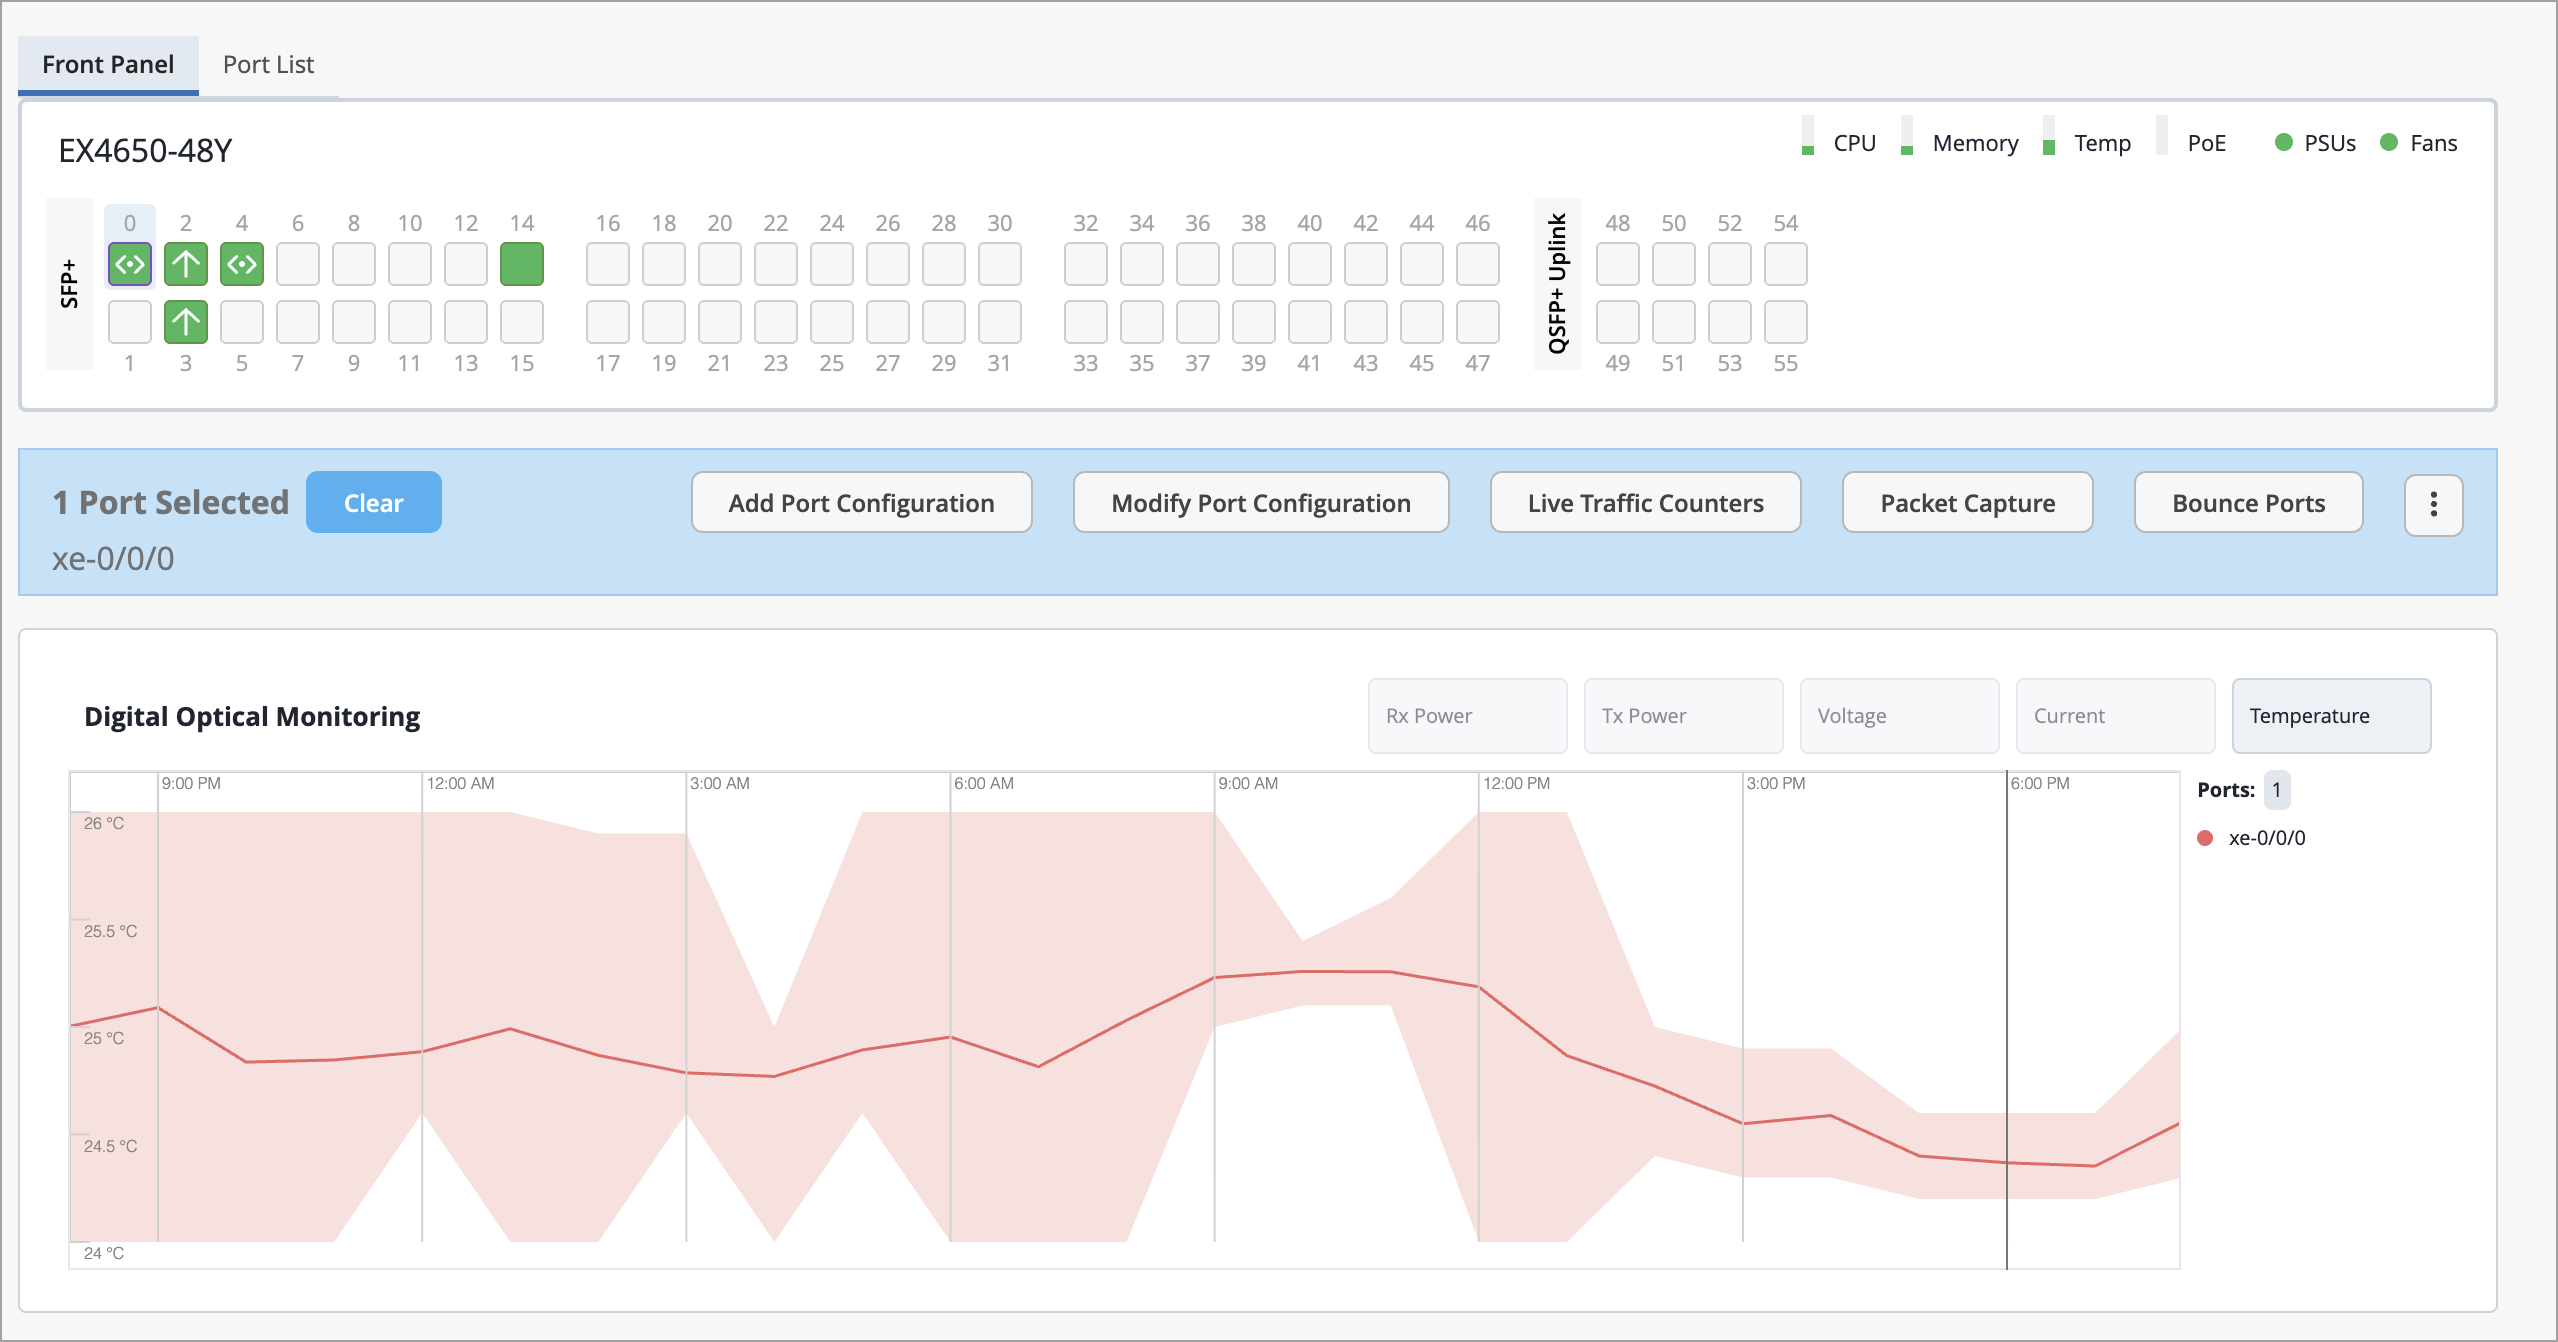
You can find this chart on the Switch Details page by clicking Switches from the left menu of the Mist portal, then select the switch to open the Switch Details page. From there, select the port(s) from the Front Panel and see the chart just below.
You can also navigate to Switch Insights from the Properties section of the Switch Details page, then scroll down to Switch Charts.
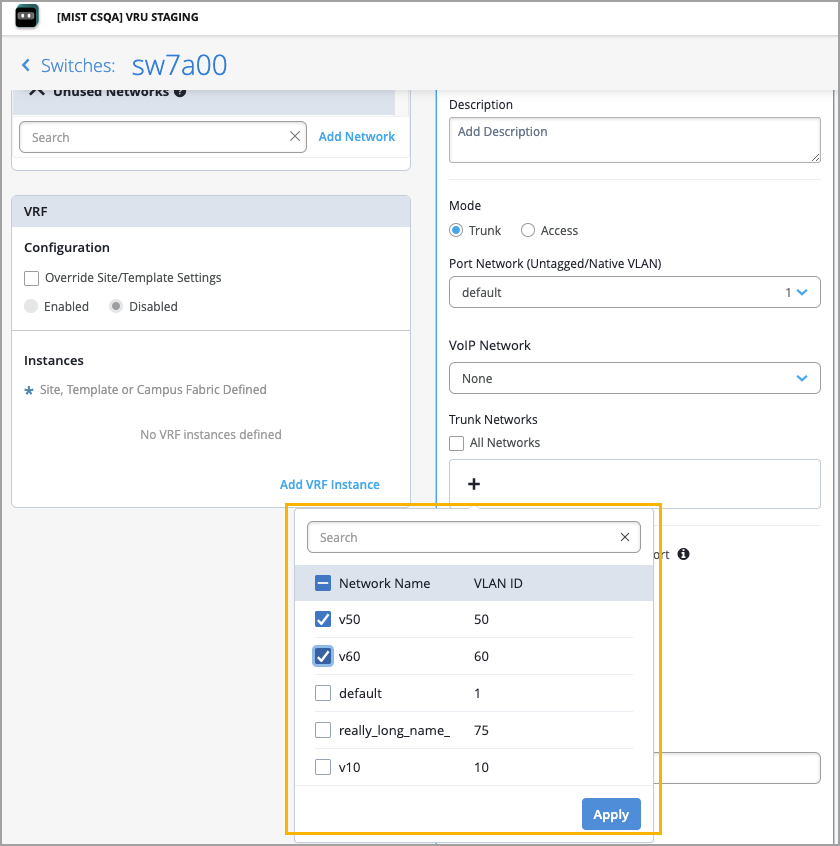
We have improved the option to multi-select networks in various Wired Assurance configuration pages, including:
DHCP Snooping in switch configuration
Port profiles in switch and campus fabric configuration (applies to trunk networks)
VRF in switch and campus fabric configuration
Previously, to include multiple networks, you had to select and apply the networks one by one. The new enhancement allows you to select multiple networks from a list view and apply the selection at one click, making configuration faster and more efficient.
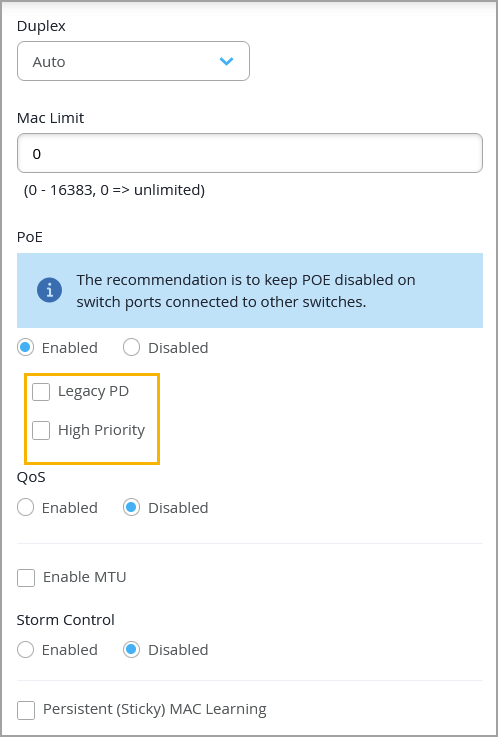
We have introduced the following enhancements to PoE configuration in Mist:
Legacy PD (or legacy powered device)—Starting in Junos OS Release 24.2R2, 24.4R1, and 23.4R2-S4, legacy powered devices (pre-802.3AF standard) are not detected for PoE by default in EX4400-24MP, EX4400-48MP, EX4400-48MXP, EX4400-48XP, EX4400-24P, and EX4400-48P switch models. To ensure that the legacy devices receive power, you need to enable the Legacy PD option on the PoE-enabled switch port via the associated port profile.
High Priority—This option designates a PoE-enabled interface as high priority for power allocation. You can configure this via port profiles. In scenarios where PoE demand exceeds the available power budget, the switch will maintain power on high-priority interfaces until all low-priority interfaces have been powered down.
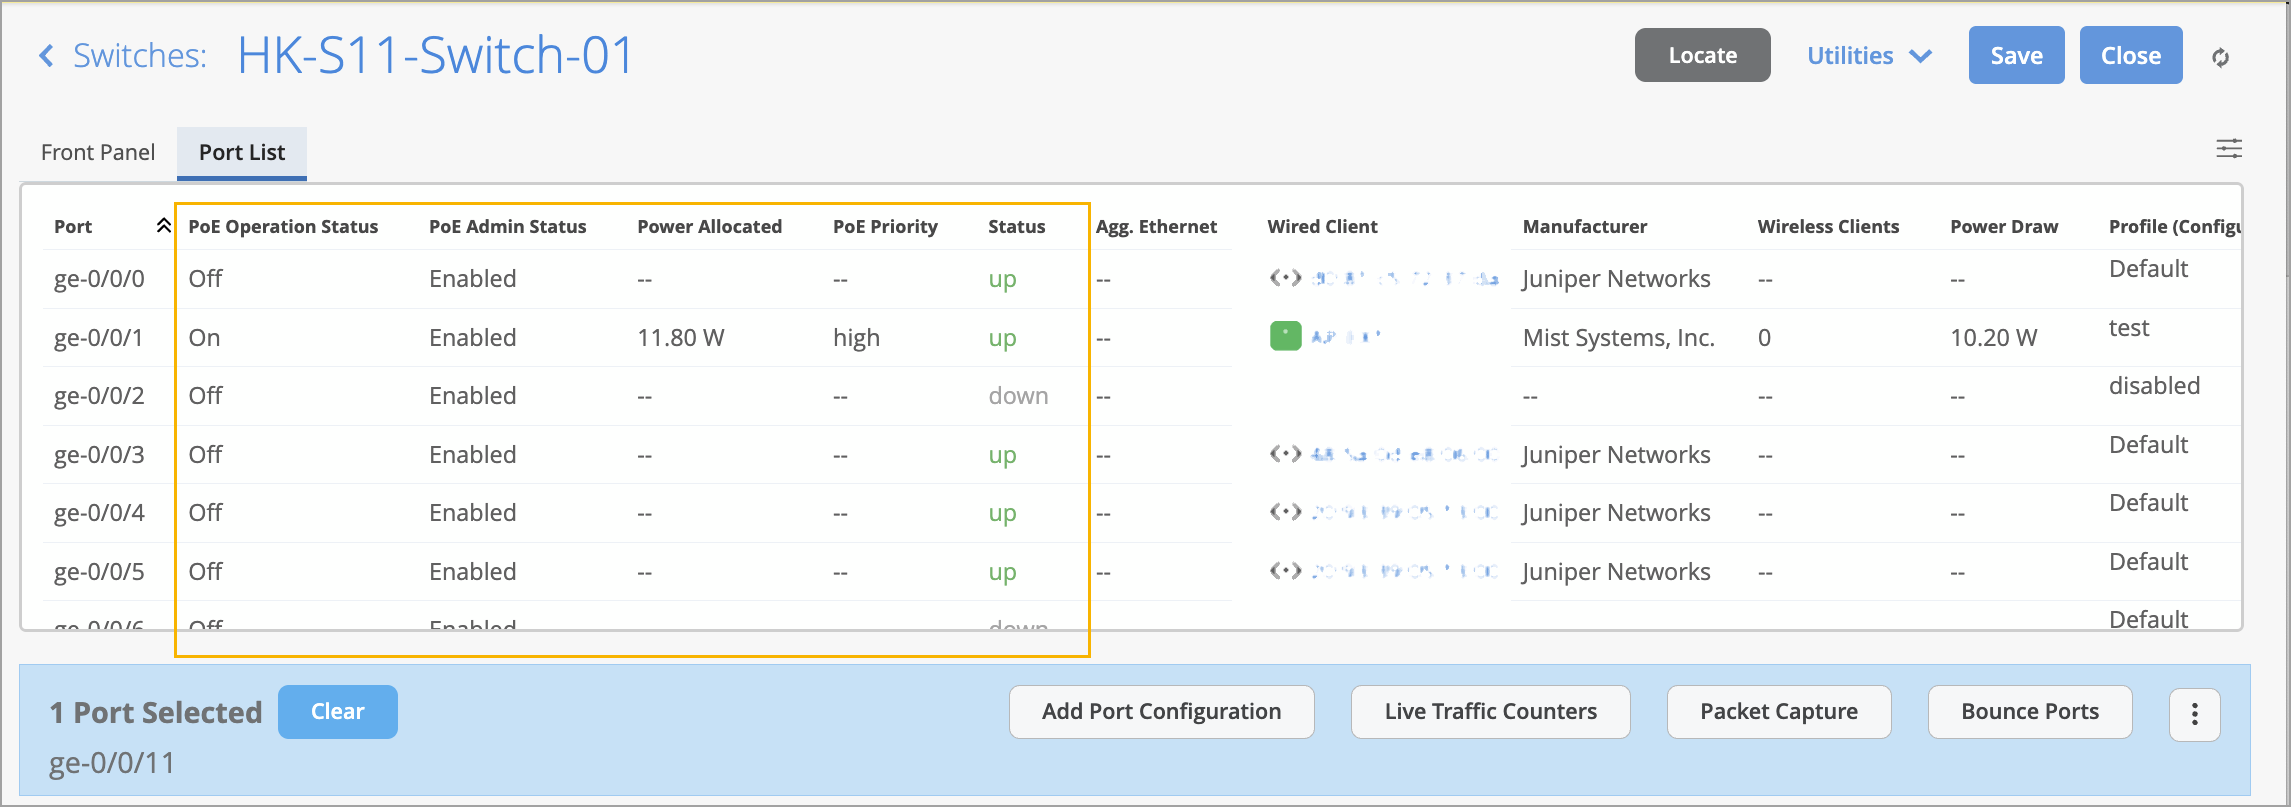
You can view PoE status information across multiple locations in Mist, including Switch Details (port hover view, port list, and port statistics tile), Wired Clients page, and Switch Insights (Switch Events).
The following key details are available on these pages:
PoE Operation Status—Shows if the connected powered device is receiving power from the PoE-enabled port.
PoE Admin Status—Indicates whether PoE is administratively enabled in the associated port profile.
Power Allocated—Displays the allocated power in watts (W).
PoE Priority—Indicates whether the PoE priority is set to high.
PoE Status—Shows the supported PoE standard (example: 802.3bt) when you hover over the PoE indicator on the right of the Front Panel section on the Switch Details page.
Reserved Power—This is the amount of power from the PoE power budget to be used in the case of a spike in PoE power consumption. This is displayed when you hover over the PoE indicator on the right of the Front Panel section on the Switch Details page.
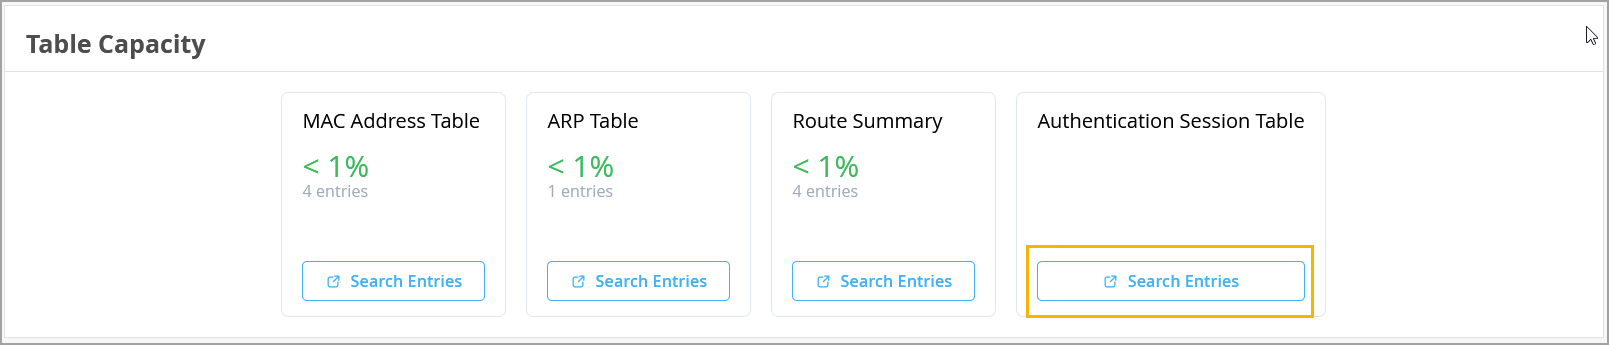
As an admin user, you now have quicker and more intuitive access to authentication information via Switch Insights. The new Authentication Session Table card located under Table Capacity in Switch Insights provides 802.1X (Dot1x) session details for either all switch ports or specific ports that you choose. This enhancement significantly improves operational visibility and streamlines troubleshooting workflows.
To view 802.1X (Dot1x) session details for switch ports, click Search Entries in the Authentication Session Table card. In the Search Entries window that appears, select the ports you want to inspect and then click Search to display the corresponding authentication session information.
You can now configure alerts for switch port loop events in Mist. This feature ensures that you are immediately notified when a loop occurs (such as when someone connects an endpoint incorrectly), helping you take quick corrective action.
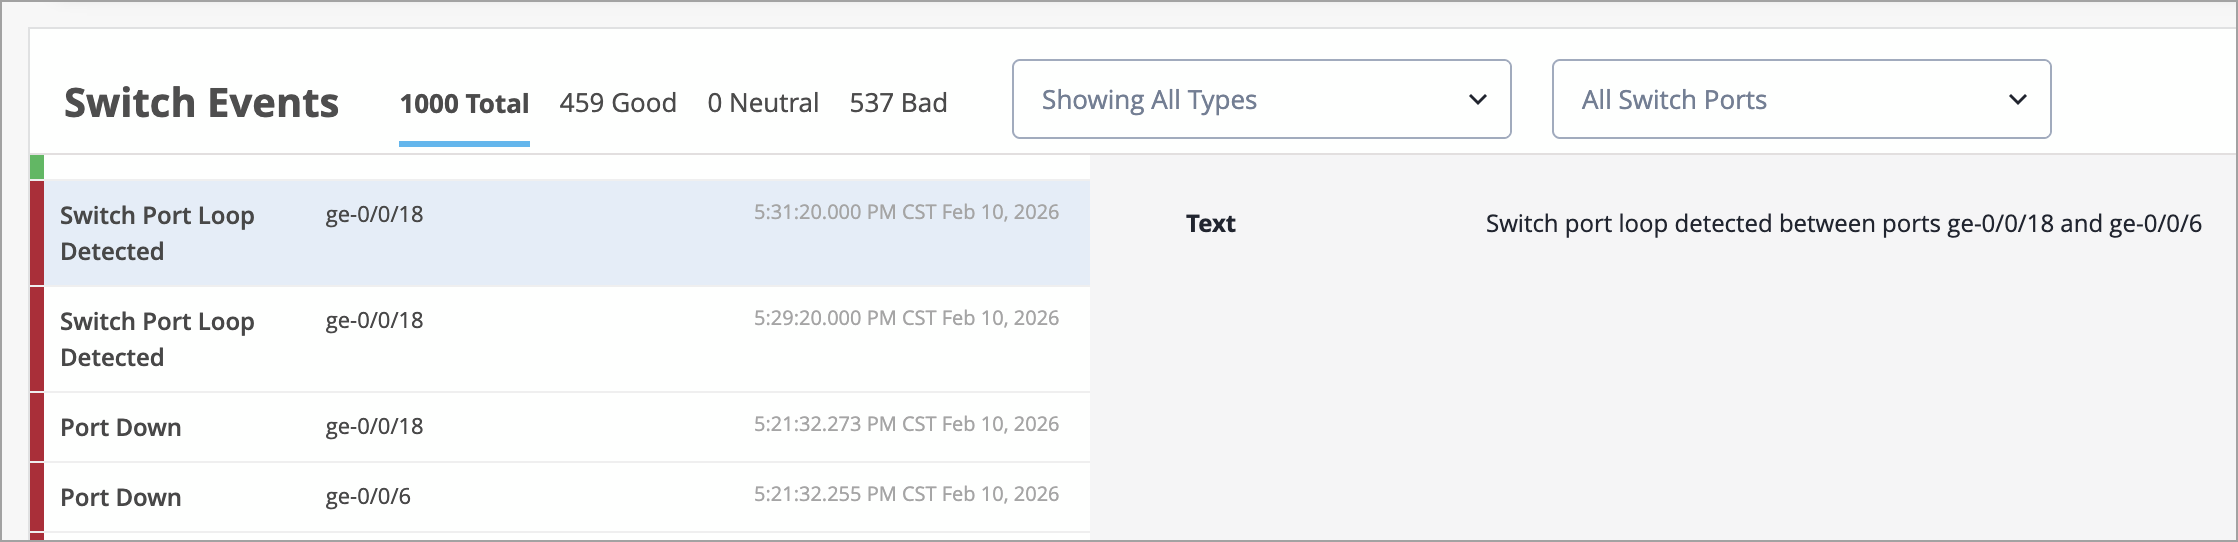
In addition, loop events are now searchable in Marvis, making root cause analysis faster and easier.
You can configure the alerts from the Monitor > Alerts page.
This enhancement reduces time and effort required to identify and resolve port loop events.
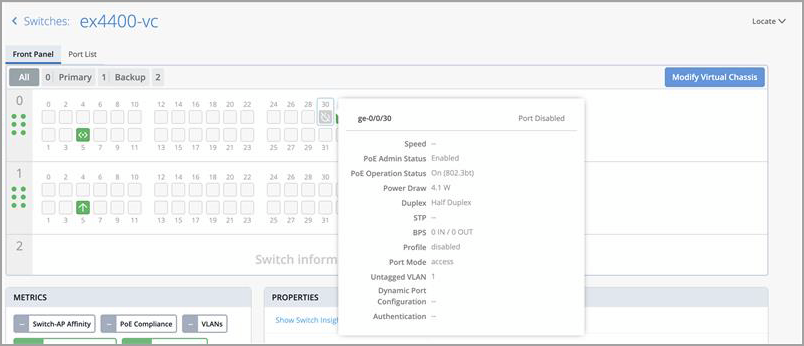
If a user administratively disables a switch port, the Front Panel section in the Switch Details displays that port with a greyed-out icon, indicating that it is disabled. This makes it easier to visually confirm which ports are disabled, improving the troubleshooting experience.
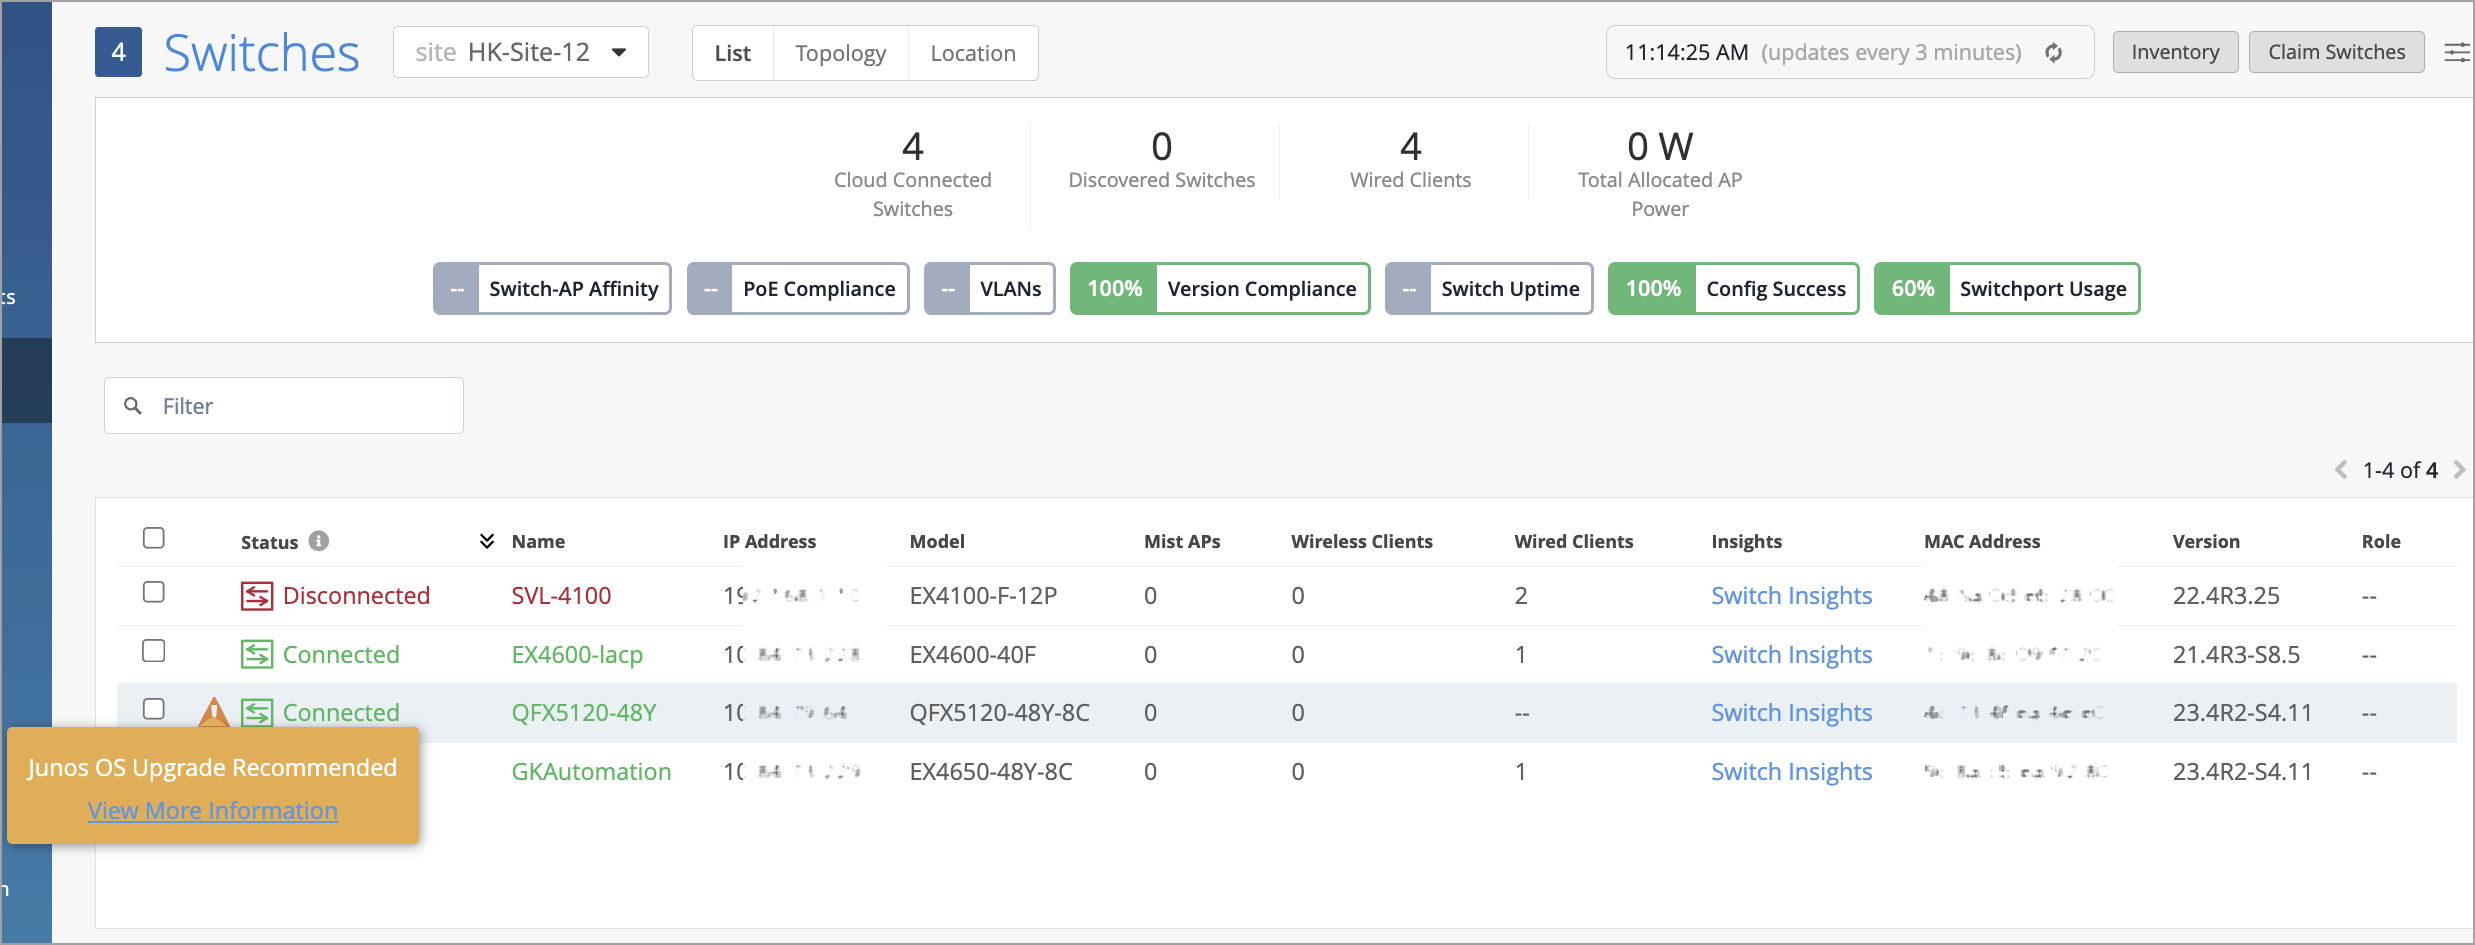
For EX4650 and QFX5120 switches that have the JMA (Junos Mist Agent) package installed and are running Junos OS version 23.4R2-S4, we recommend upgrading to Junos OS 23.4R2-S6.
This upgrade is important because, if a switch running Junos version 23.4R2-S4 with a JMA package reboots for any reason, the JMA service fails to start after the switch comes back online. This results in the switch losing connectivity to cloud. To know more about this issue, refer to PR1882472.
To help identify affected devices, the Switch List and Switch Details pages now display a warning for EX4650 and QFX5120 switches on Junos 23.4R2-S4 running a JMA package, indicating that an upgrade to Junos version 23.4R2-S6 is recommended.
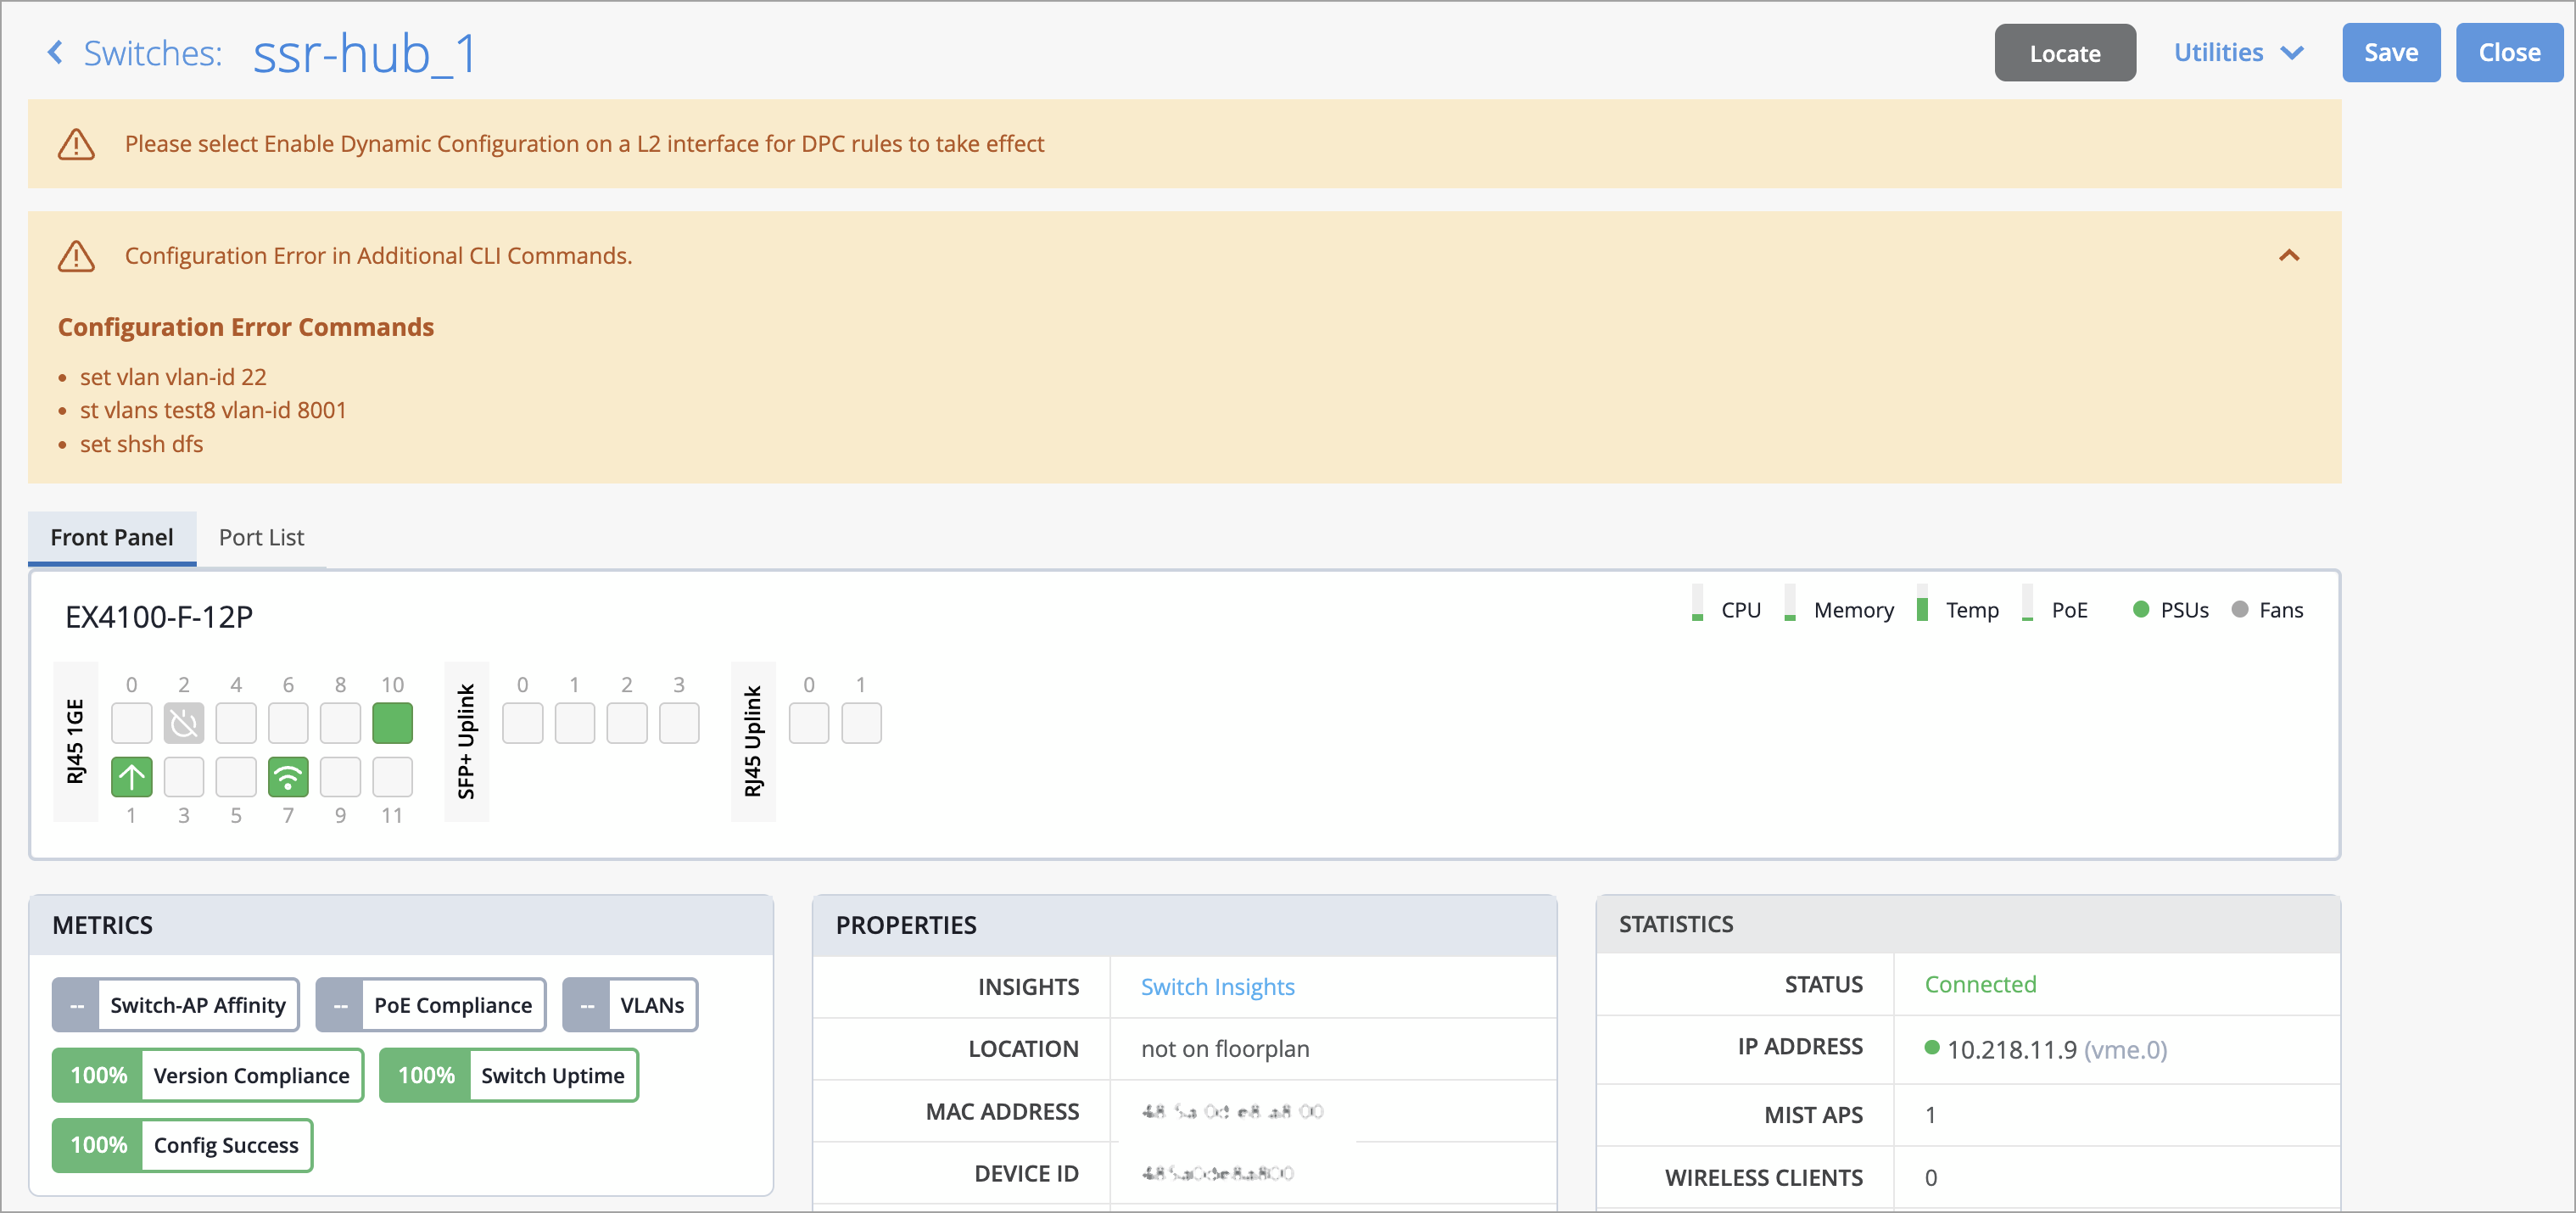
When switch configurations entered through Additional CLI Commands contain errors, a warning now appears directly on the switch details page (Switches > Switch Name). This enhancement gives administrators immediate visibility into configuration issues and simplifies troubleshooting. Previously, configuration errors were only recorded as events on the Switch Insights page, which meant users might not notice them unless they specifically navigated to that page.
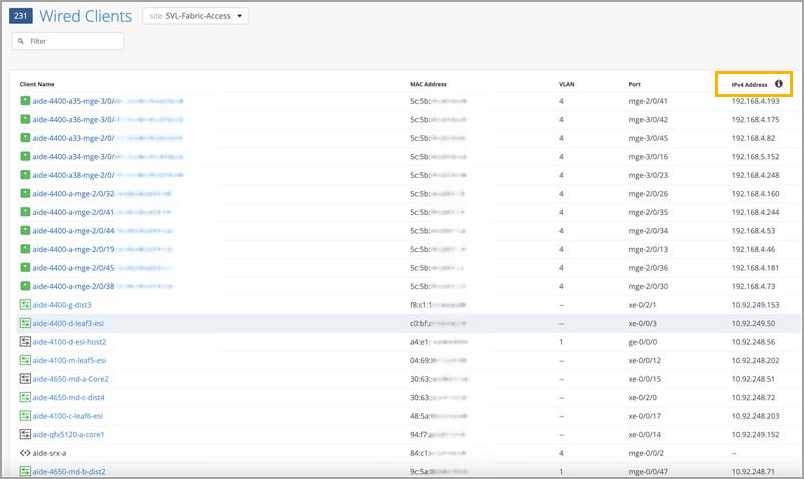
Mist now automatically enables the global MAC‑IP snooping feature (set protocols l2-learning global-mac-ip-snooping) on EX4000, EX4100, EX4400, EX4650, and QFX5120 switches running Junos OS 25.2R1 or later. This feature allows the switch to learn MAC‑to‑IP bindings for connected clients in VLANs where DHCP snooping is not enabled. To view MAC‑IP information in Mist, go to the Front Panel section on the Switch Details page, then hover over the switch port connected to the client. Mist also displays each client’s IP address and associated switch interface on the Wired Clients page for switches that have the JMA (Junos Mist Agent) package installed and are running Junos OS 25.2R1 or later.
We are excited to introduce secure conductor onboarding support for Session Smart Routers (SSR). This enhancement allows customers to onboard SSR devices to a Session Smart Conductor securely and automatically using Mist as the control point.
The secure conductor onboarding relies on an endorsement key (EK) associated with each router, a secure onboarding token generated by the conductor, and a WebSocket‑based secure channel over ports 930 and 933.
The onboarding steps include the following at a high level:
Onboard the SSR device to Mist using the Adopt workflow.
From Mist, obtain an endorsement key (a device ID token) for the SSR via the API: PUT /api/v1/orgs/<org_id>/ssr/export_idtokens. Be sure to include the router’s MAC address in the request.
On the conductor, configure the router details (such as the router ID and the endorsement key), and generate a secure onboarding token which will later be configured in Mist.
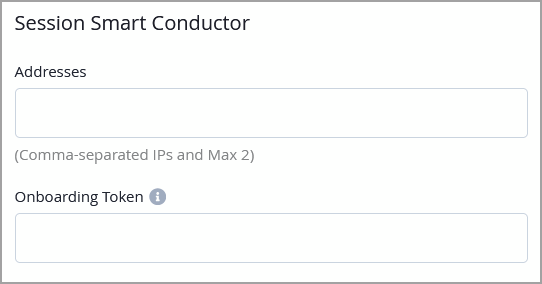
In the Mist portal, configure the conductor’s public IP address and the onboarding token in the Session Smart Conductor section under WAN Edges in the site configuration.
Assign the SSR to the site which you configured in the previous step. This triggers the secure onboarding workflow between router and Conductor.
Note: This feature is supported only on SSR 4xx‑series hardware and on virtual appliances that provide TPM 2.0 support, such as AWS and Azure instances with vTPM enabled.
To verify the onboarding status, use these commands on the conductor:
show secure-conductor-onboarding <router>
show assets <router>
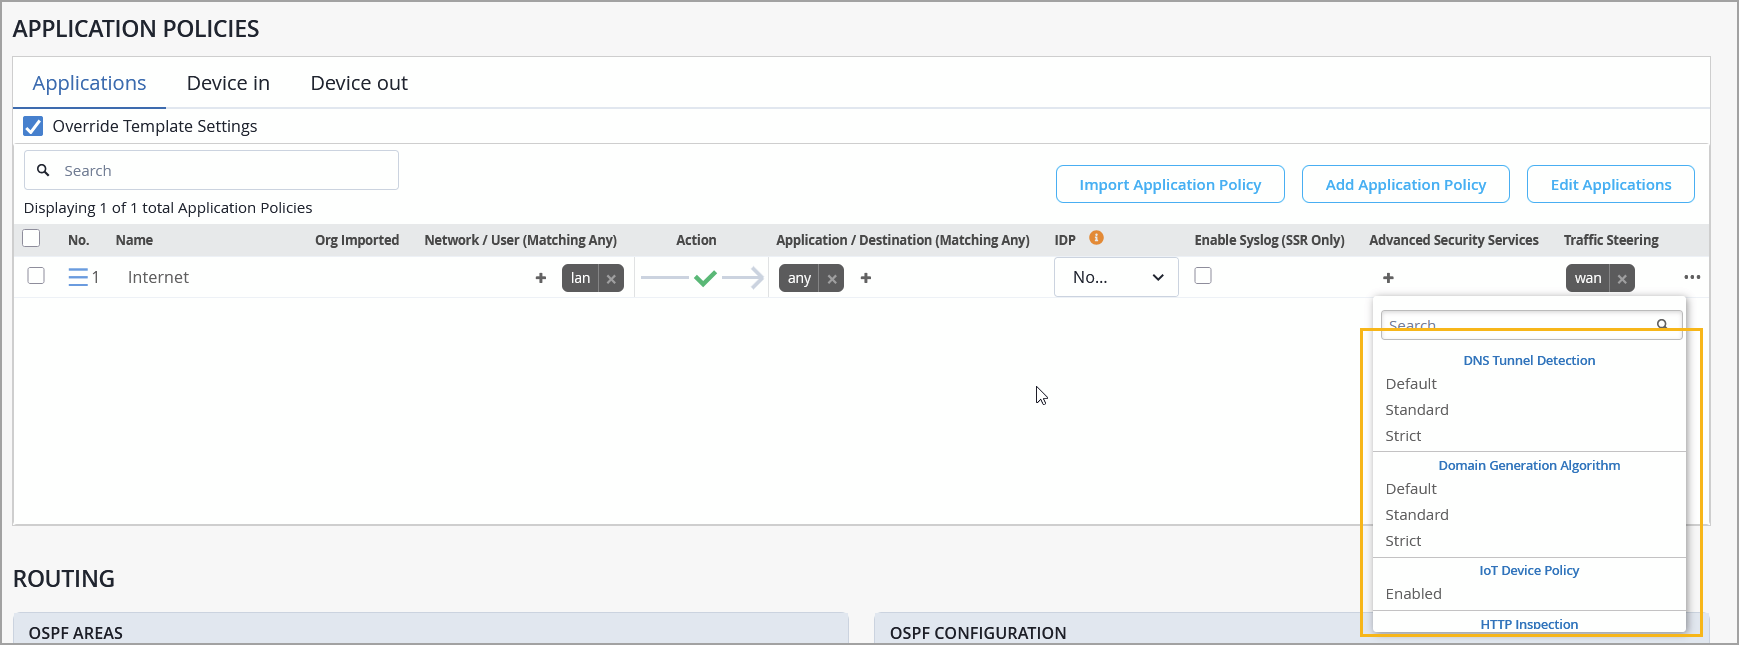
Mist has added the following new Advanced Threat Protection (ATP) security services for WAN Edge devices, available under Application Policies at both the organization level and device level:
DNS Tunnel Detection–Detects malicious DNS tunneling activity. DNS Tunneling is a cyber-attack method that encodes the data of other programs or protocols in DNS queries and responses. When a DNS packet is detected as tunneled, the SRX Series Firewall can take permit, deny or sinkhole action.
Domain Generation Algorithm (DGA) Detection–Identifies malware‑generated domains. DGA detection analyzes DNS traffic to identify domains generated through DGAs, which are used by malware to contact command‑and‑control servers.
IoT Device Policy–Provides specialized protection for IoT devices.
HTTP Inspection–Enables deeper inspection of HTTP traffic.
These services can be enabled from the Advanced Security Services column in the Application Policy configuration at the organization level (Organization > WAN > Application Policy) or at the device level (WAN Edges > WAN Edge Device).
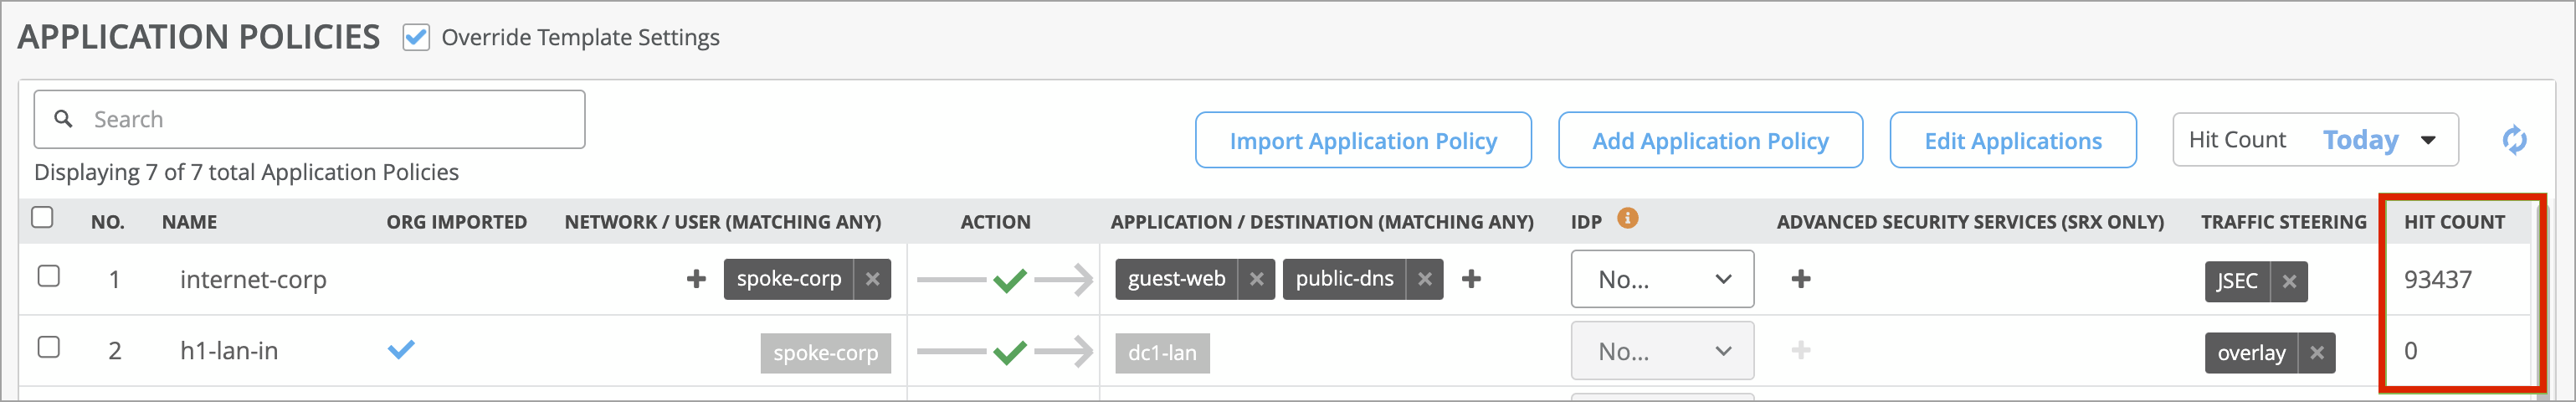
The Application Policy section on the WAN Edge device page now displays the policy hit count for SSR devices. The hit count is available only for the SSR devices running software version 7.x.x and later. The hit count indicates the number of times an application policy rule has been triggered (matched) by traffic. This feature is already available for SRX Series firewalls.
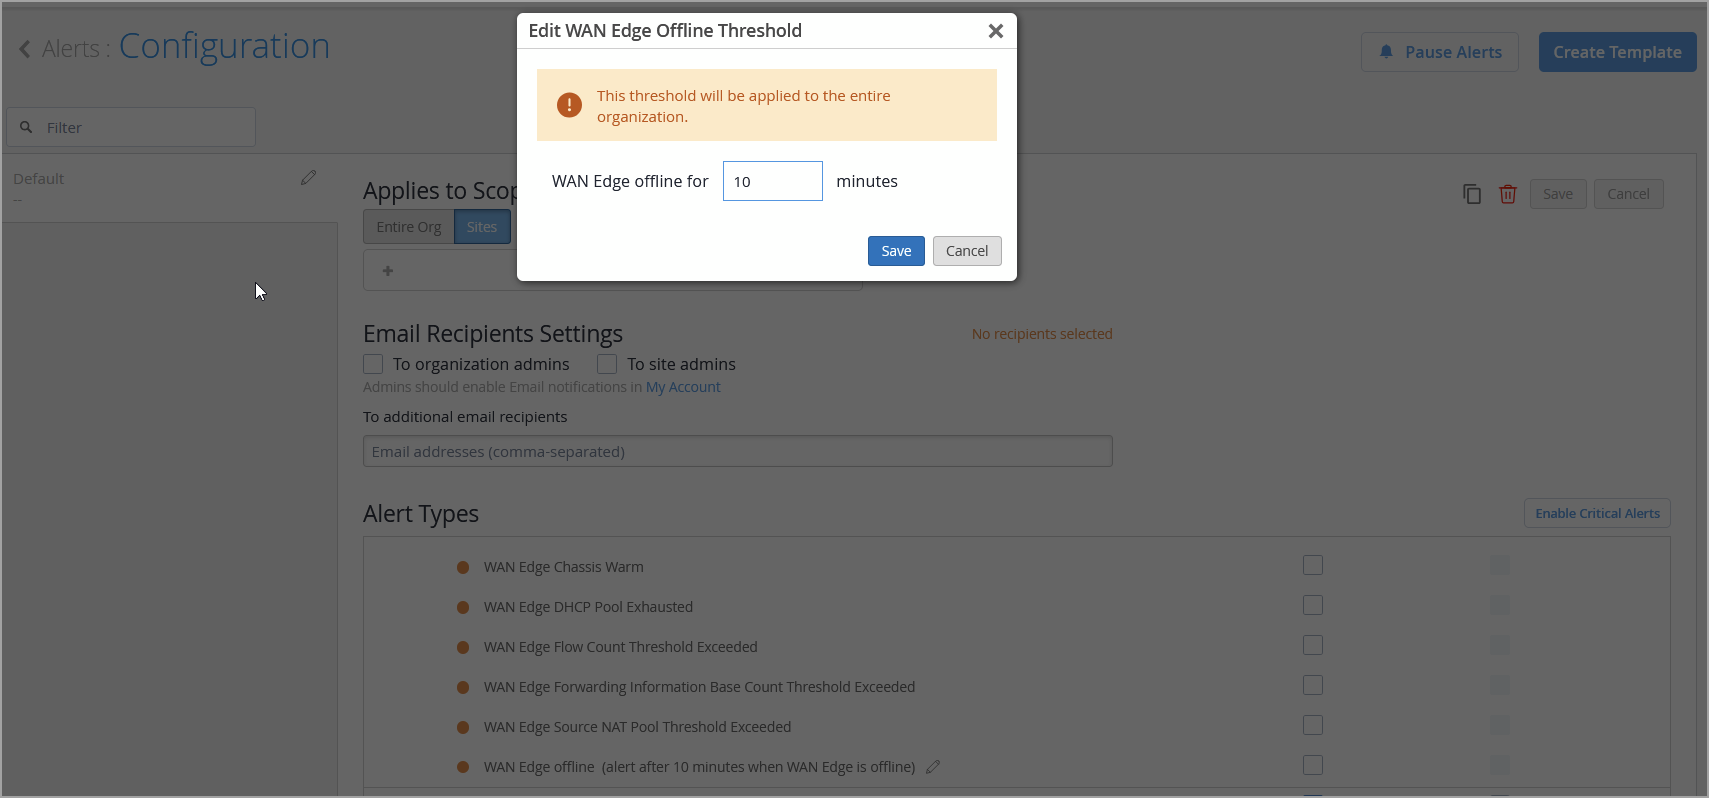
Mist now supports alert dampening for the following WAN Edge events:
WAN Edge Offline
WAN Edge BGP Neighbor Down
VPN Peer Down
You can enable alert dampening by configuring a time‑based threshold (in minutes) that determines when a DOWN alert should be triggered. If the device recovers before the threshold expires, the DOWN event is automatically suppressed.
To configure alert dampening:
Go to Monitor > Alerts > Alerts Configuration.
Click the pencil icon next to the alert name. This icon is available only for those events that support alert dampening.
Configure the thresholds and any additional settings, then save the configuration.
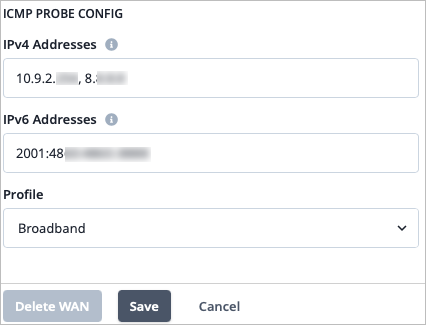
You can now configure real-time performance monitoring (RPM) probes for the IPv4 and IPv6 underlays on your WAN Edge devices for the purpose of monitoring WAN link health. Mist has added an ICMP Probe Config section within the WAN configuration, where you can configure custom IPv4 and IPv6 probes and their associated profiles. This allows you to enter the IP address of any device that you want to ping for WAN link health. You can enter multiple IP addresses separated by a comma.
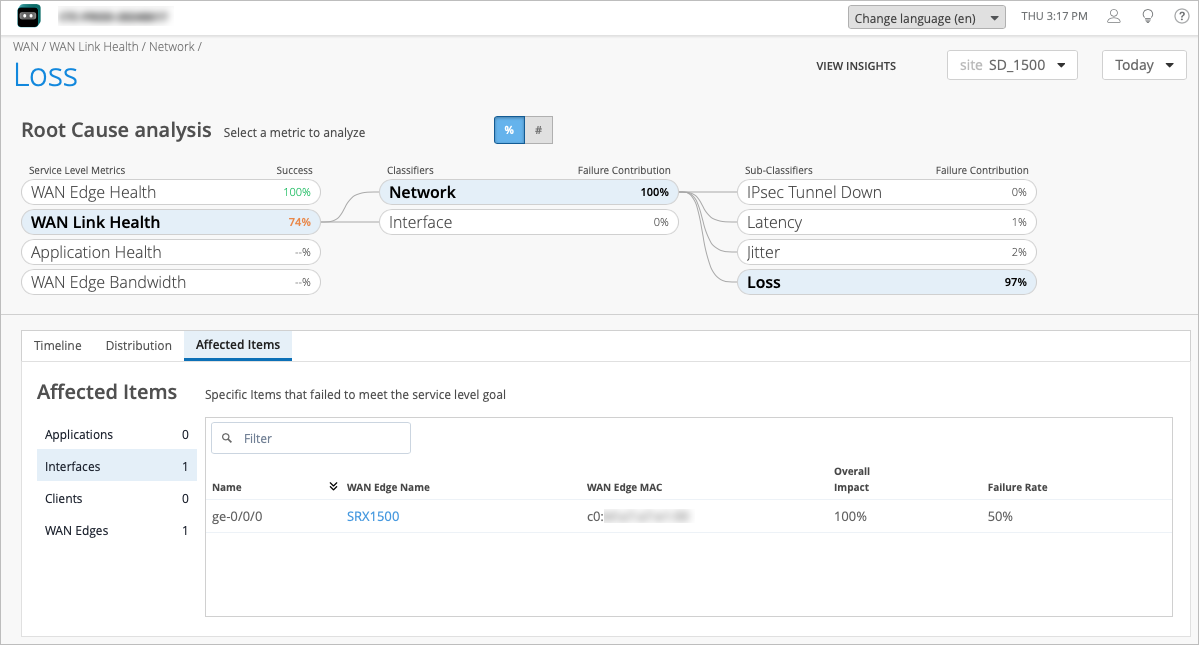
In the November 12th 2025 release notes, we introduced a new Sub-Classifier of Loss for the WAN Link Health SLE. You can view the Loss for your customized probes in the WAN Link Health SLE for your organization by navigating to Monitor > Service Levels, and then click the WAN button. The Network classifier contains sub-classifiers, such as Loss, which is triggered when the WAN link loses packets. You can click on the Loss sub-classifier to see more detailed information, such as the interface that the loss is occurring on.
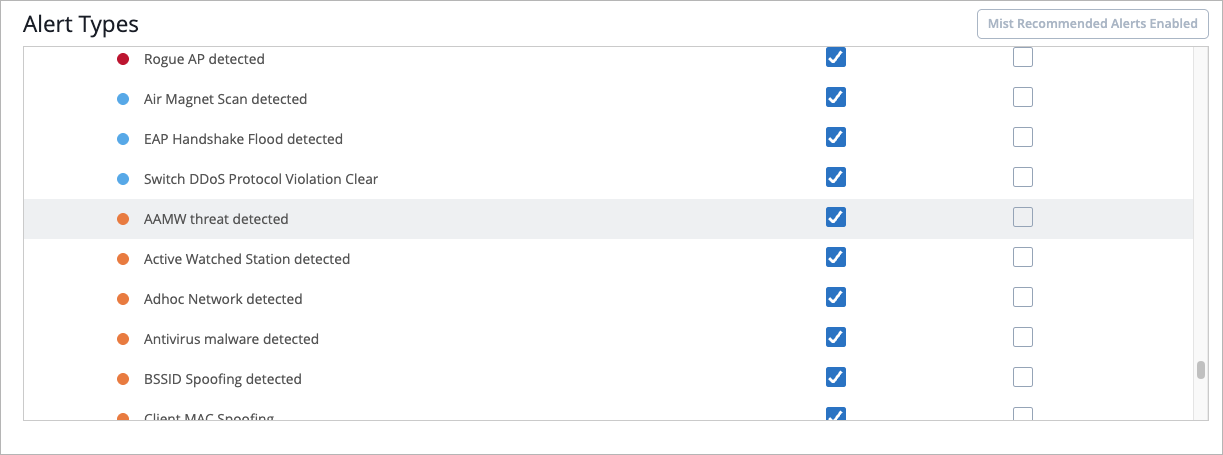
We are excited to introduce new Security Alert Types that you can configure on the Monitoring > Alerts > Alerts Configuration page. The new security alerts include:
AAMW threat detected (Advanced Anti-Malware)
SecIntel threat detected (Secuirty Intellegence)
Antivirus malware detected
Selecting these alert types means that they will appear in your Alerts list if the repeated behavior occurs for the selected org or site. Additionally, you can enter an email address in your Alerts Configuration if you want to be alerted via email. See Alert Configuration for details.
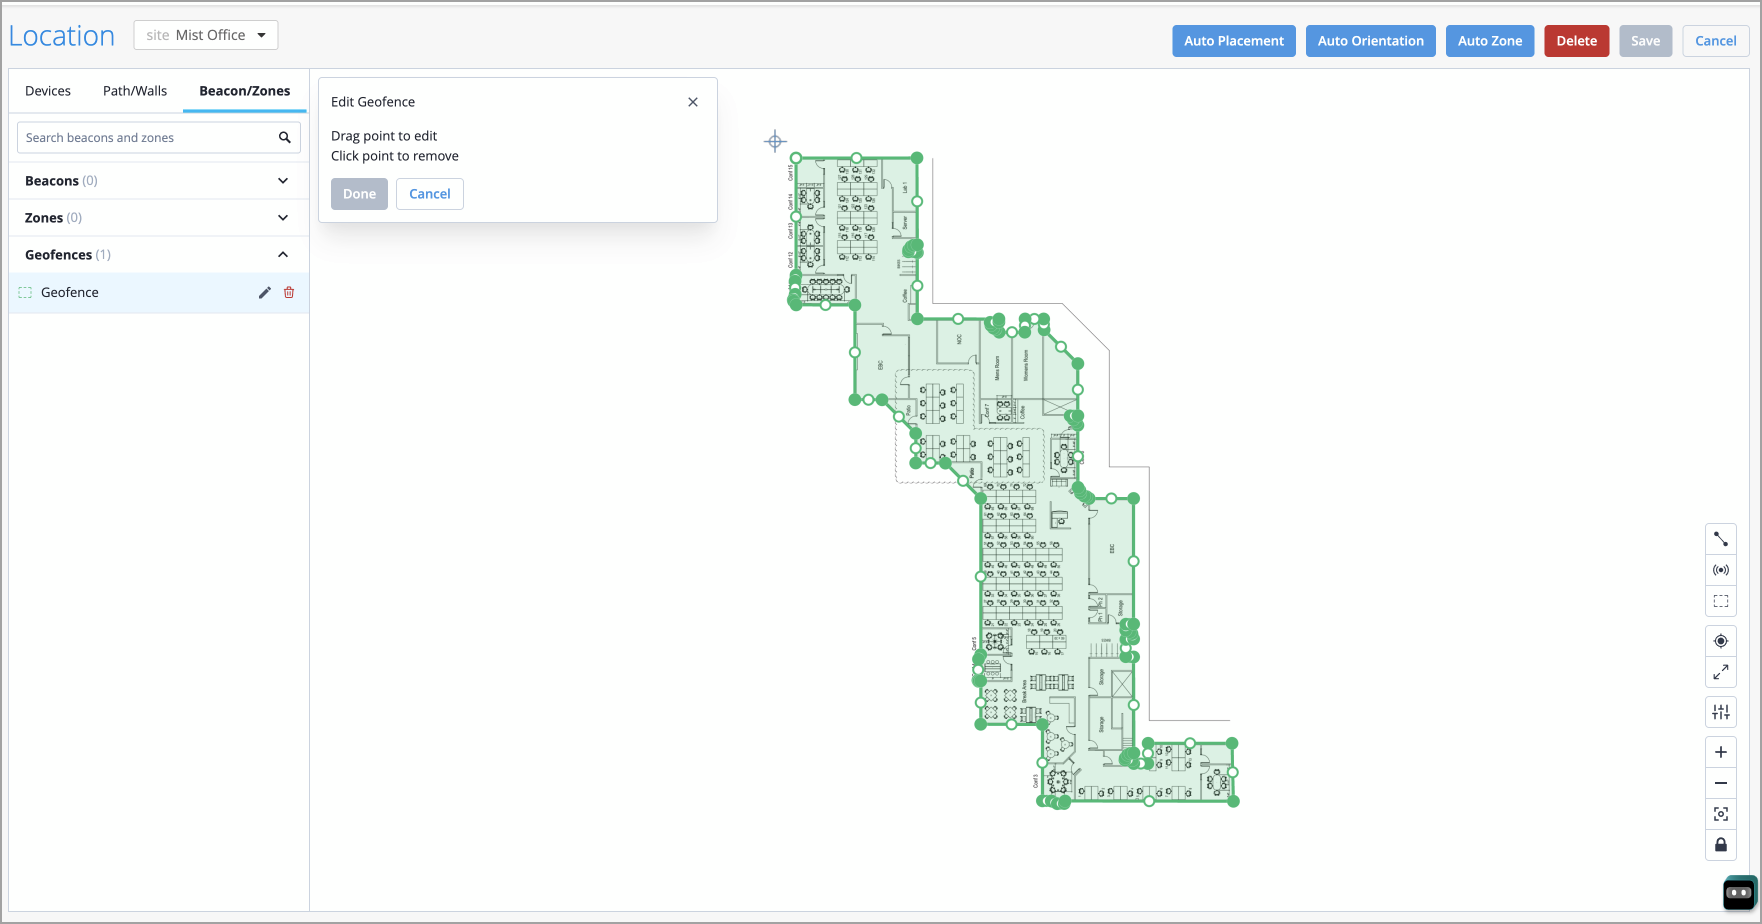
Juniper Mist Location Services now supports automatic generation of geofence or Inclusion Zone for floor plan boundaries. This feature prevents tracked entities from appearing outside the building due to XY-coordinate estimation errors.
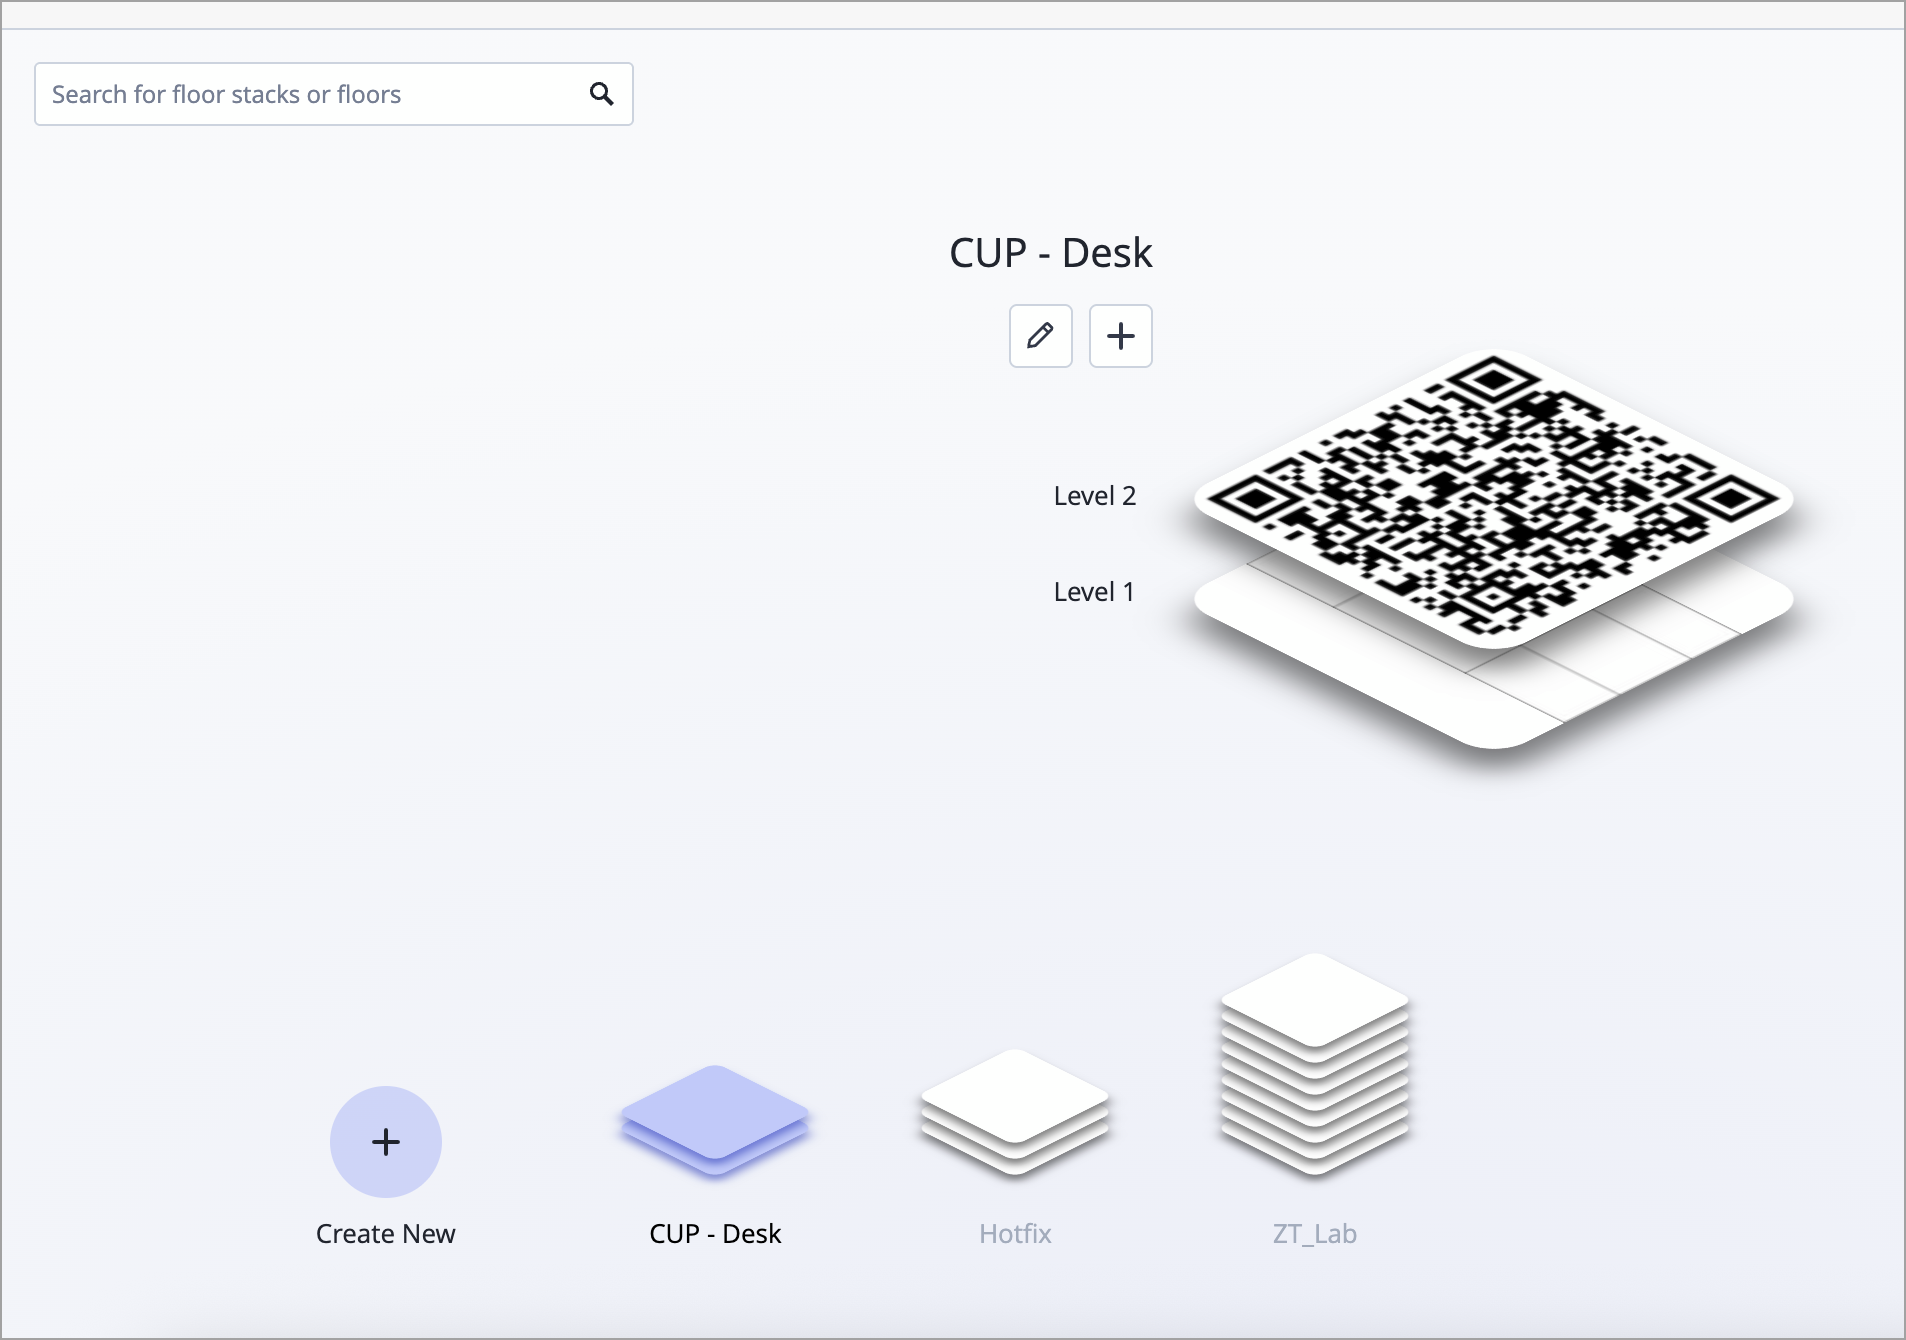
With automatic geofence support on the floor plan image perimeter, when you upload a new floorplan to the Mist Location Live View, the system automatically detects the building outline and creates an Inclusion Zone—a virtual boundary that ensures location estimates stay within the building. Existing floorplans are not impacted. For existing deployments, you can use the Re-run Geo-Fence option to refresh zone boundaries without a full site reconfiguration.
Geofencing helps you ensure that a user is within your facility or coverage area before offering them service. This feature supports tracking the following entities:
Connected Wi-Fi Clients
Named Assets
SDK Clients
BLE (Bluetooth)
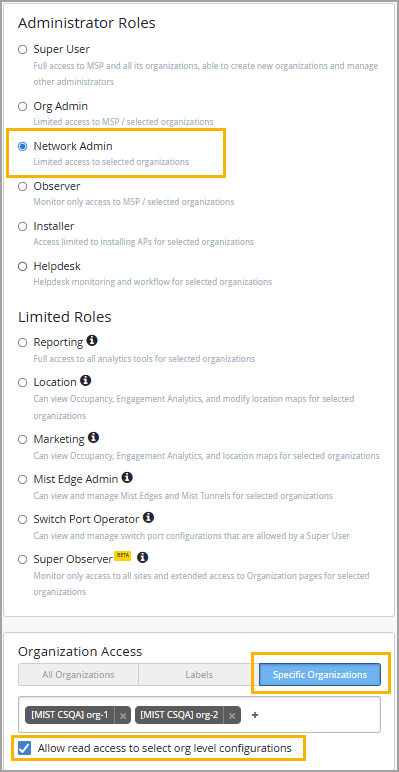
We have added support for the Network Admin role with specific organization scope to the Mist Managed Service Provider (MSP) portal. This role provides write access to all site-level pages for the selected organizations and optional read-only access to organization-level pages. Support for assigning access at the following scopes is not currently available: All Organizations and Labels.
The new role is available for selection when you invite new admin users. When you invite a user with Network Admin role, you can select one or more organizations to grant the user write access to the site-level pages within the selected organization. Optionally, you can select the Allow read access to select org level configurations check box to grant the user read access to certain organization-level pages.
managed and disable_auto_config attributes deprecatedTo simplify device management in the Mist API, we have deprecated the following two attributes in the device configuration object (/api/v1/sites/{site_id}/devices/{device_id}), effective January 2026:
managed—Previously used for adopted switches to indicate if they were managed by Mist (default: false). Setting this to true enabled Mist management for adopted switches.
disable_auto_config—Previously used to disable the default behavior of cloud-ready switches being managed by Mist. Setting this to true meant the device would not be managed by Mist.
We have also merged these two attributes into mist_configured, as shown below:
mist_configured: true—Configures the device to be managed by Mist.
mist_configured: false—Means that Mist does not manage the device.
During the transition, the GET /api/v1/sites/{site_id}/devices/{device_id} object will return mist_configured: true/false along with managed (for adopted devices) and disable_auto_config (for claimed devices) for backward compatibility.
Please update your integrations to use mist_configured going forward.