Monitor and Troubleshoot Live Zoom Meetings
Use these instructions to monitor and troubleshoot your live Zoom meetings using the Live Debug feature.
Live Debug is a real-time monitoring and diagnostic tool that enables you, as a network administrator, to observe ongoing Zoom meetings. It provides detailed visibility into participant Quality of Service (QoS) metrics—including latency, jitter, and packet loss—and helps correlate performance issues with specific client or site conditions. With Live Debug, you can proactively investigate ongoing quality problems, monitor critical meetings, and review recent incidents to identify root causes and validate corrective actions.
To debug live Zoom meetings:
-
On the List subtab, identify the meeting that needs troubleshooting and click the
Process button to start a live debug capture.
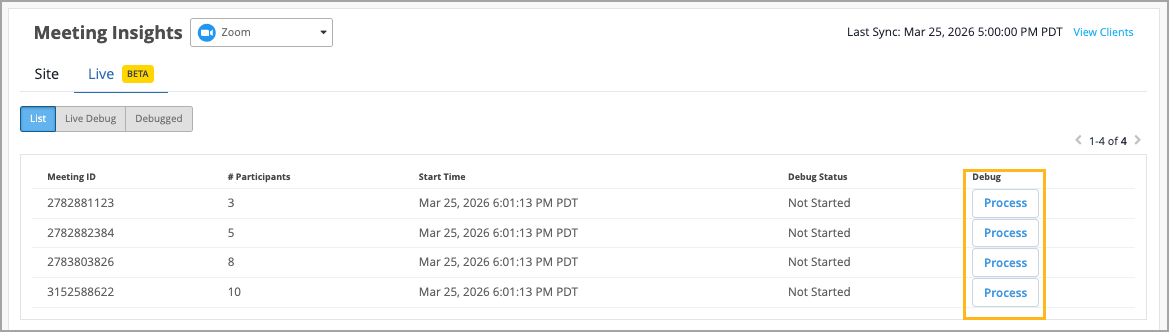
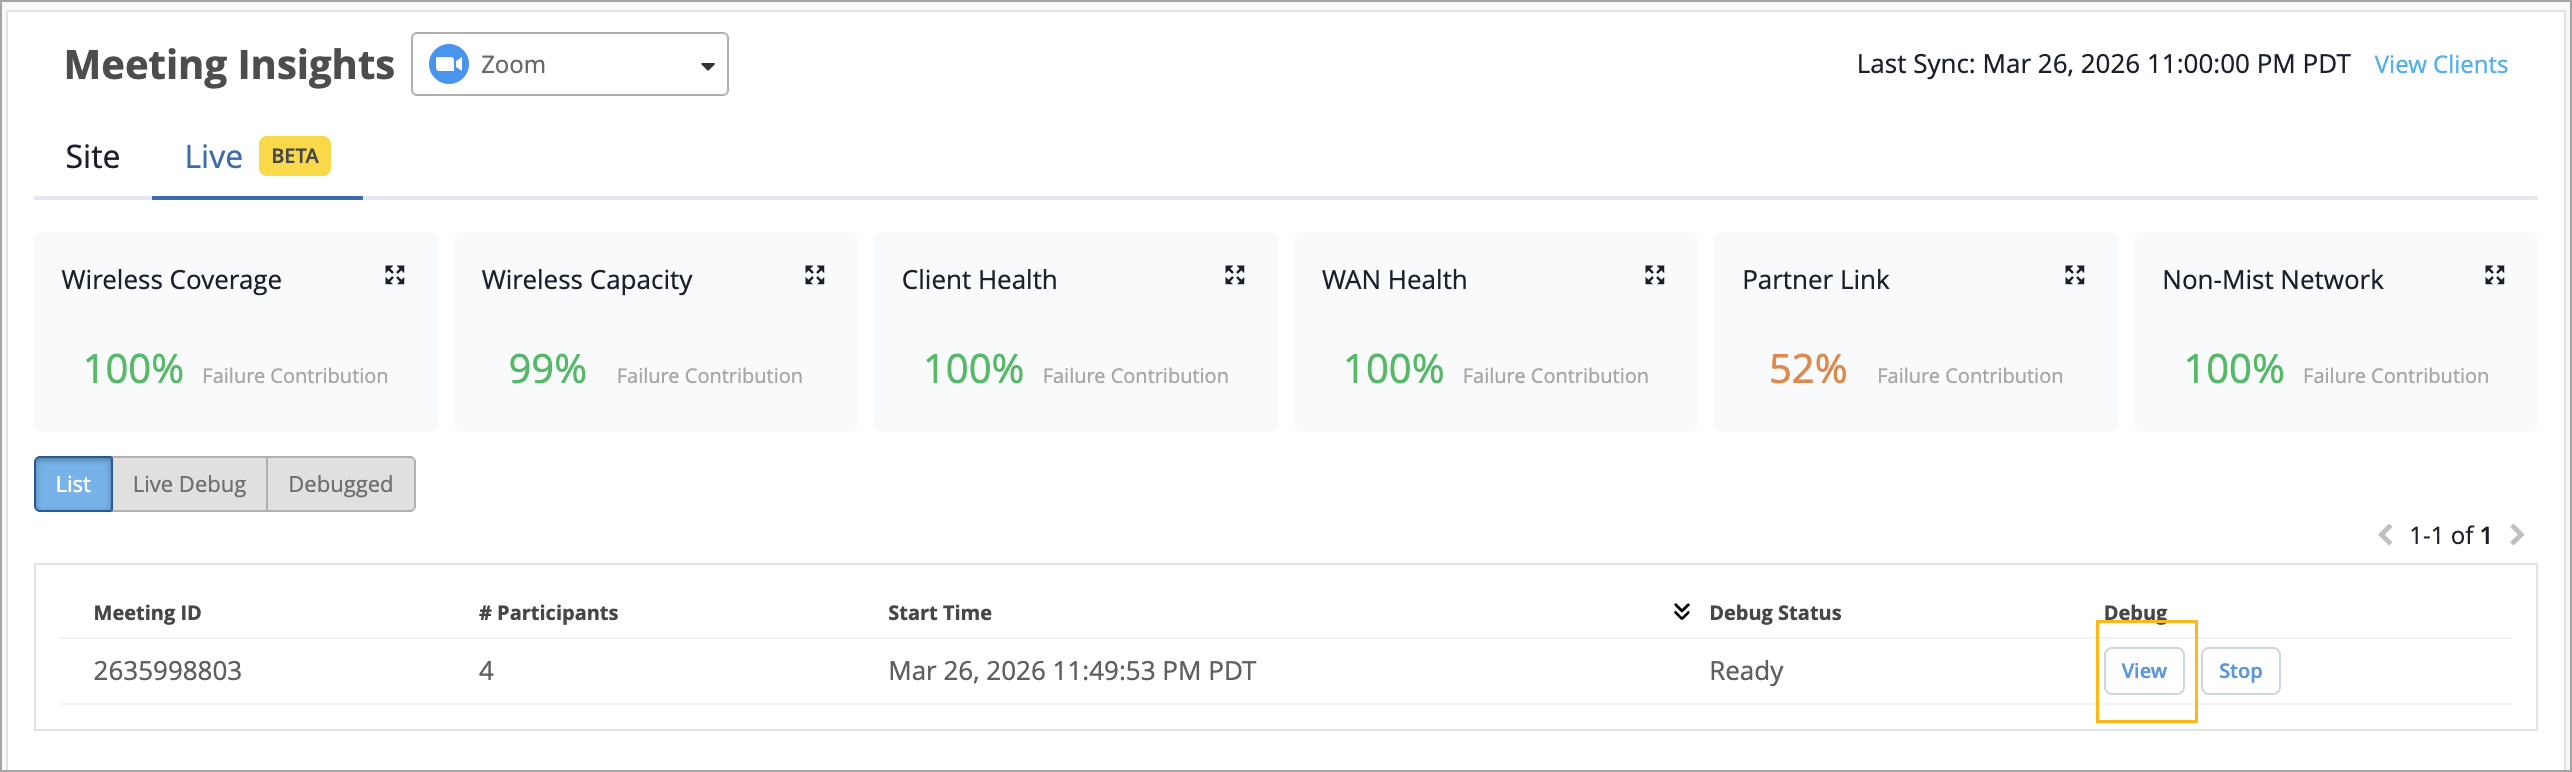
It takes one to two minutes for the captured data to become available, at which point the debug status is shown as Ready, options to view the captured data and stop the capture become available, and a set of SLE metrics that give insight into the connection health are displayed.
-
To view the captured live debug data, click the View button that
appears near the Process button two minutes after the data capture was initiated.
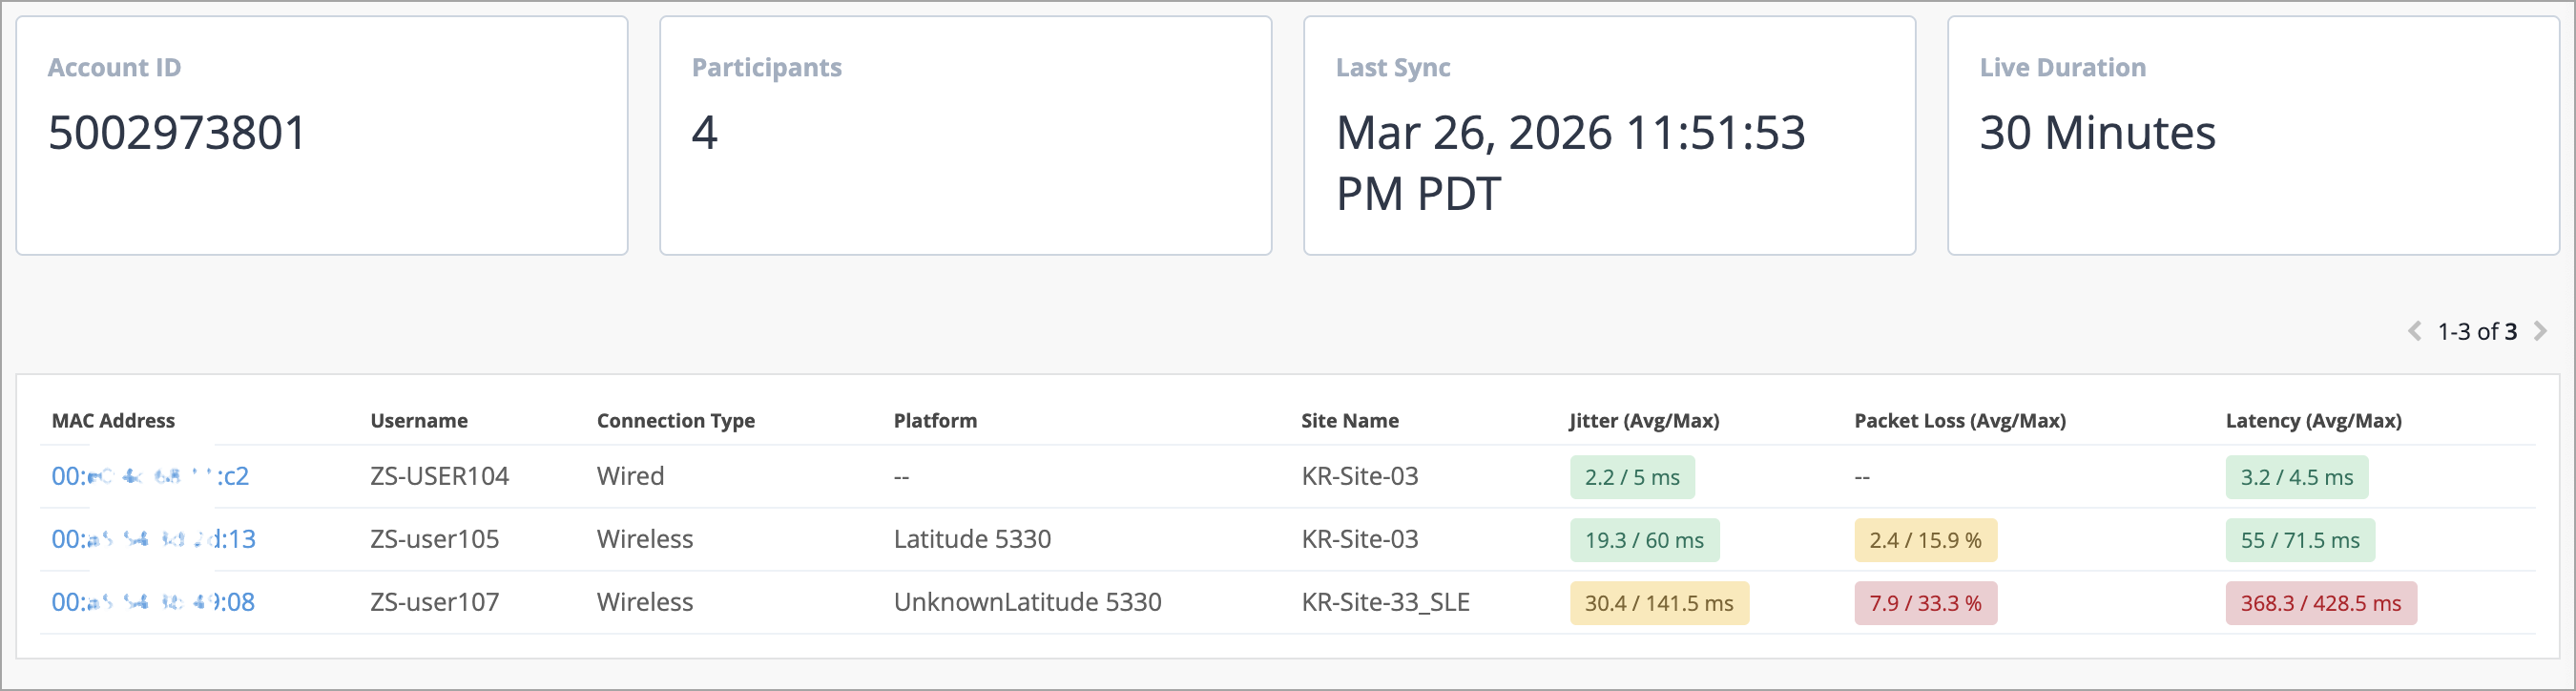
The live debug dashboard is displayed. The debug capture runs for 30 minutes. Refresh your browser to view the most recent updates.
If the meeting ends before that, the capture stops automatically. If you want to stop the live debug data capture manually, click the Stop button which appears alongside the View button. When the capture stops, the session moves to the Debugged subtab so you can revisit it later.
-
From the dashboard, you can:
-
Verify the key details such as meeting ID, number of participating devices, and client MAC addresses.
-
Check if the per-client QoS metrics (latency, jitter, and packet loss) are causing any issues.
-
Click the client MAC address hyperlink to quickly navigate to Client Insights and investigate and resolve connection issues reported by each client.
-