April 01, 2026
New and Updated Features
This section describes the new and updated features released in Juniper Data Center Assurance.
Network Sustainability Analytics
As networks expand to handle increasing bandwidth demands, energy consumption rises proportionally, leading to higher operational costs and a greater carbon footprint. To address this challenge, organizations set goals to optimize power usage and reduce emissions. Real-time visibility into energy consumption and emission data, along with actionable recommendations and potential energy savings insights can help organizations achieve their sustainability goals.
Juniper Data Center Assurance provides the Network Sustainability Analytics feature to help administrators monitor, analyze, and optimize energy consumption across their network infrastructure.
To access this feature, from the main menu click Sustainability.
To view insights in the Sustainability dashboards in Juniper Data Center Assurance, ensure the following:
-
Network Sustainability Analytics feature is enabled for your organization. To enable the feature for your organization, contact your designated HPE Networking representative. After the feature is enabled, it can take up to a day for Sustainability data to appear on the dashboards.
-
The Apstra Edge is onboarded to Juniper Data Center Assurance. You can verify the Edge status from the DC Edges page. See, Adopt Juniper Apstra Edge.
-
Verify that devices and software versions meet the supported requirements to enable the Network Sustainability Analytics feature. See, Sustainability: Supported Platforms and Software Versions.
-
Sustainability settings, such as average power cost, carbon intensity, and port utilization thresholds are correctly configured. These parameters help generate accurate sustainability analytics across the organization and its sites.
See, Configure Sustainability Settings for the Organization, Configure Port Threshold for the Organization.
The Sustainability dashboard offers the following capabilities:
-
Observability—Provides granular visibility into sustainability metrics across organization, site, and device levels.
-
Insights on Sustainability Metrics—Provides utilization trends and AI-generated forecasts based on historical data for SBTi compliance reporting.
-
Energy Optimization Recommendations—Provides actionable recommendations to transition from an “always-on” to an “on-demand” network model.
-
Potential Energy Savings—Provides estimated savings in energy, cost, and emissions to help evaluate the optimization potential of your network infrastructure.
The following sections describe the key Sustainability features that Data Center Assurance provides:
- View Actionable Sustainability Insights for the Organization
- View Actionable Sustainability Insights for Sites
- View Actionable Sustainability Insights for Devices
- Review Recommendations to Optimize Energy Consumption
- Multiple Currency Support
- Review the Sustainability Report
- Evaluate Potential Energy Savings
- Configure Port Utilization Threshold
View Actionable Sustainability Insights for the Organization
Use the Organization-Level Sustainability Dashboard to gain comprehensive visibility into an organization's energy profile.
Use the dashboard to:
-
Monitor and understand organization-wide energy usage and GHG emissions
-
Identify high-impact opportunities for energy optimization
-
Prioritize sites that contribute most to overall energy consumption
-
Estimate the sustainability benefits achievable through optimization actions
-
Review the organization's Sustainability Report to evaluate actual and historical energy data and AI-generated energy forecasts and use it to support SBTi planning and sustainability reporting
View Actionable Sustainability Insights for Sites
Use the Site-Level Sustainability Dashboard to gain comprehensive visibility into a site's energy profile.
Use the dashboard to:
-
Monitor current and historical site-level energy consumption and GHG emissions
-
Evaluate potential savings in energy, cost, and emissions across different time ranges. Also, identify the recommendation type, device, or Junos OS version installed on the device that contributes most to these estimated savings.
- Analyze site-level energy efficiency trends using power-versus-throughput visualizations to understand how energy usage correlates with network load over time.
- Visualize the site’s network fabric and compare devices across energy, emission, and thermal metrics.
- Identify top devices in the site based on key energy metrics to evaluate their contribution to overall site energy usage.
- Review the site’s Sustainability Report to evaluate actual and historical energy data and AI-generated energy forecasts and use it to support your organization’s SBTi planning and sustainability reporting.
View Actionable Sustainability Insights for Devices
The Device-Level Sustainability Dashboard provides granular visibility into the energy usage of individual network devices in your data center.
The dashboard includes four dedicated views to help you monitor device behavior, detect inefficiencies, and improve device-level energy utilization.
- Use the Overview tab to view a device’s real-time and historical power usage, energy consumption, GHG emissions, power cost, potential energy savings, and historical power and throughput trends. Review current and forecasted port traffic patterns to identify idle or underutilized ports.
- Use the Power Supply tab to monitor a device's power module health, redundancy, input-feed status, and device's power capacity and utilization.
- Use the Thermal Profile tab to analyze a device’s temperature trends, fan activity, top thermal sensors by deviation, and power trend impact on cooling.
- Use the Recommendation tab to review data-driven, device-specific energy optimization suggestions that highlight opportunities to reduce idle power draw and improve sustainability.
Review Recommendations to Optimize Energy Consumption
Network Sustainability Analytics feature provides device-level energy optimization recommendations and the potential energy savings for each action. These recommendations help conserve energy, reduce carbon emissions, and save on operational costs.
You can view the recommendations on the Recommendation tab of the Device-Level Sustainability Dashboard.
You can get energy optimization recommendations at the line card, PFE, and port levels.
The following energy optimization recommendations are available in this release:
- Optimize energy consumption by shutting down unused ports—The Device Port Power Optimization recommendation lists unused ports on a device based on operational state and traffic patterns. It provides actionable guidance, including associated benefits and risks, along with relevant configlet-based actions, to safely disable ports and reduce idle power consumption.
-
Optimize low-traffic ports based on historical traffic patterns—The Low-Traffic Port Optimization recommendation lists low utilization ports based on historical traffic patterns and provides actionable guidance, including observed low-traffic windows and relevant configlet-based actions to temporarily disable ports and reduce idle power consumption.
[See, Optimize Low Traffic Ports Based on Historical Traffic Patterns.]
-
Optimize low-traffic ports based on forecasted traffic patterns—The Forecasted Low Traffic Port Shutdown recommendation lists low utilization ports based on forecasted traffic patterns and provides actionable guidance, including predicted low-traffic windows and relevant configlet-based actions to temporarily disable ports and reduce idle power consumption.
[See, Optimize Low Traffic Ports Based on Forecasted Traffic Patterns.]
-
Optimize Energy Consumption by Shutting Down Unused Line Cards—The Device Linecard Power Optimization recommendation lists unused line cards and provides actionable guidance to reduce chassis-level power consumption.
[See, Energy Optimization Recommendation for Unused Line Cards.]
-
Optimize Energy Consumption by Shutting Down Unused PFEs—The Device PFE Power Optimization recommendation lists unused Packet Forwarding Engines (PFEs) and provides actionable guidance to reduce forwarding-plane power consumption.
Multiple Currency Support
Average power cost can be configured based on your preferred currency.
At the organization-level, you can set a currency unit that aligns with your regional, compliance, or financial reporting requirements. This currency unit is automatically applied to all sites within the organization.
To set the currency, navigate to Organization > Settings > Sustainability.
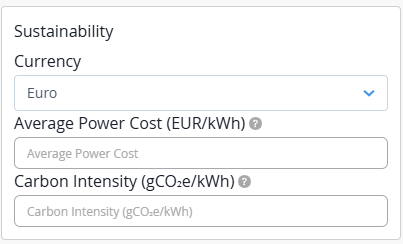
[See, Configure Sustainability Settings for the Organization.]
Review the Sustainability Report
The Sustainability Report provides a consolidated view of an organization’s energy performance over a selected time range. It combines actual usage, historical trends, cumulative yearly metrics, and AI-based forecasts to help track and evaluate energy consumption, GHG emissions, and energy costs over time.
The report enables rolling twelve-month analysis, year-over-year comparisons, and seamless visibility into historical and projected performance.
The report is available at both organization and site levels. Use the report to support your sustainability planning, assess alignment with Science Based Targets initiative (SBTi) goals, and enable consistent reporting across sites and the organization.
[See, Review the Sustainability Report.]
Evaluate Potential Energy Savings
The Potential Energy Savings feature provides insights into the potential savings your network infrastructure can achieve. These insights help you evaluate the reductions in energy consumption, operational costs, and carbon emissions that are possible if you apply all available recommended optimization actions.
Use this data to understand the expected impact of optimization actions before applying them.
You can view estimated savings at the organization, site, and device levels.
Configure Port Utilization Threshold
You can configure percentage-based utilization thresholds to classify device ports as Low, Medium, or High utilization. Thresholds apply globally by default, and can be overridden by configuring port thresholds at the site level for specific sites. The system provides default thresholds inferred from historical traffic and usage patterns, which administrators can customize as needed. The threshold values are used to render per-port traffic heatmaps and to generate accurate energy optimization recommendations at the port and line card levels.
To configure port threshold at the organization level, Organization > Settings > Port Traffic Threshold.
[See, Configure Port Threshold for the Organization.]
To configure port threshold at the site level, Organization > Site Configuration > Port Threshold.
[See, Configure Port Threshold for the Site.]
To troubleshoot issues related to availability of Sustainability data, see Network Sustainability Analytics— Troubleshooting.