ON THIS PAGE
Problem: Sustainability Data For Extended Periods Is Not Available
Problem: Data for Certain Months Unavailable in Sustainability Report
Problem: Recommendations Unavailable After Enabling Sustainability Settings
Problem: Line Card and PFE Shutdown Recommendations Unavailable
Problem: Port Type Differentiation Not Accurate (Fabric vs Server)
Network Sustainability Analytics — Troubleshooting
This topic helps you troubleshoot issues related to availability of sustainability data.
To view sustainability data, you must enable the Network Sustainability Analytics feature for your organization and configure the required settings. After the feature is enabled, it may take up to 24 hours for sustainability data to be available on the dashboards. For assistance, contact your designated HPE Networking representative.
Problem: Sustainability Data Unavailable
Description
Dashboard does not display sustainability data.
Solution
Verify the Apstra Edge version.
Sustainability features are supported only with Apstra Edge version 0.45.5 or higher.
If Apstra Edge is just onboarded and the status is displayed as Registered and Connected, wait for some time.
It might take over an hour for sustainability data to be available on the dashboard. For more information, see Verify DC Assurance Setup.
Problem: Potential Energy Savings Data Unavailable
Description
The Potential Energy Savings widget shows no data across the organization, sites, and device Sustainability dashboards.
Solution
The projections on the Potential Energy Savings widget depend on the configured Average Power Cost and Carbon Intensity values, and the energy optimization recommendations.
Verify that the following values are set:
-
Configure the power cost per unit either on the Organization Settings page or on the Site Configuration page.
-
Modify the Carbon Intensity (gCO₂e/kWh) value as required either on the Organization Settings page or on the Site Configuration page. If Carbon Intensity is not configured, the default value of 443 will be used.
For more information, see Configure Sustainability Settings for the Organization, Configure Sustainability Settings for a Site.
The recommendations used to calculate potential savings require sufficient data before results begin to appear.
- Unused component (ports, line cards, PFEs) recommendations require at least 24 hours of data.
- Low usage port recommendations require up to 3 days of data.
- Forecast based recommendations may require up to 15 days of data after Edge onboarding or upgrade to generate relevant recommendations and potential savings data.
Once the required inputs are provided and sufficient data is available, the system can generate relevant optimization recommendations and provide meaningful potential savings insights.
Problem: Power Cost Displayed as 0
Description
Power cost is displayed as 0 on the Sustainability dashboards.
Solution
Configure the power cost per unit either on the Organization Settings page or on the Site Configuration page. For more information, see Configure Sustainability Settings for the Organization, Configure Sustainability Settings for a Site.
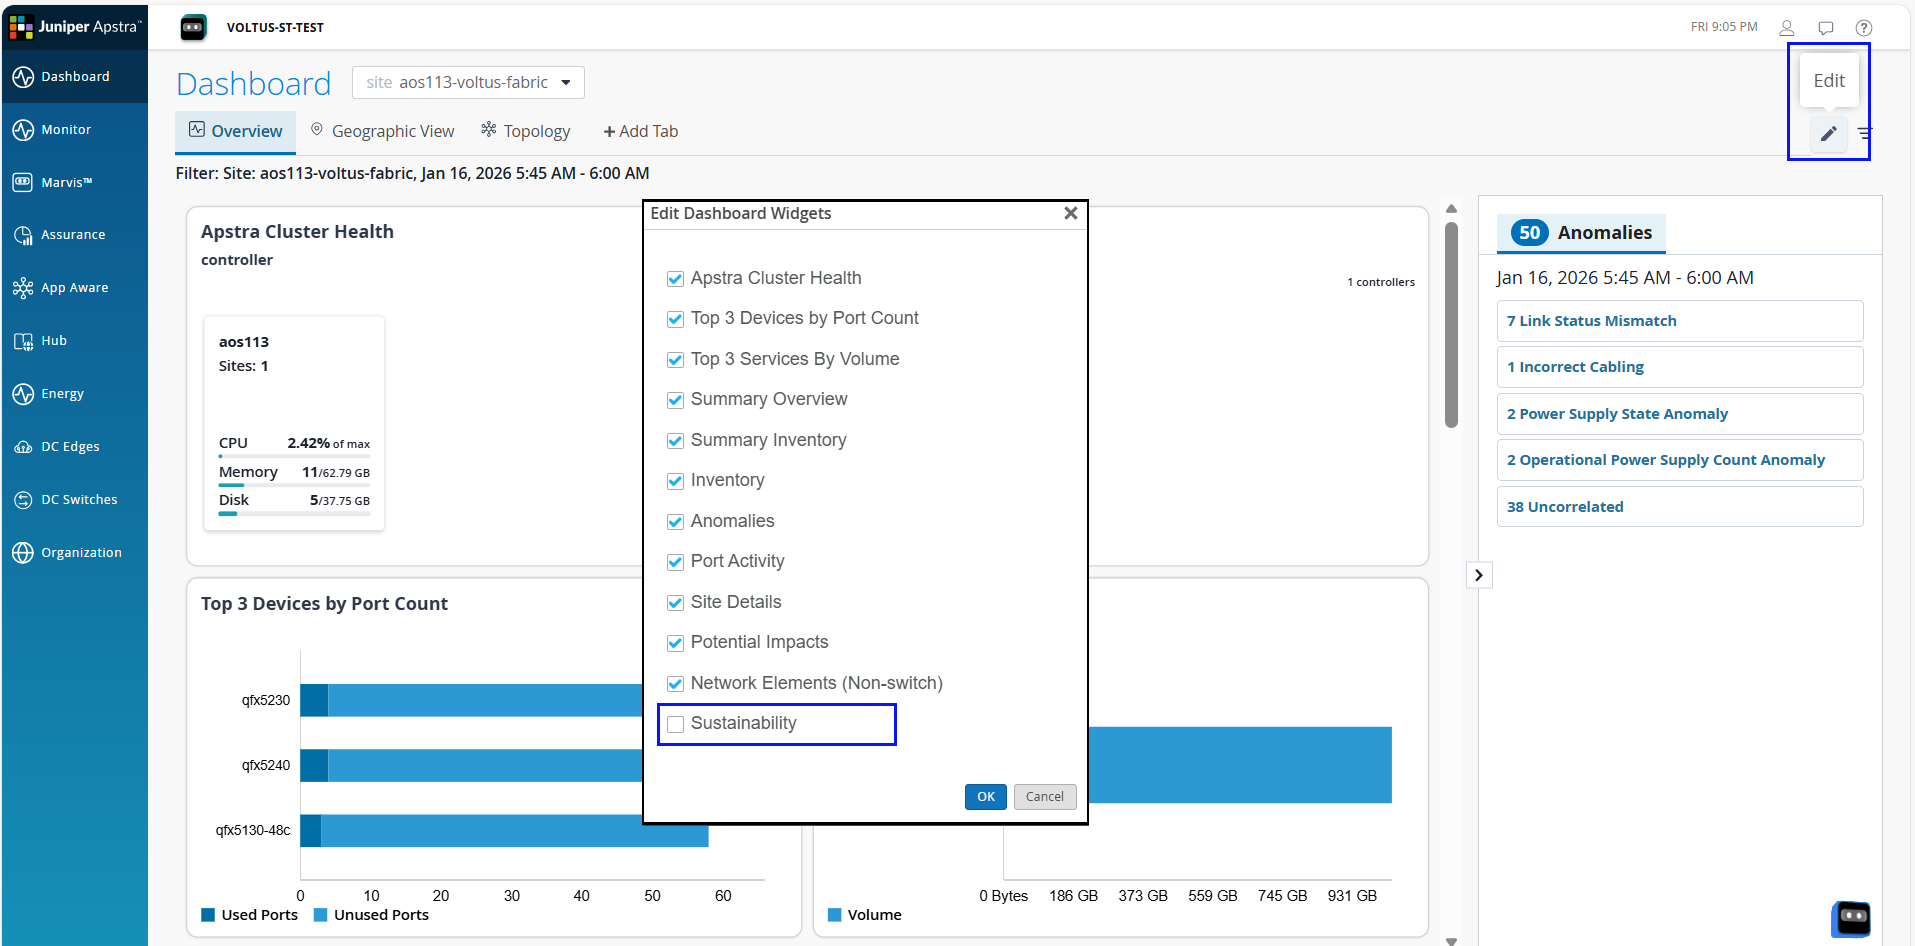
Problem: Sustainability Widget Unavailable on the Dashboard
Description
The DCA Dashboard does not display the Sustainability widget.
Solution
Click the Edit icon and select Sustainability from the list of widgets to be displayed on the Dashboard as shown in Figure 1.
Problem: Sites Not Displayed in Map View
Description
Sites are not displayed in the map view of the Organization-Level Sustainability Dashboard.
Solution
Click Organization > Site Configuration and select the site.
In the Location tile, enter the latitude and longitude for the site.
For more information, Edit Site Configuration.
Problem: Sustainability Data For Extended Periods Is Not Available
Description
Sustainability data for extended periods (daily, weekly, or monthly patterns) is not visible or appears incomplete.
Cause
Data availability for recently onboarded or upgraded Apstra Edge may be delayed, even when the device status shows Registered and Connected.
Data may also be unavailable due to connectivity issues across different scopes.
-
At the organization level, insights may be missing if Apstra Edge is unavailable or if the available Apstra blueprint is incorrect.
-
At the site level, data gaps may result from Edge or cloud connectivity issues.
-
At the device level, insights may be missing if device status is not reflected correctly on the DC Edge page or if the device is listed as not connected.
Sustainability data is generated from historical data, and availability depends on the system completing the required data aggregation over selected time windows.
Problem: Data for Certain Months Unavailable in Sustainability Report
Description
The Sustainability report does not display data for certain months.
Cause
The Sustainability report shows energy data from the date on which sustainability feature is enabled for your organization. For example, if sustainability feature is enabled on July 15, the Sustainability report displays historical and forecasted data from July 15 to December 31 for that year. For more information, see Review the Sustainability Report.
Problem: Incorrect Data Displayed When Selecting Today
The Sustainability dashboards may display inaccurate data if Today is selected in the time range selector.
Description
When you select Today from the time range selector, the data displayed may include extra hours or show fewer hours than expected.
Cause
The system uses UTC to determine the current day, while you may be located in a different time zone. This time zone difference causes the system’s definition of Today (based on UTC) to not align with the your local calendar day. As a result, you may see extra hours of data or fewer hours of data, depending on your local time zone.
Problem: Recommendations Unavailable After Enabling Sustainability Settings
Description
Recommendations are not displayed immediately after enabling the Network Sustainability Analytics feature.
Cause
Recommendations are generated after periodic data collection. If sufficient data is not yet available, certain recommendations may not appear.
After enabling the Network Sustainability Analytics feature (Day 0):
-
Unused port recommendations require atleast 24 hours of data.
-
Low traffic port recommendations require one week of data and will be generated after seven days.
-
Forecast based recommendations require atleast 14 days of data.
Recommendations are generated daily at around 3:00 AM UTC and continue to improve as more data becomes available. For more information, see About the Recommendation Tab.
Problem: Line Card and PFE Shutdown Recommendations Unavailable
Description
Line card and PFE energy optimization recommendations are unavailable.
Solution
The line card and PFE recommendations are supported on platforms with multipe line cards. Currently, the recommendations are supported on the following platforms: PTX10016, PTX10008, PTX10004, PTX10001-36MR.
The recommendation service runs once per day and uses the historical forwarding-plane telemetry and device configuration data available at that time. Changes in traffic demand or redundancy configuration are reflected after the next run.
Problem: Most Ports Shown in Light Green or Gray
Description
In Per Port - Peak / Off-Peak Traffic Monitoring, most of the ports are shown in light green or gray. No port is highlighted in dark green.
Solution
By default, the threshold for low traffic is set at 10% and high traffic at 80%. Depending on your network requirements, you can configure traffic threshold at the site level or at the organization level from the Organization Settings or Site Configuration pages, respectively. For more information, see Configure Port Threshold for the Organization, Configure Port Threshold for a Site.
Problem: Multiple Currency Support Issue
Description
The Currency setting is not displayed at the site-level or appears as USD instead of the expected currency.
Solution
-
The currency configured at the organization-level is applied to all sites in the organization. Ensure that the configured currency aligns with your regional, compliance, or financial reporting requirements.
-
If the currency is not explicitly configured, the system defaults to USD.
Problem: Port Type Differentiation Not Accurate (Fabric vs Server)
Description
Port differentiation (Fabric vs Server) data is incorrect, missing, or not displayed for the energy optimization recommendation.
Cause
Port type differentiation is shown on the recommendation panel only for ports that are connected.
The port classification data is derived from Apstra blueprint.
The port type (Fabric vs Server) may not be shown on a recommendation if the port is not connected, if the blueprint data is incorrect or incomplete, or if there are connectivity issues with Apstra Edge.
Problem: Efficiency of PEM Shown as N/A
Description
In the Power Supply Modules widget, Efficiency is shown as N/A for PEM.
Cause
Power supplies of type PEM do not provide input power data. Hence, efficiency cannot be calculated for PEMs.