Review the Sustainability Report
Use this topic to understand how to evaluate sustainability reports at both the organizational level and at an individual site level.
The Sustainability Report provides the visibility required to plan, track, and meet your organization's Science Based Targets initiative (SBTi) goals. The report summarizes actual and historical energy performance and uses AI-based forecasting to project future usage, energy cost, and emissions for the selected time range, supporting flexible, time-based analysis. By default, the report displays data for the current calendar year.
The report is available at both the organization and the individual site levels. The organization-level report is aggregated from all the sites in the organization.
By combining actual usage, cumulative yearly metrics, historical trends, and AI-based forecasts, the Sustainability Report helps support long-term sustainability planning and reporting at both the organization and site levels.
The Sustainability Report distinguishes between two types of greenhouse gas emissions:
Operational Emissions—Emissions generated from energy consumption during device operation. These emissions vary over time based on network activity and workload. The GHG Emissions metric card and corresponding trend chart represent operational emissions.
Non-Usage Emissions— Emissions associated with the lifecycle of network devices, including manufacturing, transportation, and end-of-life disposal. These emissions are independent of day-to-day device operation and are reported separately in the Emissions from Non-Usage Product Lifecycle Phases section of the report.
Together, operational and non-usage emissions provide a more complete view of the carbon footprint. Reviewing both metrics helps support sustainability planning, infrastructure lifecycle management, and hardware procurement decisions.
When reviewed together, the organization-level and site-level sustainability reports provide a clearer view of your network’s overall energy profile. The organization-level report highlights high-level trends, while the site-level reports provide granular visibility into the underlying factors. This combined view helps identify where corrective actions are required and whether they should be addressed at an individual site-level or across multiple locations in the organization.
To review Sustainability Report for the organization, click the Sustainability Report icon in the top-right corner of the Organization-Level Sustainability Dashboard to open the organization's sustainability report.
To review Sustainability Report for a site, click the Sustainability Report icon in the top-right corner of the site's Site-Level Sustainability Dashboard to open the site's sustainability report.
Click the Download icon in the top-right corner to export the report in CSV format. This allows you to integrate the data with internal compliance systems and to customize the data to suit your organization's specific reporting needs.
The Sustainability Report is organized into the following sections:
Metric Cards
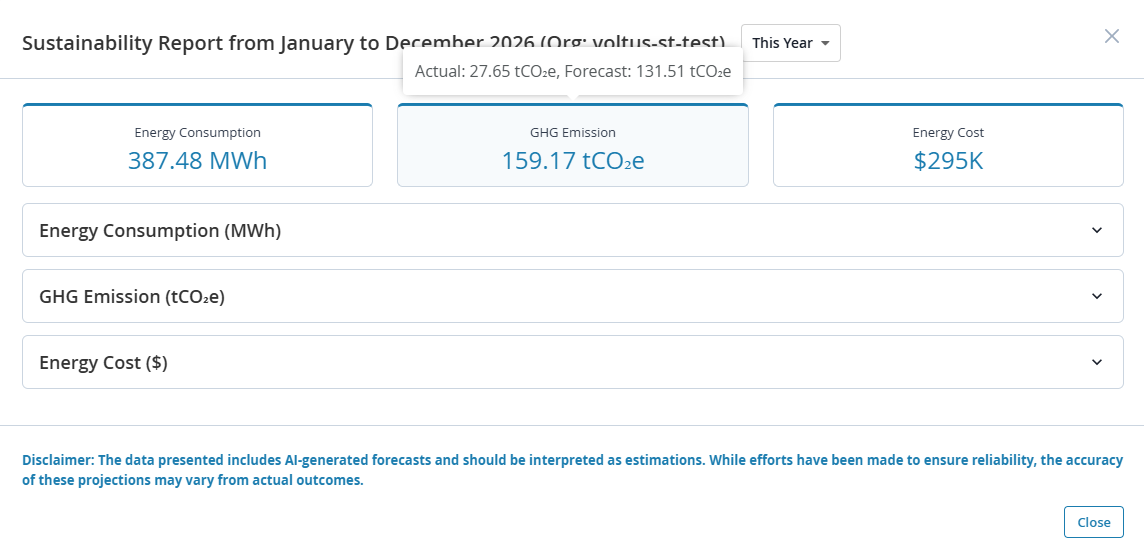
The metric cards display the cumulative expected values for energy consumption, GHG emissions, and energy cost for the selected time range.
Hover over a metric card to view the breakdown of actual and forecasted values that make up the cumulative total.
Actual values are shown only for past periods. If the selected time range includes future months, only forecasted values are displayed for those months.
Figure 1 shows the cumulative GHG emissions and the breakdown of actual and forecasted values for the current calendar year.
Click a metric card to expand the corresponding accordion to view the monthly trend charts for the selected time range.
Trend Charts
The trend chart provides a month-by-month view of the historical and forecasted values for the selected energy metric (Energy Consumption, GHG Emission, and Energy Cost) for the selected time range. Figure 2 shows the yearly historical and forecasted energy consumption trends.
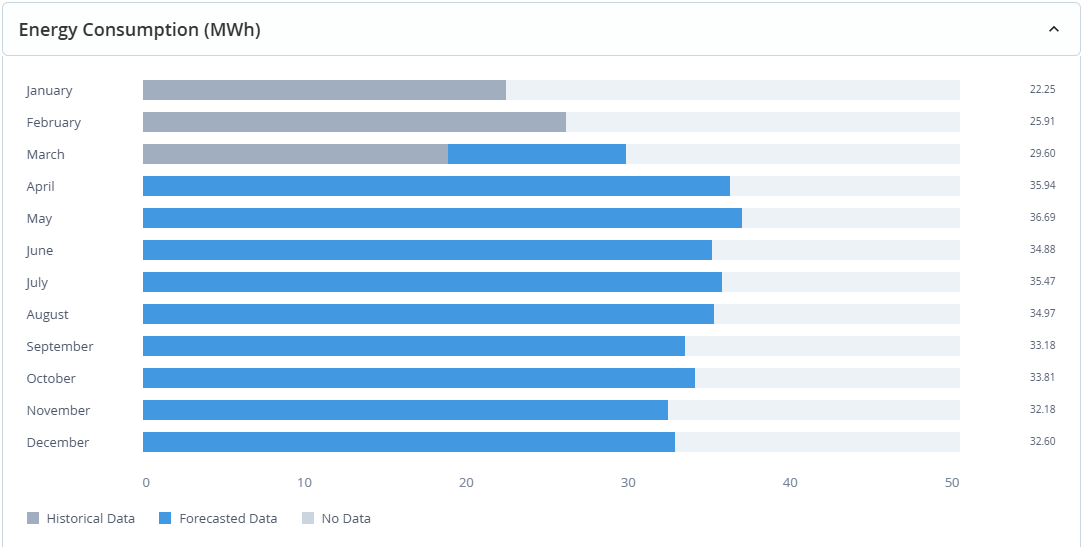
The months are listed on the left and the selected metric's value is listed on the right.
Each row contains a horizontal bar on which the historical data appears in grey and forecasted data in blue. Hover over the bar to view the individual historical and forecasted values for that month. The value displayed on the right represents the cumulative total of the historical and forecasted values.
Time periods without data appear blank.
Forecasted values are AI-generated estimates based on available historical data. While efforts have been made to ensure reliability, accuracy may vary depending on workload shifts, configuration changes, and site-level factors.
Non-Usage Emissions
The Sustainability Report includes non-usage emissions, which represent lifecycle greenhouse gas emissions associated with network devices. These include emissions from manufacturing, transportation, and end-of-life disposal, and are independent of operational energy consumption.
Expand the Non-Usage Emissions section to view detailed contributions from each phase. The report displays the total non-usage emissions in kgCO₂e and breakdown of emissions by lifecycle phase.
Time Range Selection
The Sustainability Report includes a Time Range Selector that allows you to view data across different periods.
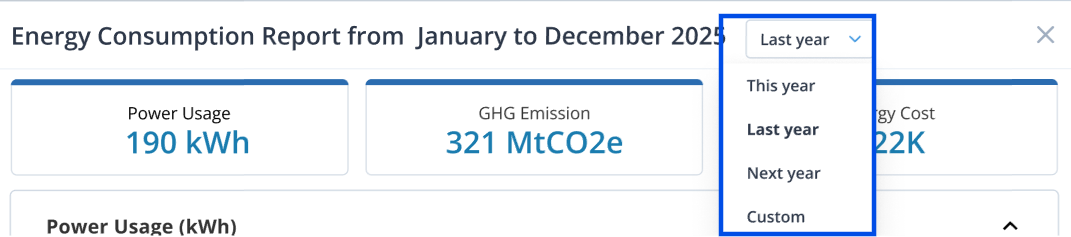
You can select This Year, Last Year, Next Year, or define a Custom Range. By default, the report displays data for This Year.
-
This Year displays data for the full calendar year, from January to December.
-
Next Year appears in the drop-down after the current date passes the midpoint of the current year.
-
Last Year appears in the drop-down only if historical data is available through January of the current calendar year.
-
When selecting a custom date range, choose a minimum of 3 months to ensure your sustainability report contains meaningful data.
The selected time range applies to all metric cards and trend charts within the report. This enables analyzing rolling twelve-month performance, comparing year-over-year results, tracking improvements across reporting cycles, and gaining seamless visibility into historical and projected performance.
Benefits of Using the Sustainability Report
Use the report to:
-
Visualize and review the actual and forecasted GHG emissions, energy consumption, energy cost for a selected time range. Flexible, time-based reports allow alignment with internal sustainability reporting cycles
-
Export the report in CSV format to integrate with your organization's reporting needs
-
Identify annual trends and periods of high energy use
-
Anticipate potential increases in energy consumption, cost, or emissions using forecasted values
-
Assess alignment with SBTi goals using projected performance
-
Prioritize energy optimization and sustainability initiatives using data-driven insights
-
Understand total lifecycle environmental impact, including both operational and non-usage emissions
-
Share insights with internal sustainability teams, auditors, or stakeholders