Configure Port Threshold for the Organization
Administrators can use the Port Threshold setting to define the traffic utilization thresholds for device ports. Utilization is the percentage of traffic the port carries relative to its operating capacity. The thresholds are set as percentage ranges and determine whether the port utilization is high, medium, or low.
Use the widget to define percentage ranges that classify port usage levels. By default, threshold for low traffic is set at 10% and high traffic at 80%.
The system uses these utilization ranges to classify port behavior in Per Port Peak / Off-Peak Traffic Monitoring heatmap and to generate current and forecasted low traffic port optimization recommendations.
For port utilization description, see Table 1.
| Utilization | Description |
|---|---|
| Low | The port is handling very little traffic relative to its capacity. Ports consistently falling in this range may be idle or underutilized ports and qualifies for optimization recommendations. |
| Medium | The port is carrying a moderate amount of traffic. Ports in this range are active but not operating in full capacity. |
| High | The port is carrying high volumes of traffic relative to its capacity. Ports in this range are heavily used and are not candidates for optimization recommendations. |
You can configure global port utilization thresholds from the Organization Settings page. The configuration automatically applies to all sites and all devices in the organization unless overridden by site-specific settings. The system provides default threshold values, inferred from historical traffic and usage, which you can adjust.
We recommend setting thresholds that reflect your organization's traffic patterns and operational behavior instead of relying on default values.
To configure port thresholds at the organization-level:
-
Locate the Port Threshold slider.
Figure 1: Port Traffic Threshold
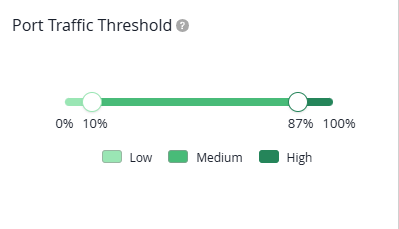
For description, see Widget Components.
Table 2: Widget Components Component Description Slider Defines the boundaries between Low, Medium, and High utilization. If you do not configure port thresholds, default thresholds are applied for the ports.
Percentage markers Indicate where each utilization range starts and ends on the 0–100% scale. Note:By default, the Low utilization range extends up to 10%, Medium from 11% up to 79%, and High from 80% up to 100% of the full port utilization scale.
Color bands on the slider Visually represents each utilization range. The same colors appear in Per Port Peak / Off-Peak Traffic Monitoring heatmap.
Color legend Shows how Low, Medium, and High utilization levels for a port are represented on the slider and across the Energy dashboards. -
Light Green—Low utilization
-
Medium Green—Medium utilization
-
Dark Green—High utilization
-