Security Assurance Analytics (Security Intelligence, Antivirus, Anti-Malware, and Antivirus)
Monitor security events based on Security Intelligence (SecIntel), Antivirus, and the Advanced Anti-Malware Prevention System.
Juniper Mist™ WAN Assurance is a cloud service that brings automated operations and service levels to the enterprise access layer at the WAN edge.
Security Assurance dashboard consolidates data from the Advanced Threat Prevention (ATP) logs to provide a comprehensive view of network security, focusing on antivirus, advanced anti-malware, and SecIntel actions. The dashboard provides following insights:
- SecIntel Insights—SecIntel Insights displays destination IPs blocked by SecIntel policies based on external threat intelligence.
- AAMW Insights—AAMW Insights tracks compromised endpoints, malware URLs, and mitigation actions,
- Antivirus Insights—Antivirus Insights highlights the severity and actions taken for compromised endpoints.
The dashboard provides insights of a Mist-managed WAN Edge devices (SRX Series Firewall), that are enrolled in the Juniper ATP Cloud and configured with the relevant security policies. For details, see Advanced Threat Prevention Features.
Features and Benefits
-
View antivirus, anti-malware, and SecIntel events in one place and get details about devices and locations/sites experiencing security events.
-
Real-time monitoring enables security teams to monitor threats and system health in real time.
-
Generates details about the devices and site experiencing security events
-
Identify the most frequent or critical actions taken by each device (blocks or log and permit).
Before You Begin
-
Refer to the Juniper Mist WAN Configuration Guide for the WAN configuration details.
-
Understand about Advanced Threat Prevention Features and Antivirus Profiles for WAN Edge Devices.
-
See Mist Premium Analytics Trial License to know about license requirements for the Juniper Mist Premium Analytics dashboard.
- Become familiar with the options available on the Juniper Mist Premium Analytics dashboard. See Figure 3.
Access Security Assurance Dashboard
-
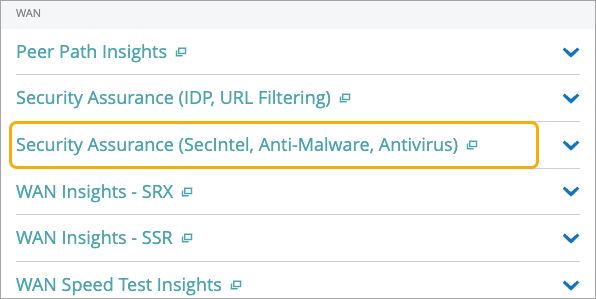
On the Premium Analytics page, click Security Assurance
Analytics (SecIntel, Antivirus, Anti-Malware, and Antivirus)
under WAN.
Figure 1: Security Assurance Analytics (SecIntel, Antivirus, Anti-Malware, and Antivirus)
 The Security Assurance Analytics (SecIntel, Antivirus, Anti-Malware, and Antivirus) page appears.
The Security Assurance dashboard includes tiles that provide antivirus, advanced anti-malware, and SecIntel events in graphical formats. You can use the dashboard to get an overview of the security events for the sites in your organization.
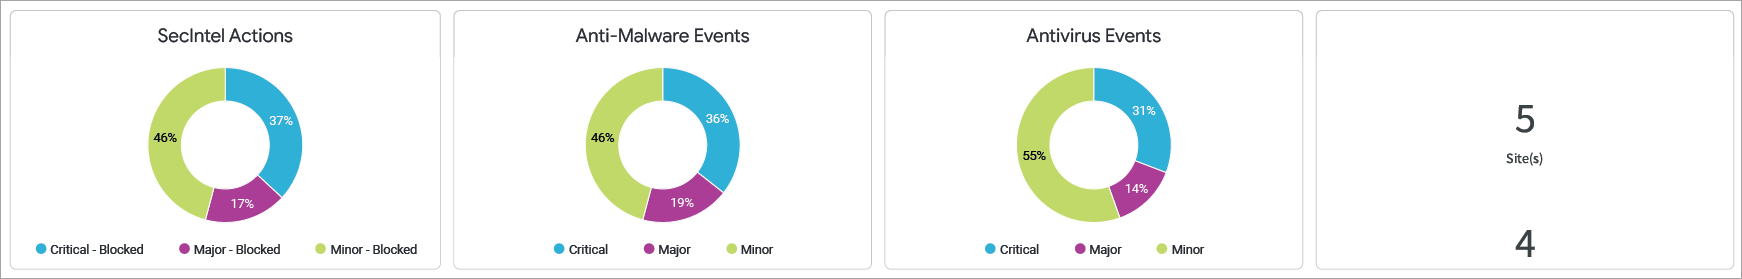
In the above example, the tile displays information about SecIntel actions and anti-malware and antivirus events in 5 sites. You can see the distribution of events as critical, major, and minor events. Hover your mouse on the charts to get the actual number of events.
Security Intelligence(Secintel) Actions
Top Sites : SecIntel Actions
The tile displays the list of sites in the organization, ranked according to SecIntel actions.
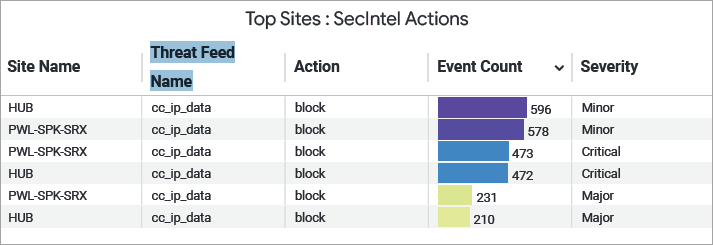
You can view the following details on the tile:
- Site name—Name of the site.
- Threat Feed Name—Name of the application policy that activated the configured threat intelligence feed.
- Actions—The measure taken on the detected traffic (log-and-permit or block).
- Events Counts— Specifies how many times the particular event was triggered.
- Severity—Indicates the level of impact of the event (critical, major, or minor).
Top Malicious Destinations and Actions
The tile displays a list of destinations to which malicious traffic was directed, sorted by the number of security events recorded per destination.
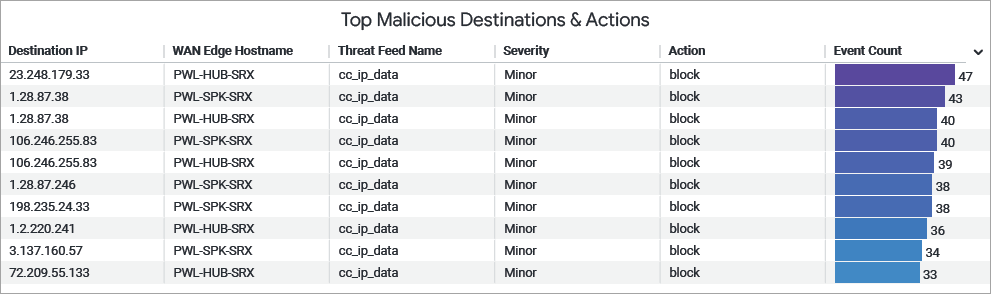
You can view the following details on the tile:
- Destination IP—The endpoint to which the malicious traffic was directed.
- WAN Edge Host Name—WAN Edge device name where the SecIntel response was triggered.
- Threat Feeds Name—Name of the application policy that activated the configured threat intelligence feed.
- Severity—Indicates the level of impact of the event (critical, major, or minor).
- Actions—The measure taken on the detected traffic (log-and-permit or block).
- Events Counts— Specifies how many times the particular event was triggered.
Advanced Anti-Malware (AAMW) Insights
Top Sites with AAMW Events
The tile displays the list of security incidents detected and logged by the Advanced Threat Prevention (ATP).
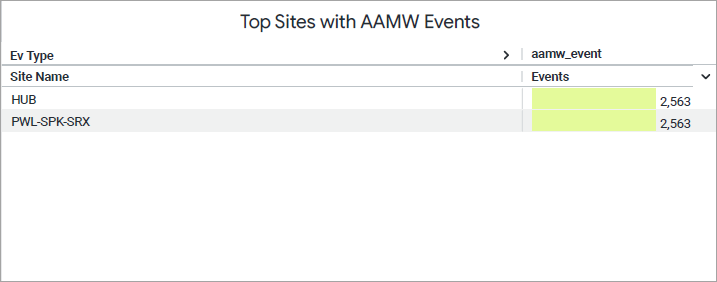
You can view the following details on the tile:
- Site name—Name of the site.
- Events Counts— Specifies how many times the particular event was triggered.
- AAMW Event—Name of the application policy that activated the configured advanced-anti malware.
- Events Type—Indicates the level of impact of the event (critical, major, or minor).
Top Malware Actions
The tile displays a list of endpoints that accessed malicious URLs or files and triggered AAMW responses, ranked by the number of AAMW events per host.
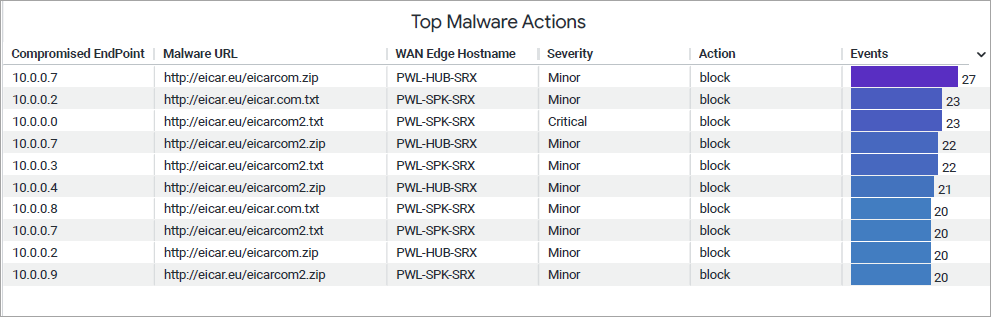
You can view the following details on the tile:
- Compromised Endpoint—A device flagged for malware activity, such as contacting malicious servers. It was isolated to prevent further harm.
- Malware URL—A malicious URL or files accessed by an end host.
- WAN Edge Hostname—WAN Edge device name where the AAMW response was triggered.
- Severity—Indicates the level of impact of the event (critical, major, or minor).
- Actions—The measure taken on the detected traffic (log-and-permit or block).
- Events Counts— Specifies how many times the particular event was triggered.
Malware Events by File Type
This chart displays the percentage breakdown of malicious URLs and files detected by AAMW.
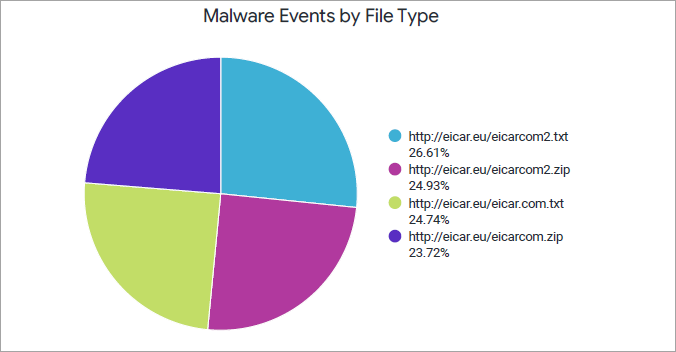
You can view the percentage of each URL/file type by using the legend next to the chart. To hide data for file type and see data for only the remaining ones, click the file type in the legend below.
AAMW Event Timeline
The Malware Events Timeline tile shows malware events over a selected period of time.
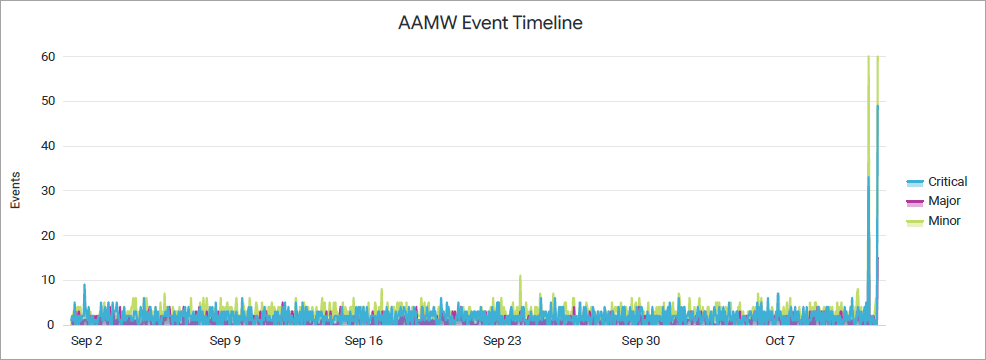
Juniper Mist categorizes the events as critical, major, and minor and displays the individual events as separate lines in the chart.
Place your cursor on a point in a line graph to see the exact number of events in the selected category.
To hide data for an event category from the chart and see only the remaining categories, click the category name in the legend next to the chart.
Antivirus Insights
- Threat Map : Antivirus Events
- Antivirus- Top Actions
- Antivirus Events by Protocol
- Antivirus Event Timeline
Threat Map : Antivirus Events
The tile displays the list of security incidents detected and logged by the antivirus feature.
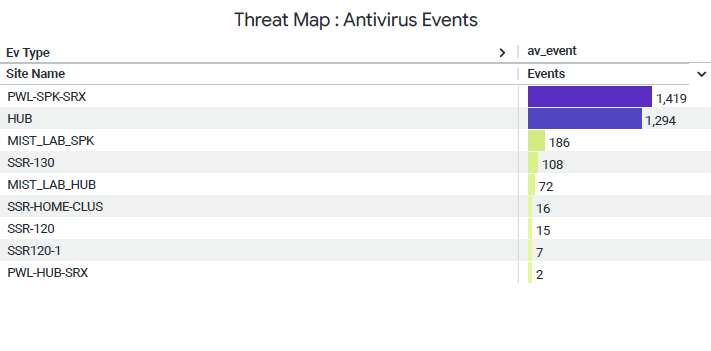
You can view the following details on the tile:
- Site name—Sie where the WAN Edge device initiated an antivirus response.
- Events Counts— Specifies how many times the particular event was triggered.
- AV Event—Name of the application policy that activated the configured advanced-anti malware.
- Events Type—Indicates the level of impact of the event (critical, major, or minor).
Antivirus- Top Actions
The tile shows viruses identified by the antivirus engine, sorted by the number of times each virus was detected
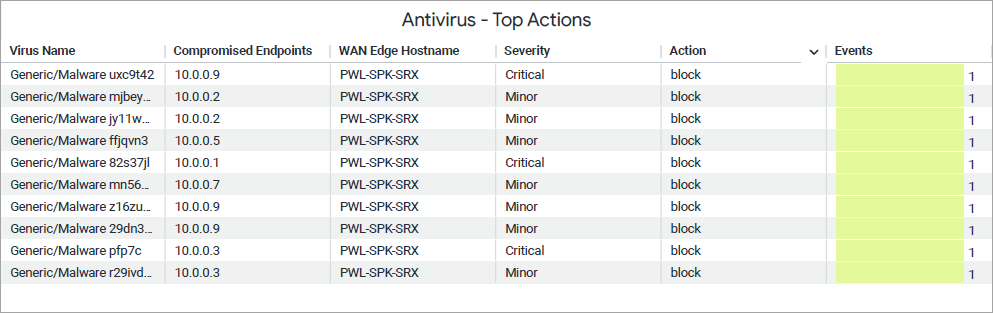
You can view the following details on the tile:
- Virus Name— A specific malware or virus that was detected by the antivirus engine.
- Compromized endpoint—A device that accessed or downloaded or executed the malicious file and was infected by the virus.
- WAN Edge Host Name—WAN Edge device name where the antivirus response was triggered.
- Severity—Indicates the level of impact of the event (critical, major, or minor).
- Actions—The measure taken on the detected traffic (log-and-permit or block).
- Events Counts— Specifies how many times the particular event was triggered.
Antivirus Events by Protocol
Displays protocol-wise breakdown of malicious file transmissions, highlighting the share of each protocol such as HTTP, FTP, IMAP, SMTP, and POP3.
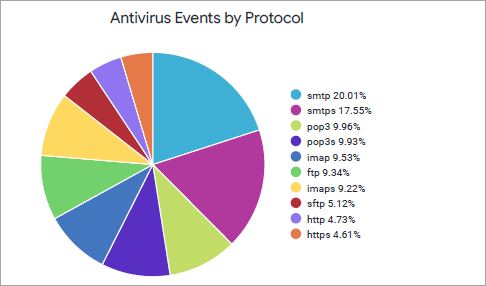
You can view the percentage of each protocol type by using the legend next to the chart. To hide data of a specific protocol and see data for only the remaining ones, click the protocol type in the legend next to chart,
Antivirus Event Timeline
This chart displays the percentage breakdown of malicious URLs and files detected by antivirus engine.
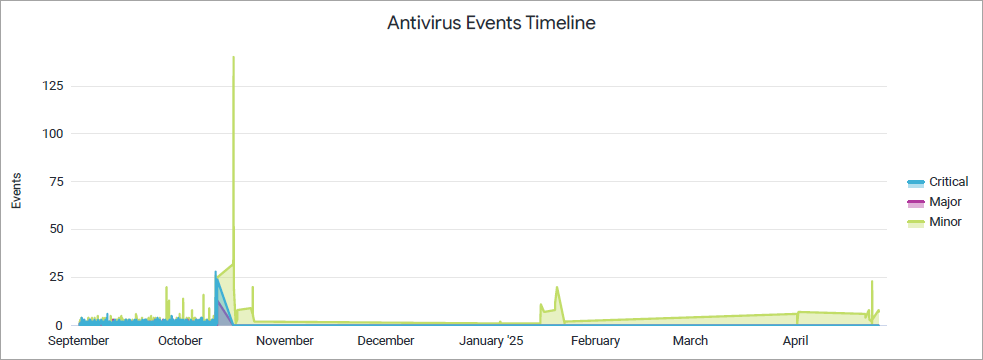
The Antivirus Events Timeline tile shows antivirus events over a selected period of time.
Juniper Mist categorizes the events as critical, major, and minor and displays the individual events as separate lines in the chart. Place your cursor on a point in a line graph to see the exact number of events in the selected category.
To hide data for an event category from the chart and see only the remaining categories, click the category name in the legend next to the chart.