ON THIS PAGE
What's New in QRadar Pulse
Stay up to date with the new features that are available in QRadar Pulse so that you get the most out of your dashboard experience.
2.2.5
Updated language support
QRadar Pulse 2.2.5 includes language support for functionality that was introduced in 2.2.4. The following languages are supported based on QRadar user preferences: English, Simplified Chinese, Traditional Chinese, Japanese, Korean, French, German, Italian, Spanish, Russian, and Portuguese (Brazil).
Earlier Versions
In case you missed a release, review a list of features from previous versions of QRadar Pulse.
- 2.2.4
- 2.2.3
- 2.2.2
- 2.2.1
- 2.2.0
- 2.1.6
- 2.1.5
- 2.1.4
- 2.1.3
- 2.1.2
- 2.1.1
- 2.1.0 (Pulse Dashboard)
- 2.0.1 (Pulse Dashboard Early Access)
- 2.0.0 (Pulse Dashboard Early Access)
- 1.1.0 (Threat Globe)
- 1.0.3
- 1.0.2
- 1.0.1
- 1.0.0
2.2.4
Work more efficiently
Several workflow improvements make Pulse simpler to use:
Pulse has a clean new look with fewer icons on panels and on the dashboard.
Widgets contain a data source query and a display chart, and appear as panels in dashboards. The new searchable widgets library makes it easy to see all the widgets in your workspace. You can create widgets, reuse widgets in new or existing dashboards, duplicate and edit widgets, or delete widgets. When you create a new dashboard, the widgets library opens to help you start adding content right away.
Chart legend controls now appear in the widget's General tab rather than in a separate Legend tab.
From the More options dashboard menu, you can set the current dashboard as the default or delete it.
Display your data in new ways
Chart enhancements give you new ways of looking at your data:
In choropleth geographic charts, geographic regions are shaded based on a selected metric from an AQL data source.
Give bar charts a sleek new look. If you have only one series, you can choose to color the bars all the same (monochrome). If you have more than one series, choose a color for each series.
You can indicate tabular chart thresholds by using a custom symbol shape and color. Previously, thresholds were indicated only by using a colored side bar.
Retrieve new data sources with the generic API
With the new Generic API option, you can retrieve data from the QRadar REST API and installed apps. For example, use the QRadar asset_model/assets endpoint to retrieve assets by ID.
Customize the look by using themes
In addition to the existing Pulse (default) theme, try the new Light (Cool Gray 10) and Dark (Gray 100) themes. Themes control the background color and chart colors.
Drill down to pages in QRadar or QRadar Analyst Workflow
The Open a page drill-down type is context-based and opens a page such as Offense Summary in the source application, whether it's QRadar or QRadar Analyst Workflow.
2.2.3
Support for multiple languages
QRadar Pulse 2.2.3 supports the following languages based on QRadar user preferences: English, Simplified Chinese, Traditional Chinese, Japanese, Korean, French, German, Italian, Spanish, Russian, and Portuguese (Brazil).
Correct SSL certificate validation
In QRadar 7.3.0 and later, QRadar Pulse sometimes failed to work properly after it was upgraded or installed, due to improper validation of custom Apache SSL certificates. Now, Pulse correctly validates custom Apache SSL certificates.
2.2.2
Share dashboards
You can share a dashboard with other QRadar Pulse users by sending them a dashboard link. When you share a dashboard, other users see it in read-only mode. Any updates that you make to the shared dashboard are seen by the other users. Drill down to other QRadar Pulse dashboards is preserved only if the target dashboards are also shared; the drill-down links do not appear if the target QRadar Pulse dashboards are not shared.
Users can import shared dashboards; however, importing a shared dashboard breaks the link and the dashboard is no longer read-only for that user.
You can stop sharing a dashboard at any time. If a user tries to open a previously shared dashboard, a message appears indicating that the dashboard is unavailable.
Filter dashboards by type
In the dashboard list, tags indicate whether dashboards are Shared with me, Shared by me, or if they have an Update available. To make it easier to find a particular dashboard, you can click the filter icon to filter the dashboards based on these criteria.
Drill down in pie charts and bar charts
In pie charts and bar charts, you can drill down to a Pulse dashboard, a QRadar page such as Offense Summary, or an external URL.
Highlight the selected drill-down row in tabular charts
In tabular charts, when you drill down to a target in the current window, the selected chart row is highlighted so that you can clearly see where the drill down was initiated.
Show stacked area chart for time series
In time series charts, you can use a stacked area chart to show trending of more than one field at a time. The values of each field are stacked on top of each other and summed. For example, if you are tracking event rates (EPS) from several sources, you can use a stacked area chart so that you see both the individual event rates and the total event rate.
Add a scatter chart
A scatter chart displays two variables. The X and Y axes represent the values of the two variables, and each point on the chart represents an observation. You can specify thresholds that change the color, shape, or size of the points based on a third variable.
Display 0 in big number charts for AQL data sources
When you use big number charts with numeric data from AQL data
sources, set Display 0 if no data is returned to On if you want to prevent a blank chart or a No data
was returned message. This behavior matches the standard
behavior for offense data sources.
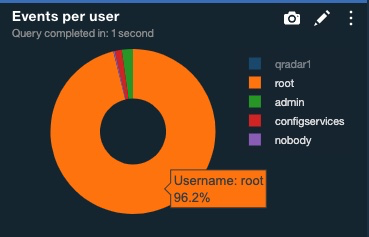
View column names in pie chart hover text
When you pause the cursor over a pie chart slice, hover text now displays the column name as well as the percentage size of the slice.
2.2.1
This release contains internal enablement for future releases.
2.2.0
Drill down on tabular chart rows
In tabular charts, you can drill down to a Pulse dashboard, a QRadar page such as Offense Summary, or an external URL. The following image shows the result of drilling down on a tabular chart to the QRadar Offense Summary page.
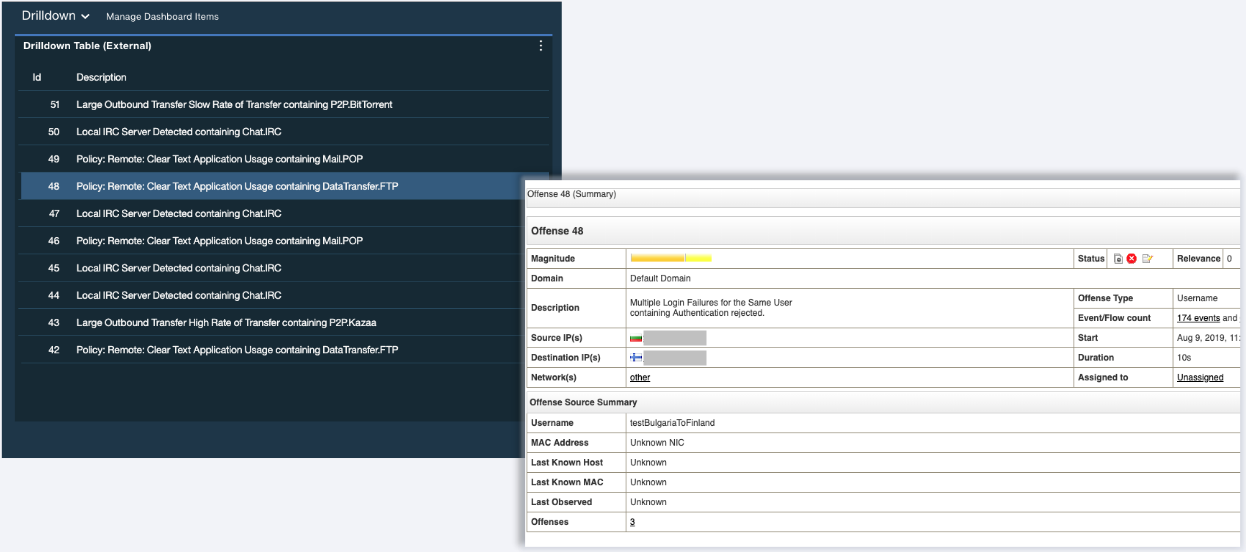
An updated version of the Offense Overview template is available. When you select a row in the Most recent offenses, Most severe offenses, or My offenses charts, Pulse drills down to the QRadar Offense Overview page.
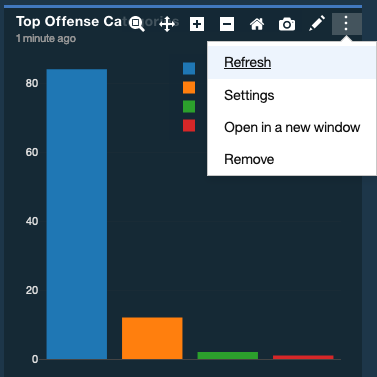
Reduced the dashboard icon clutter
Dashboard and dashboard item icons are consolidated into navigation menus to make the display cleaner. The following image shows a dashboard item menu.
Set the data alignment in a tabular chart
Select the default alignment for the entire chart or specific columns, or choose the alignment that is inherited from the default column settings. The following image shows a center alignment.
Change bar display on bar charts to horizontal
Select the orientation for the bars to display vertically or horizontally. The default orientation is vertical. Use the horizontal orientation when you have long labels for the categories that might be cut off if you display as a vertical bar chart, or if you don't have much data to display.
Use a logarithmic scale in time series charts
Improve the presentation of time series information that contains occasional spikes, by using a logarithmic Y-axis scale. A logarithmic scale prevents spikes from compressing "typical" data values in the time series to a narrow range at the bottom of the scale.
Geographic charts do not require Internet access
Geographic charts no longer require Internet access to render properly.
Maintain colors after a refresh in bar, pie, and time series charts
For consistency when dashboard items are refreshed, bar chart, pie chart, and time series chart items maintain their colors.
Dashboard item names are no longer auto-capitalized
Previously, names were changed to title case when they appeared as dashboard item titles. Now, dashboard item titles appear exactly as they were entered.
2.1.6
Incorporated version 1.2.0 of the Threat Globe dashboard, which includes the following features and improvements:
Include or hide local events that are occurring in your network.
Locations that are added to the network hierarchy in QRadar 7.3.1 or later now display on the threat globe.
Changed the configuration so that uploading a MaxMind database is optional in QRadar 7.3.1 or later. The MaxMind database that is available in QRadar 7.3.1 or later provides supplementary geolocation information. For more information, see Configuring the Threat Globe dashboard.
Added the average number of days an offense is open to the count on the offenses list.
Removed the requirement for an authentication token.
Fixed minor defects.
2.1.5
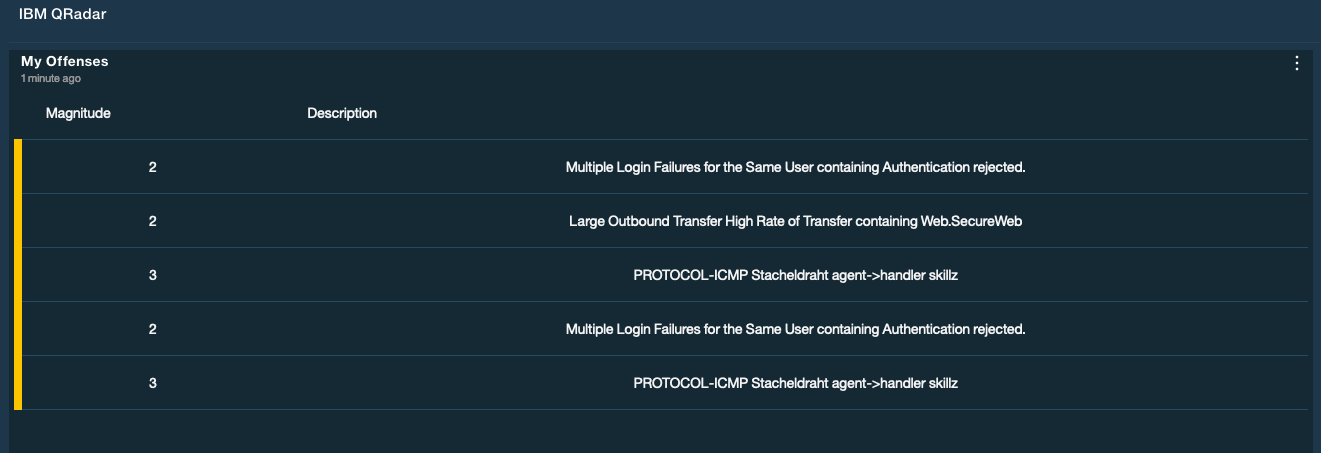
QRadar branding is displayed on expanded dashboard and dashboard items by default.
A user preference setting was added to enable or disable QRadar branding per workspace. For example, if you have many dashboards on your SOC wall, the QRadar branding helps you distinguish QRadar Pulse dashboards from others.
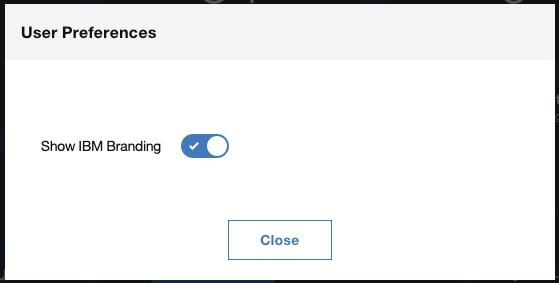
You can hide the branding.
Offense aggregation for pie charts
Use aggregate functions, such as FIRST, AVERAGE, SUM, COUNT, MAXIMUM, or MINIMUM, so that a count based on an offense ID is returned rather than the total of the ID values. For example, to see how many offenses are in a domain, you set domain_id as the label and add id as a value. Then, you select Count to sum the number of instances for the id value. In the following image, the id was counted to return a number of offenses by domain_id.
For more information, see Creating a pie chart in Widget Chart Types.
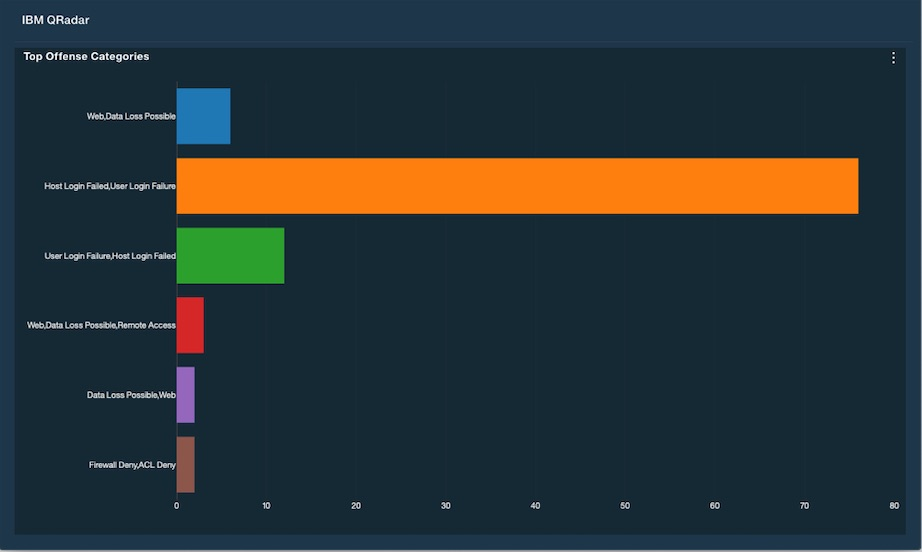
Axis types for bar charts
Select the axis type for the x and y axes in bar charts to force the underlying charting software to use discrete numbers instead of a range of numbers. For example, to measure the number of events by domains for offenses, you include domain_id as an offense field, and set it as the category for the x-axis. Then, you set event_count as the value, and select Sum to aggregate the values. In the following image, the x-axis type for domain_id is set to Category.
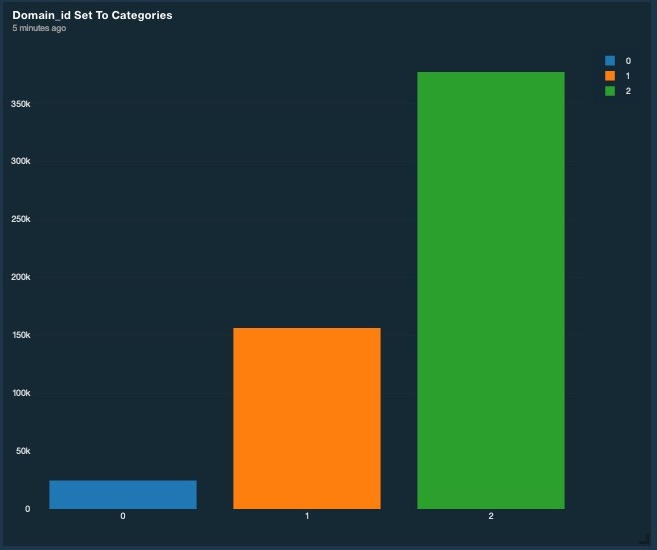
For more information, see Creating a bar chart in Widget Chart Types.
2.1.4
Enhanced chart displays to be more consistent.
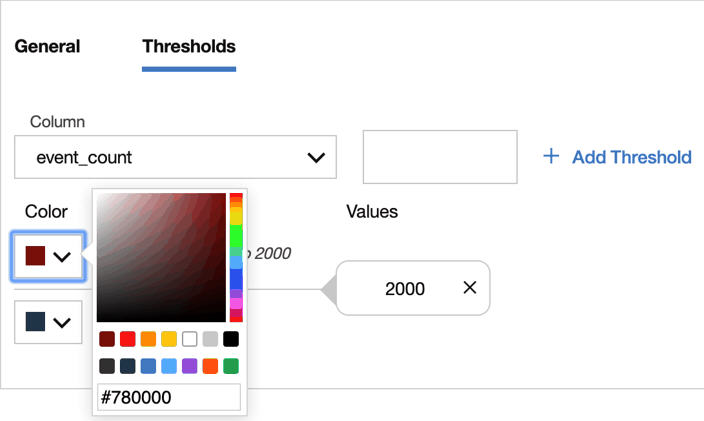
Enter HTML color codes in the dashboard chart color palette to make it easier to select the same colors on different charts. Save black and white as colors in the color palette so that these colors are available to select in different charts. The following example shows the new color selector.
See error messages fully displayed in the charts to help you troubleshoot issues. Users who don't have access to the dashboard or dashboard item can see the full message.
Show or hide the title and status of a dashboard item. For example, if the title or status line is long and overlaps other areas of the chart, you can hide it from view for a cleaner display on the SOC wall.
Enhanced thresholds in charts to improve security threat visibility.
Assign a threshold line on time series charts to customize displayed alert ranges so that you can quickly recognize when values exceed a benchmark. You can select the color of the line by using the new color selector. The following image shows an example.
Set the data and background colors for thresholds in Big Number charts to make it easier to quickly distinguish offenses based on severity or relevance. Set the threshold based on any numerical field that is returned in the query results. The following example shows a query with a threshold based on the selected Big Number Value field.
Set the y-axis range that is displayed on time series and bar charts to make it easier to compare data in different charts.
Improved creation of dashboard items to make configuration easier.
Enhanced the dashboard editor so that you can edit a dashboard item and save it without rerunning the query. For example, if a query doesn't return results, such as when the time period isn't long enough to pick up new events, or if the magnitude or severity value isn't applicable when you run the query, you can save the dashboard item. If you edit the query, you must run the query again before you can save the dashboard item.
Added a field selector to the offense dashboard item to make it easier to select the data fields to display in chart results. For more information, see Creating dashboard items from an offense data source.
Simplified how to create time series charts by adding a dynamic series option that splits the time series by creating a series for each distinct value in a selected column. For more information, see Time Series Charts in QRadar Pulse and Tracking the top five most active devices in the last ten minutes.
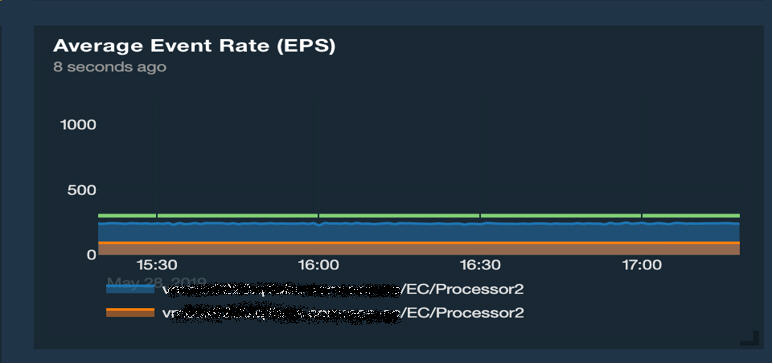
Updated the AQL query in template dashboards to accommodate chart improvements (Average Event Rate (EPS) and Peak Event Rate (EPS)) and reduce the number of charts that you need to edit after you upgrade to QRadar Pulse 2.1.4.
Added more charts and default dashboard content to help you monitor your environment.
Added a Top 10 Log Sources by Event Count chart to the Event and flow metrics dashboard as an example of the dynamic time series capability.
This query excludes the following console log sources: 63, 64, 66, 67, and 69. These represent the following log sources: Health Metrics, SIM Audits, Custom Rule Engine, System Notifications, and Asset Profiler. This chart is also limited to 10 log sources.
Added a Summary view default dashboard to demonstrate new features in QRadar Pulse 2.1.4, such as dynamic time series and Big Number chart thresholds.
Added a link to the Switch Dashboard page to more clearly indicate when dashboard templates are updated in each QRadar Pulse release.
2.1.3
Introduced parameters to make creating and sharing AQL queries easier. For more information, see Use cases for AQL parameters.
Updated the following event dashboard charts with parameter values: Average event rate (EPS), Average FPS, Peak FPS, and Peak event rate (EPS).
Added aliases to the column names in the Raw EPS average 1 minute dashboard item.
Added aliases to the Active offenses over time query fields and displayed the dormant offenses.
Added the ability to adjust the scale of the display when a dashboard item is opened in a separate page.
Added the ability to set thresholds on Big Number charts.
2.1.2
Pin or unpin dashboards and dashboard items after you open them in a new window. Restore all of your pinned windows after they are closed.
Enhancements to geographic location charts, including auto-rotation, line markers, colors, and shapes. Use thresholds to display the magnitude of events.
Import dashboard templates from QRadar content extensions. See Installing the QRadar Pulse App and QRadar Pulse Dashboard Components and Workspaces.
Increased the limit per user for dashboards (100) and dashboard items (800).
Renamed the starttime field to start_time in the AQL statements for the following three dashboard items: Peak event rate (EPS), Average FPS, and Peak FPS.
Note:You must make the same changes in your own AQL statements in these charts.
2.1.1
GDPR compliant. See Privacy Assessment.
Incorporates version 1.1.1 of the Threat Globe.
Set a dashboard as the default dashboard. See Displaying Dashboards.
Enhancements to charts to improve rendering and performance:
Multiple points added to the geographic chart that display the traffic paths from source IP to destination IP.
Three new line shapes added to time series charts (linear, spline, and step).
Three new line modes added to time series charts (markers, lines, or both).
2.1.0 (Pulse Dashboard)
Import and export dashboards to share with colleagues.
Scale the screen resolution of dashboards and dashboard items.
Performance enhancements.
2.0.1 (Pulse Dashboard Early Access)
Support was added for QRadar 7.3.0.
Modified the AQL queries for the Default IDs and Active offenses dashboard items.
Removed the Log source event count over time dashboard item.
2.0.0 (Pulse Dashboard Early Access)
Create dashboard items based on AQL and offense data, and then add them to dashboards. See QRadar Pulse Widgets.
Use predefined dashboards as a way to get started before you create one of your own.
Create unique dashboards to track operational data. See Displaying Dashboards.
Resize and reposition dashboard items as different metrics and vulnerabilities within your organization change priority.
Enlarge dashboard items to display on a SOC monitor.
Access the threat globe in its own dashboard.
1.1.0 (Threat Globe)
Added support for non-administrative users to be able to visualize security incidents and investigate offenses. See Installing the QRadar Pulse App.
Fixed an issue where negative values weren't allowed in the longitude and latitude fields of the Configuration page.
Streamlined the configuration process by removing unnecessary fields in the Configuration page: Interval to show and Fetch interval.
1.0.3
Corrected an issue where events were shown in the default location if the MaxMind GeoIP database was uploaded in a compressed format.
Changed the default security event category selection (removed the limit of five categories). All categories are initially selected. If you already changed the category selections, those selections aren't changed when you upgrade to 1.0.3.
Added the playback time to the playback controls section.
Added the offense ID to the page that appears when you hover over events.
Added a tooltip to the offenses list.
Clarified the time period when no offense data is received.
Improved error messages to contain error details.
1.0.2
Resolves an issue where events don't load in a timely manner in certain environments.
1.0.1
Performance improvements
1.0.0
Visualize security incidents from around the globe. See Visualizing security incidents.
Investigate each offense in detail. See Investigating the details of an offense.