QRadar Pulse Dashboard Components and Workspaces
The QRadar Pulse workspace comprises dashboards and dashboard items. Use it to create an inventory of unique dashboards to track endpoint, user, department, and company-wide security and operational data.
Workspaces
Your workspace is what you see when you click the Pulse tab on the QRadar Console. Only you can see your workspace, but you can choose to share dashboards with colleagues or expand specific dashboards onto a monitor on a SOC wall. Create AQL parameters for your workspace that make it simpler to create AQL dashboard items and to update multiple AQL queries at the same time.
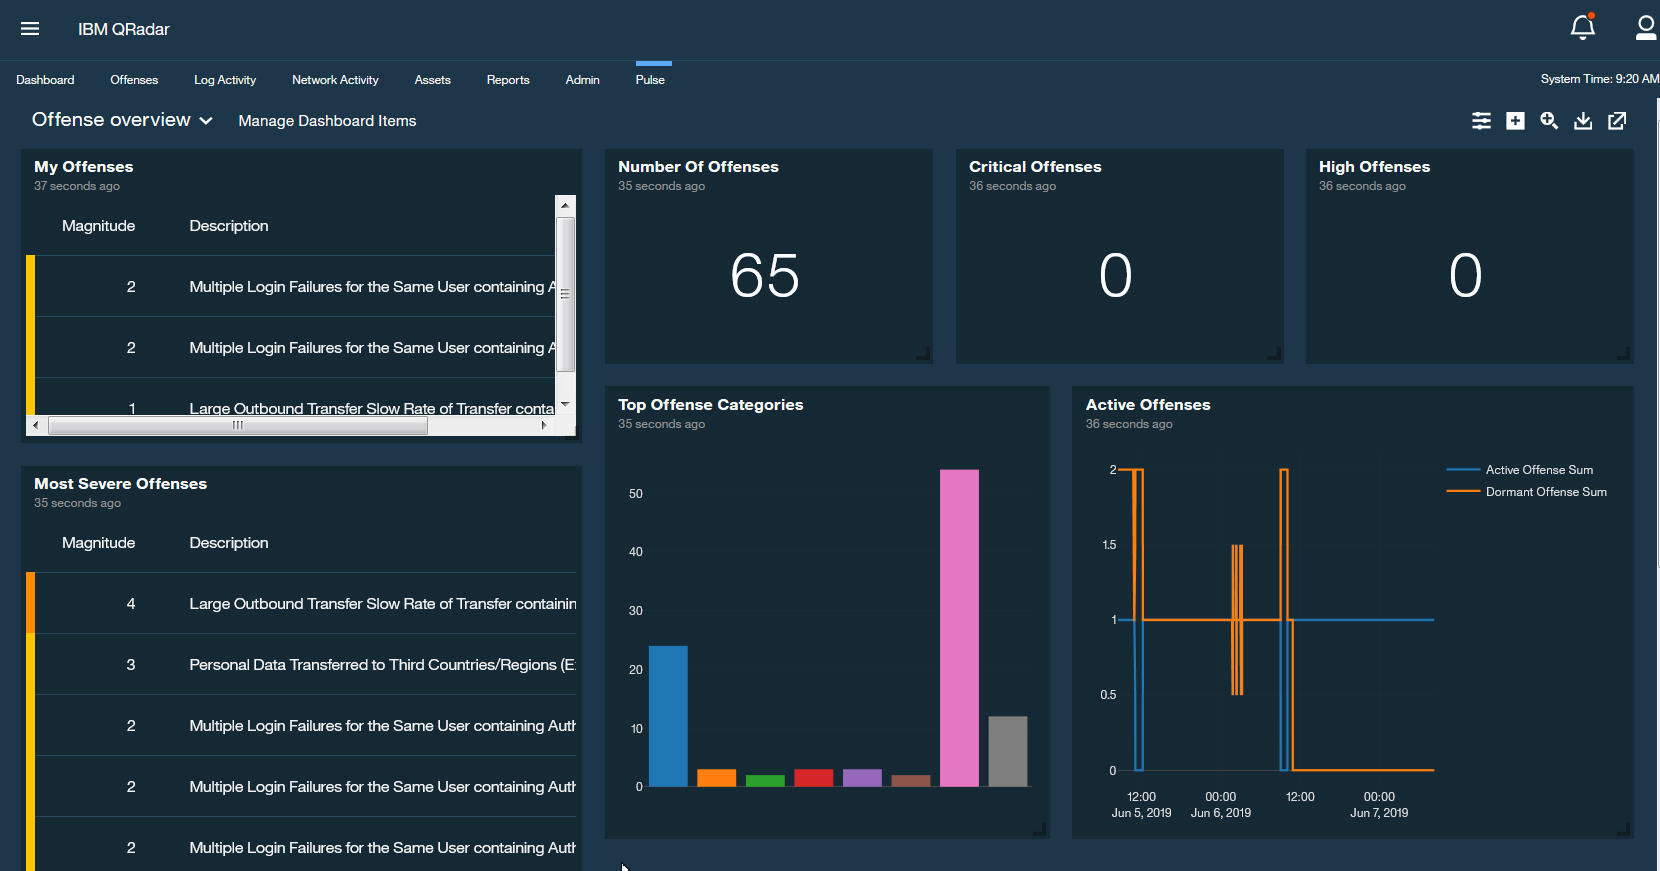
The following image shows the default workspace view of the Offenses overview dashboard.
Dashboard Templates
Use the default dashboard templates in QRadar Pulse as a starting point to build your own customized dashboard inventory for your workspace. Each dashboard template offers several different dashboard items, which you can add to different dashboards. Remove the dashboard items that don't apply to your organization.
The QRadar Pulse dashboards get their data from QRadar, so some of them might display data, such as the Events and flow metrics dashboard, immediately depending on how you set QRadar up to receive data. Other QRadar Pulse dashboards must be edited to get data to appear in the charts.
Dashboards
Dashboards contain widgets that monitor and display security events and issues that are important to your organization. For example, the Offense overview dashboard contains widgets that monitor the top offense categories, most severe offenses, and so on. Create your own dashboards specific to your organizational and network needs. Add widgets from other dashboard templates or create your own. Import dashboards that colleagues share with you to eliminate the need for re-creating existing content.
Widgets
Widgets contain a data source (AQL or offense) and a minimum of one chart. You can add more charts as different views, such as a pie or bar chart. For example, the Events per User widgets in the Miscellanous metrics dashboard can display as a pie or a bar chart. The bar chart view compares sets of data between groups, such as usernames and the number of events per user. The pie chart view displays the same information, but in percentages.
Parameters for AQL Data Sources
Parameters help make it simple to reuse common elements in multiple AQL queries so that it's easier to create dashboard items and share them. Create parameters that you can use in all of your dashboard items with an AQL data source, such as Time Period and Time Value. Using common parameters and default values can reduce the time that it takes to create or edit individual AQL queries for your dashboard items.
- Creating dashboards
- Installing dashboard templates into your workspace
- Sharing dashboard links with others
- Opening shared dashboard links
- Exporting dashboards to send to others
- Importing dashboards
- Changing the workspace theme and branding
Creating dashboards
Create new dashboards and then add widgets. Set a specific dashboard to be your default dashboard every time you log in.
Expand the dashboard list in the upper left of the Pulse tab, click New Dashboard, and then click Blank Dashboard.
Give the dashboard a name and description.
Note:Users are limited to 100 dashboards and 800 dashboard items each.
The following reserved characters in the dashboard name are removed from the file name when you export a dashboard to share with colleagues: / ? < > \ : * | ". Avoid these characters when you name the dashboard.
To set the new dashboard as your default dashboard, set Default Dashboard to Yes.
Click Next.
The Choose widgets screen displays a library of available widgets, with details about each widget.
Click each widget that you want to add to the dashboard. A check mark appears on each selected widget and a count appears in the lower left of the Pulse tab.
Click Create.
Click, drag, and resize to rearrange the dashboard's widgets as you like.
Installing dashboard templates into your workspace
A dashboard template is a dashboard that an administrator shares with all users. Browse the catalog of available templates that your administrator added for you, and then select which dashboard templates that you want to install.
An administrator must install and synchronize the content extensions that contain QRadar Pulse dashboard templates.
In QRadar Pulse, go to the dashboard list, which is on the upper left of the Pulse tab, and click New Dashboard > Templates.
On the Browse Templates page, click Install or Update for each dashboard template that you want to install or update. For example, in the following screen capture, the QRadar DNS Analyzer app dashboard template is ready to install as a dashboard.
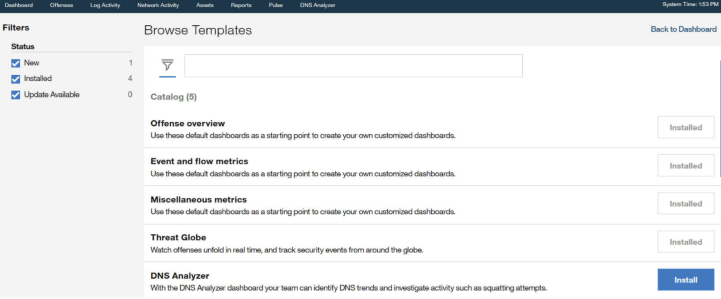
If updated templates are listed on the Browse Templates page, click Update to install over the existing templates. If you changed the original templates, you can choose to keep the existing templates instead.
Tip:In the dashboard list, templates with available updates have an Update available tag. Click the tag to open the Browse Templates page and update according to these steps.
Follow the instructions in the wizard to finish the installation process.
Any conflicts with parameters or items are displayed for you to deal with. Then, click Confirm > Close.
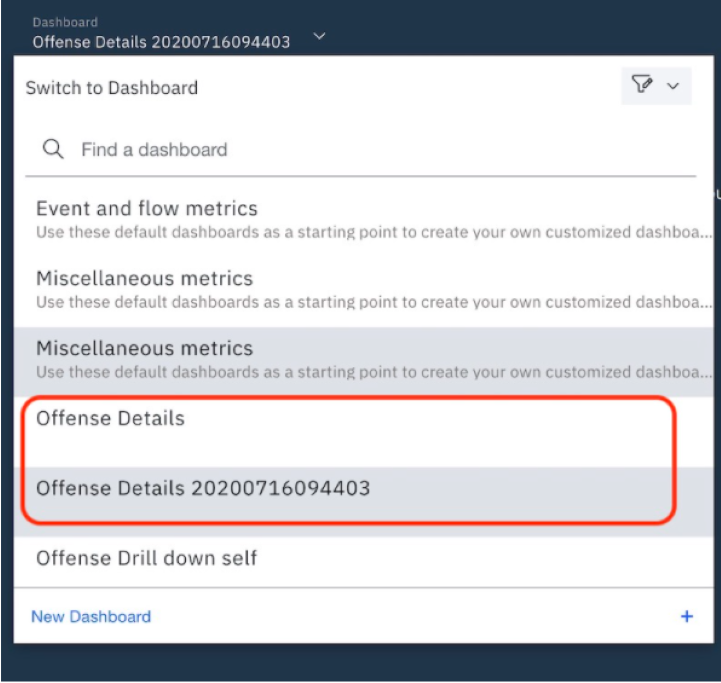
If you select Create copy during the installation process, the installed dashboard is automatically appended with the following format: yyyyMMddHHmmss. Edit the dashboard name to make it more meaningful to you.
After you resolve conflicts, click Back to Dashboard, and then go to the dashboard list to select a new or updated dashboard, like the following example:
Sharing dashboard links with others
Share dashboards with other QRadar Pulse users by sending them a dashboard link. When you share a dashboard link, other users see the dashboard in read-only mode. Any updates that you make to the shared dashboard are seen by the other users. Other users see only the dashboard items that match their privileges. For example, if they're not allowed to view offenses in QRadar, they can't see them in QRadar Pulse.
Limited capabilities are available to users of read-only dashboards. Users can still set dashboard parameters by using the Parameters card or by drilling down within the dashboard. In addition, users can open dashboards or items in a new window and click the More options menu to see other read-only capabilities such as pinning and scaling dashboards.
Drilling down to other QRadar Pulse dashboards is preserved only if the target dashboards are also shared; the links do not appear if the target QRadar Pulse dashboards are not shared.
Users can't share dashboards that you share with them.
Users can import shared dashboards. By importing a shared dashboard, users create an editable copy that is saved separately to their dashboard list. The copy does not receive updates that you make to the shared dashboard.
You can stop sharing a dashboard at any time. If a user tries to open a previously shared dashboard, a message appears indicating that the dashboard is unavailable.
Open the dashboard that you want to share, and click the Share this dashboard icon.
To start sharing the dashboard, set Has share link to Yes, copy the provided URL, and share the URL with other users (such as by email).
If the shared dashboard drills down to other dashboards, the target dashboards are listed. Decide whether to share the target dashboards. If you don't share the target dashboards, the drill-down links do not appear for other users.
Optional: To stop sharing the dashboard, set Has share link to No.
QRadar Pulse lists the users who opened the shared dashboard so that you can see who is affected if you stop sharing the dashboard. After you stop sharing the dashboard, users who try to open the dashboard see a message that indicates that the dashboard is unavailable.
In the dashboard list, tags indicate whether dashboards are Shared by <user>, Shared by me, or if they have an Update available. To make it easier to find a particular dashboard, filter the dashboards based on these criteria.
Opening shared dashboard links
When you open a dashboard link that another user shares with you, you see the dashboard in read-only mode. You can see updates that are made to the dashboard by the dashboard author. You see only the dashboard items that match your user privileges. For example, if you're not allowed to view offenses in QRadar, you can't see them in QRadar Pulse.
A dashboard author sends you a dashboard link (such as by email).
Limited capabilities are available to users of read-only dashboards. You can still set dashboard parameters by using the Parameters card or by drilling down within the dashboard. In addition, you can open dashboards or items in a new window and click the More options menu to see other read-only capabilities such as pinning and scaling dashboards.
The dashboard author might share more than one dashboard so that you can drill down from one dashboard to another.
You can import shared dashboards. By importing a shared dashboard, you create an editable copy that is saved separately to your dashboard list. The copy does not receive updates from the author of the shared dashboard.
You can't share dashboards that are shared with you.
Shared dashboard widgets appear in your widgets library as read-only; you can't edit or delete read-only widgets, but you can duplicate them to make an editable copy. Shared dashboard widgets are removed from your widgets library if you delete the shared dashboard to which they belong or if the dashboard author stops sharing.
In QRadar, open a new browser window or tab, and paste the dashboard URL link that you received into the address bar.
The shared dashboard opens in read-only mode. It appears in your dashboard list so that you can easily return to the shared dashboard, and has a Shared by <user> tag so that you know who authored the dashboard.
Optional: To import the shared dashboard so that you can make changes, click More options > Import shared dashboard.
An editable copy of the shared dashboard is saved to your dashboard list, with a timestamp suffix. The copy does not receive updates from the author of the shared dashboard.
Optional: To delete the shared dashboard, click More options > Delete.
When you delete a shared dashboard from your workspace, all of the shared dashboard's read-only widgets are also deleted from your widgets library.
Exporting dashboards to send to others
Export dashboards as files that you can send to colleagues. Depending on their user role and security profile, your colleagues might see different results after they import your dashboard.
Open the dashboard that you want to export, and click the Export as JSON icon in the upper right of the page. The following reserved characters in the dashboard name are removed from the filename when you export a dashboard to share with colleagues: / ? < > \ : * | ". Avoid using these characters when you name the dashboard.
If you use parameters in the dashboard, select whether to export the dashboard with default parameter values or without. The exported JSON file downloads to your local Downloads directory.
Import as a new dashboard or share it with colleagues.
o download the dashboard item data in PNG format, click the camera icon on the upper right of the item.
Importing dashboards
When you import a dashboard that a colleague exported for you, you see only the dashboard items that match your user privileges. For example, if you're not allowed to view offenses in QRadar, you can't see them in QRadar Pulse.
A dashboard author sends you an exported dashboard JSON file (such as by email).
In QRadar Pulse, go to the dashboard list, which is on the upper left of the Pulse tab, and click New Dashboard.
Click Import Existing and either drag the JSON file onto the Import Dashboard page or click Select File to go to the file location.
Follow the instructions in the wizard to finish the import process.
Any conflicts with parameters or items are displayed for you to deal with. Then, click Confirm > Close.
If you select Create copy during the import process, the imported dashboard is automatically appended with the following format:
yyyyMMddHHmmss. Edit the dashboard name to make it more meaningful to you.
Changing the workspace theme and branding
Optimize QRadar Pulse for the SOC wall or for your personal use. Change the workspace color scheme or remove the default QRadar branding that appears when you open any dashboard or widget in a new window.
From any dashboard, click More options > User Preferences.
Under Theme Options, choose a theme to control the background color and chart colors.
Theme Options is disabled if QRadar Pulse was opened by QRadar Analyst Workflow.
Set Branding to Disabled.
Click Close.