ON THIS PAGE
QRadar Pulse Widgets
Create widgets (formerly known as dashboard items) to include in one or more of your dashboards. You can see only the widgets and dashboards that you create in your workspace. However, you can share them with others by exporting them or by opening a dashboard or widget onto a shared monitor, like a SOC wall.
Creating Widgets from an Offense Data Source
Use the offense API endpoints as a data source for your widgets.
Administrators can't create widgets or dashboards for other users, but they can share their own dashboards with other users.
To query the offenses data source (/siem/offenses endpoint), you must have the Offenses permission. The data that is returned is restricted based on your security profile.
Click Configure Dashboard.
The Configure dashboard screen displays a library of available widgets, with details about each widget.
Click Create new widget.
On the New Dashboard Item page, enter a name and a description for the widget.
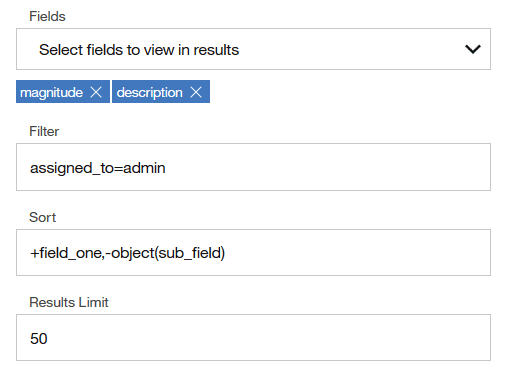
Select Offense from the data source in the Query section, and select the API fields that you want to view in the results from the Fields list. Use the Filter and Sort as options to fine-tune the results.
The following image shows an example of completed API parameters:
 Note:
Note:In this example, the assigned_to filter must be set to the current user to retrieve results.
Tip:You can filter by one or more log sources in an offense query. For example, in the Filter box, enter
log_sources
CONTAINS (type_name="IBM Trusteer" OR type_name="CREEvents")
to see only Trusteer or CREEvents log sources.Pick a refresh time for how often you poll the data source.
Choose a refresh rate that is greater than the selected query time. The default refresh rate is every minute. The shorter the refresh time, the greater the performance impact on QRadar.
Click Run Query.
When you first create the widget, you can't configure the charts when no data results are returned. Try making the criteria in the fields less strict and run the query again.
Create a view in the Views section.
Because you can create multiple views from the same query, give the view a unique name. By default, the chart's title and status on the title bar are displayed; to hide them, click the More options icon and switch the settings to off.
Select a chart type and complete the corresponding fields for the chart. For use cases to help you decide which chart type to use, see Widget Chart Types.
Chart type
Bar
Big Number
Pie
Scatter
Tabular
Preview how the chart looks and then click Save.
You can edit a widget and save it without rerunning the query. For example, if a query doesn't return results, such as when the time period isn't long enough to pick up new events, or if the magnitude or severity value isn't applicable when you run the query, you can save the widget. If you edit the query, you must run the query again before you can save the widget.
Deleting a widget removes it from all of the dashboards it belongs to. If the deleted dashboard contains parameters, the parameters are not deleted from QRadar Pulse.
Creating Widgets from an AQL Data Source
You can use Ariel Query Language (AQL) statements to create widgets. AQL is a structured query language that you use to extract, filter, and manipulate event and flow data that you extract from the Ariel database in QRadar.
Read the following topics in the Juniper Secure Analytics Ariel Query Language Guide to learn about the Ariel Query Language that you use in QRadar Pulse to create dashboard items based on AQL data sources:
Within the overview section, several topics explain the statements and clauses you use. The statements and clauses appear as keywords in QRadar and QRadar Pulse when you enter them in the query field.
Use AQL to retrieve specific fields from the events, flows, and simarc tables in the Ariel database.
Administrators can't create widgets or dashboards for other users, but they can share their own dashboards with other users.
Click Configure Dashboard.
The Configure dashboard screen displays a library of available widgets, with details about each widget.
On the New Dashboard Item page, enter a name and a description for the widget.
Select AQL from the data source list in the Query section, and enter an AQL statement. For more information, see Tips for creating AQL queries for dashboard charts.
Insert existing parameters in the statement. Click the Insert Parameter icon, and then click Insert for each relevant parameter.
To change the default value of the parameter, click the View Parameters icon, and click Save after you set the default value.
When you change the default value for a parameter, you're changing the value everywhere the parameter is used in your workspace, except in expanded or pinned dashboards and widgets. If you don't set the value as the default value, the updated change applies only to the current session. However, if you set the value as the default, the current session value also uses that value.
To add a parameter to your workspace, click Add, give the parameter a name and default value, if needed, and then click Save.
Note:After you add parameters to a widgets on a dashboard for the first time, the Parameters card appears on the dashboard. If you remove parameters from the widget, and no other widget in that dashboard uses the parameter, the Parameters card disappears.
Pick a refresh time for how often you poll the data source. Choose a refresh rate that is greater than the selected query time. The default refresh rate is every minute. The shorter the refresh time, the greater the performance impact on QRadar. The timer for the refresh rate begins after the query is completed.
For example, if the refresh rate is every minute, and the query takes 3 minutes to complete, the refresh rate starts only after the 3-minute run ends.
Click Run Query.
When you first create the widget, you can't configure the charts when no data results are returned. Try making the criteria in the fields less strict and run the query again.
If your AQL query contains parameters without any values, enter them on the Parameters page. You must enter a value for each parameter so that the query runs successfully. If the query is successful, the results are displayed next to the statement.
Create a view in the Views section.
Because you can create multiple views and charts from the same query, give the view a unique name. By default, the chart's title and status on the title bar are displayed; to hide them, click the More options icon and switch the settings to Off.
Select a chart type and configure the relevant properties. For use cases to help you decide which chart type to use, see Widget Chart Types.
Chart type
Bar
Big Number
Geographic
Pie
Scatter
Tabular
Time Series
Preview how the chart looks and then click Save.
Tip:The labels for the chart come from the queries that are used. If they are unintelligible in the preview, edit the labels in the View section.
You can edit a widget and save it without rerunning the query. For example, if a query doesn't return results, such as when the time period isn't long enough to pick up new events, or if the magnitude or severity value isn't applicable when you run the query, you can save the widget. If you edit the query, you must run the query again before you can save the widget.
Deleting a widget removes it from all of the dashboards it belongs to. If the deleted dashboard contains parameters, the parameters are not deleted from QRadar Pulse.
Tips for Creating AQL Queries for Dashboard Charts
Tips to help you create AQL queries and dashboard charts more easily cover aliases, time and date formats, and transformation lookup functions.
Any AQL statement that doesn't contain a time criteria such as start, stop, or last runs only for 5 minutes.
Don't use a transformation lookup function in an IN operator in a WHERE clause. The IN operator specifies multiple values in the WHERE clause, but can cause performance issues when you run the query. For example, the following query can cause performance issues:
Where logsourcetypename(deviceType) IN ('a','b')Always use aliases to ensure that your field names don't vary from one QRadar version to another. For example, in the following query, Active Offense Sum is an alias for the SUM_Active Offense Count field.
select ("SUM_Active Offense Count" / 2)  as 'Active
Offense Sum', ("SUM_Dormant Offense Count" / 2)  as 'Dormant Offense
Sum', "Time" * 1000 as 'sTime' from GLOBALVIEW('Offenses Over Time','NORMAL')
order by "Time" desc last 2 days
Use the millisecond time format in the Time in the AQL query; for example,
starttime-starttime%60000.Use proper date and year formats in your queries, especially in a GLOBALVIEW. Dates are not automatically appended; for example, use
StartTime, 'YYYY-MM-dd HH:mm'.Go to the Log Activity or Network Activity tab and run an AQL search to get auto-completion and messaging. If you're satisfied with the results you get there, then copy and paste the statement in the Query section in QRadar Pulse. The GLOBALVIEW source can be used only in REST API calls.
Scatter geo charts display geographic locations to indicate the IP source and destination of detected malicious activities. To collect this information, use the geo_json option of the AQL GEO::LOOKUP function. For example:
GEO::LOOKUP(sourceip, 'geo_json') AS 'geoSource',
GEO::LOOKUP(destinationip, 'geo_json') AS 'geoDest',
Choropleth charts are shaded in proportion to the amount of malicious activity detected in each geographic region. To collect this information, use the country option of the AQL GEO::LOOKUP function. For example:
GEO::LOOKUP(sourceip, 'country') AS 'geoCountry',See the following topics in the Juniper Secure Analytics Ariel Query Language Guide:
Overview of Ariel Query Language
AQL logical and comparison operators
System performance query examples
Events and flows query examples
Reference data query examples
User and network monitoring query examples
Sample Event, Log Source, and Storage Usage AQL Statements
Use the following examples to monitor events, log sources, and storage usage or you can edit the queries to suit your requirements.
Log source summary
Unique events
Unparsed events percentage
Unparsed events percentage for a specific log source type
Number of partial matches per rule
Number of partial matches per event processor
Number of partial matches per rule and per event processor
Storage consumption per log source type
Storage usage
CPU usage
Memory usage
Expensive CEPs, log sources, and rules
Expensive searches
Executed AQL searches by user
- Log Source Summary
- Unique Events
- Unparsed Events Percentage
- Unparsed Events Percentage for a Specific Log Source Type
- Number Of Partial Matches Per Rule
- Number Of Partial Matches Per Event Processor
- Number Of Partial Matches Per Rule and Per Event Processor
- Storage Consumption Per Log Source Type
- Storage Usage
- CPU Usage
- Memory Usage
- Expensive CEPs, Log Sources, and Rules
- Expensive Searches
- Executed AQL Searches by User
- Copying Query Samples
Log Source Summary
Provides a list of unique log source types, including the number of log sources, EPS, and the percentage of unparsed events.
SELECT LOGSOURCETYPENAME(devicetype) AS "LogSourceType",UNIQUECOUNT(logsourceid)
as "Number of Log Sources", COUNT(*)/3600 as "EPS",(DOUBLE(COUNT(isunparsed))
/ COUNT(*)) * 100 AS "PercentUnparsed"  FROM events  GROUP BY devicetype
 ORDER BY "PercentUnparsed"  DESC  LAST 1 HOURS
Unique Events
Provides a list of unique events and the log source type, QID, high-level category, low-level category, and the event count.
SELECT LOGSOURCETYPENAME(devicetype) AS "Log Source
Type", QIDNAME(qid) AS "Event Name",  qid as "QID",  CATEGORYNAME(highlevelcategory)
AS "High-level Category",  CATEGORYNAME(category) AS "Low-level Category",
 LONG(COUNT(*)) as "Number of Events"  FROM events  GROUP BY qid,
devicetype  ORDER BY COUNT(*)   DESC  LAST 1 HOURS
Unparsed Events Percentage
Provides the percentage of events that are unparsed for each log source type. Any log sources that are greater than 20% unparsed must be addressed.
SELECT LOGSOURCETYPENAME(devicetype) AS "Log Source
Type", devicetype AS "Log Source ID",  LONG(UNIQUECOUNT(logsourceid))
as "Number of Log Sources",  LONG(SUM(eventcount)) as "Total Events",
 LONG(COUNT(*)) as "Aggregated Events",  LONG(COUNT(isunparsed)) AS
"Unparsed Events",  STR(LONG(SUM(eventcount)/24*3600)) as "EPS", LONG("Unparsed
Events"*100) / "Total Events" AS "PercentUnparsed"  FROM events  GROUP
BY devicetype  ORDER BY "PercentUnparsed","Unparsed Events"  DESC
 LAST 24 HOURS
Unparsed Events Percentage for a Specific Log Source Type
To further investigate the parsing issues with one specific log source type (for example, devicetype=11), you can run the following query that returns a breakdown of the statistics per log source.
SELECT LOGSOURCENAME(logsourceid) AS "Log Source
Name",  LONG(SUM(eventcount)) as "Total Events",  LONG(COUNT(*)) as
"Aggregated Events",  LONG(COUNT(isunparsed)) AS "Unparsed Events",
 STR(LONG(SUM(eventcount)/24*3600)) as "EPS", LONG("Unparsed Events"*100)
/ "Total Events" AS "PercentUnparsed"  FROM events  WHERE  GROUP BY
logsourceid  ORDER BY "PercentUnparsed","Unparsed Events"  DESC  LAST
24 HOURS
Add more fields as required for your environment. Create an AQL parameter for the devicetype=11 variable. For more information, see Creating AQL parameters for your workspace dashboards.
Number Of Partial Matches Per Rule
Provides a list of all rules and building blocks with the number of partial matches within the specified time period.
SELECT RULENAME(partialmatchlist) as "Rule Name",
 LONG(COUNT(*)) as "Number of Partial Matches"  FROM events  WHERE
partialmatchlist IS NOT NULL   GROUP BY "Rule Name"  ORDER BY "Number
of Partial Matches"  DESC  LAST 1 HOURS
Number Of Partial Matches Per Event Processor
Provides a list of all rules and building blocks with the number of partial matches within the specified time period.
SELECT HOSTNAME(processorid) as "Event Processor
Name",  LONG(COUNT(*)) as "Number of Partial Matches"  FROM events
 WHERE partialmatchlist IS NOT NULL   GROUP BY "Event Processor Name"
 ORDER BY "Number of Partial Matches"  DESC  LAST 1 HOURS
Number Of Partial Matches Per Rule and Per Event Processor
Provides a list of all rules and building blocks, including the number of partial matches per rule within the specified time period.
SELECT HOSTNAME(processorid) as "Event Processor
Name",  RULENAME(partialmatchlist) as "Rule Name",  LONG(COUNT(*))
as "Number of Partial Matches"  FROM events  WHERE partialmatchlist
IS NOT NULL   GROUP BY "Event Processor Name", "Rule Name"  ORDER
BY "Number of Partial Matches"  DESC  LAST 1 HOURS
Storage Consumption Per Log Source Type
Provides a breakdown of storage that is used by each log source type during 1 day.
This query doesn't include the storage that is used for QRadar indexes. However, most indexes are equally distributed among all events regardless of the log source type or the size of the payload.
SELECT  LOGSOURCETYPENAME(deviceType) AS LogSource,
 LONG(MIN(STRLEN(UTF8(payload)))) AS "Minimum Payload Size (Bytes)",
 LONG(MAX(STRLEN(UTF8(payload)))) AS "Maximum Payload Size (Bytes)",
 LONG(AVG(STRLEN(UTF8(payload)))) AS "Average Payload Size (Bytes)",
 LONG(STDEV(STRLEN(UTF8(payload)))) AS "Standard Deviation (Bytes)",
LONG(COUNT(logsourceid)) AS EventCount, LONG(EventCount * "Average
Payload Size (Bytes)") / (1024 * 1024)  as "Total Storage (MB)" FROM
events  GROUP BY deviceType  ORDER BY "Total Storage (MB)"  DESC LAST
24 HOURS
Storage Usage
Provides a daily summary of the amount of storage that is used on all QRadar appliances.
SELECT DATEFORMAT(starttime, 'yyyy-MM-dd') as "Date",
"Hostname" as "QRadar Appliance Name",  LONG(MAX("Value")/(1024*1024*1024))
as "Storage Used (GB)" FROM events  WHERE (qid = 94000001) AND ((LONG(starttime/1000)%(24*3600))
< 20) AND ("Metric ID" = 'DiskSpaceUsed') AND (Element = '/store')
GROUP BY "Date", "Hostname" ORDER BY "Date", "Hostname"
Run the search for a minimum of 1 day to return results. To improve results, index the Metric ID custom property.
CPU Usage
Provides a break-down of CPU time that is used by each component on every QRadar appliance
SELECT DATEFORMAT(starttime, 'yyyy-MM-dd') as "Date",
"Hostname" as "QRadar Appliance Name",  "Component Type", LONG(SUM("Value"))
as "CPU Time" FROM events  WHERE (qid = 94000001)  AND ("Metric ID"
= 'ProcessCPUTime')  GROUP BY "Date", "Hostname", "Component Type"
ORDER BY "Date", "Hostname", "Component Type"
Memory Usage
Provides a break-down of heap memory that is used by each component on every QRadar appliance.
SELECT DATEFORMAT(starttime, 'yyyy-MM-dd') as "Date",
"Hostname" as "QRadar Appliance Name",  "Component Type", LONG(SUM("Value")/(1024*1024*1024))
as "Memory Usage Per Day (GB)" FROM events  WHERE (qid = 94000001)
 AND ("Metric ID" = 'HeapMemoryUsed')  GROUP BY "Date", "Hostname",
"Component Type" ORDER BY "Date", "Hostname", "Component Type"
Expensive CEPs, Log Sources, and Rules
Provides a complete list of expensive complex event processing (CEP), log sources, and rules that are identified by QRadar.
This statement uses the following custom properties from QRadar Development Intelligence app: expensivecp, expensivelogsource, and expensiverules.
SELECT DATEFORMAT(starttime,'yyyy-MM-dd HH:mm:ss')
as "timestamp",sourceip, "expensivecp","expensivelogsource","expensiverules",
UTF8(payload) FROM events  WHERE devicetype=147 AND (expensivecp is
not NULL OR expensivelogsource is not NULL OR expensiverules is not
NULL)  ORDER BY timestamp  DESC LAST 48 HOURS
Expensive Searches
Provides a list of searches that were run in the past 24 hours. The list is sorted based on the execution time.
This statement uses the following custom properties from QRadar Development Intelligence app: expensivecp, expensivelogsource, and expensiverules.
SELECT "searchid", "searchpriority", "searchlimit",
"searchtime"  FROM events  WHERE qid=28250295  ORDER BY searchtime
 DESC  LAST 24 HOURS
Executed AQL Searches by User
Provides a list of all searches that were run by each user.
This statement uses the following custom properties from QRadar Development Intelligence app: expensivecp, expensivelogsource, and expensiverules.
SELECT username, "Ariel Source", "Ariel Cursor
ID", "searchpriority", "AQL Statement"  FROM events  WHERE qid=28250254
 ORDER BY username  LAST 2 HOURS
Copying Query Samples
If you copy and paste a query sample that contains single or double quotation marks, you must retype the quotation marks to be sure that the query parses.
Use Cases for AQL Parameters
Parameters help make it simple to reuse common elements in multiple AQL queries so that it's easier to create widgets and share them. You no longer need to create single queries for similar entities. Any query that uses the parameter can automatically use the value.
Use parameters to represent common entities, such as the IP of your console. For example, rather than typing the unique IP address into each query of every relevant chart, add the specific IP address into the Console_IP parameter. Any workspace widgets that use that parameter is instantly updated.
- Search Events for a Specific User
- Investigate Events During Specific Time Periods
- Sharing Dashboards with Others
Search Events for a Specific User
You’re a senior analyst in a SOC and want to investigate some suspicious behavior of one of your users, Bob. Build a dashboard that captures information you need to care about when Bob does something malicious. For example, how many logins are associated with Bob in the last hour? Create parameters for username, events per user, time period, time value, sourceip, and destinationip.
Include widgets that cover the top event categories, top 10 log sources, location of events, events per user, and time of day. When you export and share the dashboard with others, they can replace Bob's user name with the user name of their choice.
Investigate Events During Specific Time Periods
In a time series chart, you see a large spike in the number of login failure events. Change the time period and run the query again to see when the spike started. For example, if you change the time period to the last 30 days instead of the last 4 days, was that when the spike started?
Sharing Dashboards with Others
Your team shares responsibility for managing several managed hosts around the world. You create a dashboard that monitors specific servers for various health metrics, such as top disk usage and disk usage distribution. Create a parameter for servername, and then share the dashboard with your colleagues. All that they need to do is add the server names that they monitor into the parameter values, and they get results specific to their servers.
Creating AQL Parameters for Your Workspace Dashboards
Create parameters that you can use in all of your widgets with an AQL data source, such as Time Period and Time Value. Using common parameters and default values can reduce the time that it takes to create or edit individual AQL queries for your widgets.
In the AQL statement, parameters appear within curly braces, as in the following example:
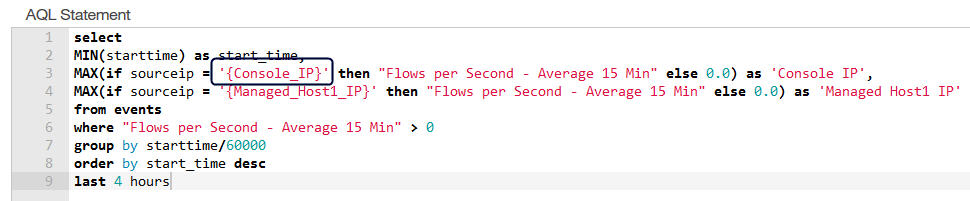
Because curly braces are also used in an AQL statement within a quoted string (a string literal between quotation marks), you must use the backward slash (\) as an escaping character before the opening curly brace. This syntax helps ensure that QRadar Pulse doesn't interpret the quoted string as a parameter and cause incorrect query results. If you have a backward slash in a quoted string, add an extra backward slash as the escaping character.
From a dashboard that contains AQL-based items, such as the Events and flow metrics dashboard, click More options > Manage Parameters.
The Manage Parameter Values page displays the parameters that are already created in your workspace. If any of the parameters have a default value, it is listed in the Default value column. The Number of occurrences column indicates the number of widgets that use each parameter. Hover over the number to see which widgets use the parameter.
To set a default value for a parameter, click the More options icon, enter the default value in the field, and then click Save.
Note:This action sets the default value for every widget that uses the parameter, and the Parameters card automatically updates. Alternatively, you can add a value for the parameter in specific widgets.
Note:When you change the default value for a parameter, you're changing the value everywhere the parameter is used in your workspace, except in expanded or pinned dashboards and widgets. If you don't set the value as the default value, the updated change applies only to the current session. However, if you set the value as the default, the current session value also uses that value.
To add a parameter to your workspace, click Add, give the parameter a name and default value, and then click Save.
To delete a parameter, first make sure that it doesn't belong to any widget by hovering over the number to see the names of each item. After you remove the parameter from those items, then you can click Delete.
Click Back to Dashboard to return to the main view and continue your work.
Adding Parameters to Existing AQL-based Widgets
In this example scenario, you create two parameters and add them to the Top 10 Log Sources widgets in the Events and flow metrics dashboard.
Click More options > Manage Parameters.
Click Add, and create two parameters: one called Time Period with a value of
HOURS, and one called Time Value with a value of2. Click Save after you create each parameter. The parameters are available for all widgets in your workspace.Click Back to Dashboard.
On the Top 10 Log Sources widget card, click the Edit Item icon.
In the AQL Statement field, the query looks like one of the following examples. The first example is the default; the second example has been modified for compatibility.
SELECT logsourcename(logsourceid) AS 'MY Log Sources',
LONG(SUM(eventcount) / ((MAX(endTime) - MIN(startTime) + 1) / 1000.0)) as event_rate
FROM events
GROUP BY logsourceid
ORDER BY event_rate DESC
LIMIT 10
LAST 2 HOURS
SELECT logsourcename(logsourceid) AS 'MY Log Sources',
LONG(if (MAX(endtime) > MIN(startTime) )
then (SUM(eventcount)/((MAX(endtime) - MIN(starttime))/1000.0))
else SUM(eventcount)) as event_rate
FROM events
GROUP BY logsourceid
ORDER BY event_rate DESC
LIMIT 10
LAST 2 HOURS
To modify the query in the AQL Statement field, take the following steps:
Replace
HOURSby clicking the Insert Parameter icon, and then click Insert for the Time Period parameter.Replace
2with Time Value, and then click Run Query. The updated query looks like one of the following example:SELECT logsourcename(logsourceid) AS 'MY Log Sources', LONG(SUM(eventcount) / ((MAX(endTime) - MIN(startTime) + 1) / 1000.0)) as event_rate FROM events GROUP BY logsourceid ORDER BY event_rate DESC LIMIT 10 LAST {Time Value} {Time Period}SELECT logsourcename(logsourceid) AS 'MY Log Sources', LONG(if (MAX(endtime) > MIN(startTime) ) then (SUM(eventcount)/((MAX(endtime) - MIN(starttime))/1000.0)) else SUM(eventcount)) as event_rate FROM events GROUP BY logsourceid ORDER BY event_rate DESC LIMIT 10 LAST {Time Value} {Time Period}
After the query runs successfully, click Save.
The new parameters are added to the Parameters card, and are prefaced by an asterisk (*) to indicate that they are default values for the workspace. Only parameters that are used by the widgets in this dashboard appear in the Parameters section.

Creating Widgets from a Generic API Data Source
The Generic API data source can access QRadar APIs as well as QRadar apps with exposed APIs, such as the following examples:
/api/asset_model/assets
/api/health_data/top_rules
/api/config/deployment/hosts
/api/config/event_sources/log_source_management/log_sources
/console/plugins/<QDI_appId>/app_proxy/appmetrics/get_app_memory_usage
Click Configure dashboard.
The Configure dashboard screen displays a library of available widgets, with details about each widget.
Click Create new widget.
On the New Dashboard Item page, enter a name and a description for the widget.
Select Generic API from the data source list in the Query section, and enter a URL endpoint. For more information, see For more information, see Tips for Creating Generic API Queries for Dashboard Charts.
Pick a refresh time for how often you poll the data source. The default refresh time is every minute. The shorter the refresh time, the greater the performance impact on QRadar. The refresh time starts after the query is completed. For example, if the query takes 3 minutes to complete, the refresh time starts only after the 3-minute run ends.
If the root object in the returned JSON is not the array you want to plot, enter a Results mapping to define which key contains the relevant data you want to plot. For more information, see Tips for Creating Generic API Queries for Dashboard Charts.
Optional: If the returned JSON includes a title mapping, set Use title from the result set to On. For more information, see Tips for Creating Generic API Queries for Dashboard Charts.
Click Run Query.
When you first create the widget, you can't configure the charts when no data results are returned. Try making the criteria in the fields less strict and run the query again.
Create a dashboard chart in the Views section.
Because you can create multiple views and charts from the same query, give the view a unique name. By default, the chart's title and status on the title bar are displayed; to hide them, click the More options icon and switch the settings to Off.
Select a chart type and configure the relevant properties. For use cases to help you decide which chart type to use, see Widget Chart Types.
Preview how the chart looks and then click Save.
Tips for Creating Generic API Queries for Dashboard Charts
Tips to help you create Generic API queries and dashboard charts more easily cover data requirements for specific chart types, results mapping for when the returned JSON is not an array, and dynamic titles.
Data format
The APIs that are called must return data in a specific JSON format for QRadar Pulse to be able to read the data.
Most QRadar APIs return data in a format that QRadar Pulse can process. Other APIs, such as app APIs, might require you to use QRadar Pulse results mapping to extract a specific key of the returned JSON object.
- Data requirements for tabular charts
- Data requirements for pie charts and single-series bar charts
- Data requirements for time series charts
- Data requirements for scatter geographic charts
- Data requirements for choropleth geographic charts
- Results mapping
- Dynamic title
Data requirements for tabular charts
For tabular charts, APIs must return a JSON array of objects representing tabular data. For example:
[{
      "rowstring": "Thanksgiving eCard Emails Distributing Malware",
      "category": "Threat Activity",
      "relevance": "25%",
      "href": "/app/href"
    }, {
      "title": "PyXie - RAT Written In Python",
      "category": "Threat Activity",
      "relevance": "25%",
      "href": "/app/href"
    }, ...
Data requirements for pie charts and single-series bar charts
For pie charts and single-series bar charts, APIs must return a JSON array that contains at least one label and one numeric metric. For example:
[{
    "Country": "Europe",
    "Count": 97
  }, {
    "Country": "Middle East",
    "Count": 85
  }, {
    "Country": "North America",
    "Count": 83
  }, ...
Data requirements for time series charts
For time series charts, APIs must return a JSON array that contains at least one time-based metric using a valid date or milliseconds format, and one or many numeric metrics to plot on the Y-axis. The data must be ordered by time. For example:
[{
    "date": "2020-02-18",
    "Phishing": 7.21,
    "C2": 82.67,
    "Malware": 272.05,
    "EarlyWarning": 448.32
  }, {
    "date": "2020-02-19",
    "Phishing": 7.47,
    "C2": 94.14,
    "Malware": 121.84,
    "EarlyWarning": 665.33
  }, {
    "date": "2020-02-20",
    "Phishing": 8.05,
    "C2": 92.35,
    "Malware": 120.71,
    "EarlyWarning": 736.9
  }, ...
Data requirements for scatter geographic charts
Scatter geographic charts require a stringified JSON object (that is, an object that is converted by using the JSON.stringify() JavaScript function) containing a geo_json key with coordinates, and one numeric metric. For example:
[{
    "sourceIP": "81.12.213.121",
    "geoSource": "{\"geo_json\":{\"coordinates\":[44.4354,26.1033],\"type\":\"Point\"}}",
    "geoDest": "{\"geo_json\":{\"coordinates\":[1.0,38.0],\"type\":\"Point\"}}",
    "eventCount": 50
  }, {
    "sourceIP": "59.154.60.0",
    "geoSource": "{\"geo_json\":{\"coordinates\":[-33.494,143.2104],\"type\":\"Point\"}}",
    "geoDest": "{\"geo_json\":{\"coordinates\":[53.3472,-6.2439],\"type\":\"Point\"}}",
    "eventCount": 60
  }, { ...
Data requirements for choropleth geographic charts
Choropleth geographic charts require a stringified JSON object (that is, an object that is converted by using the JSON.stringify() JavaScript function) containing a country key with either the country/region name or the ISO-3 code of the country/region, and one numeric metric. For example:
[{
    "sourceIP": "81.12.213.121",
    "geoCountry": "{\"country\":{\"confidence\":null,\"name\":\"Romania\",\"iso_code\":\"ROU\",\"geo_id\":798549}}",
    "eventCount": 50
  }, {
    "sourceIP": "59.154.60.0",
    "geoCountry": "{\"country\":{\"confidence\":null,\"name\":\"Australia\",\"iso_code\":\"AUS\",\"geo_id\":2077456}}",
    "eventCount": 60
  }, { ...
Results mapping
If the root object in the returned JSON is not the array you want to plot, use the Results mapping field to define which key contains the relevant data you want to plot.
The results mapping uses the JSON dot (.) operator to traverse the document, starting from the root node. For example, in the following JSON object, the relevant data is under the items key, which is under the table root node. A table.items mapping is required for QRadar Pulse to read the items array and ignore all other keys:
{
  "table": {
    "title": "Top 5 most relevant threats",
    "columns": [{
      "title": "Threat",
      "key": "title",
      "subkey": "category",
      "width": 75
    }, {
      "title": "X-Force Threat Score",
      "key": "relevance",
      "width": 0
    }],
    "items": [{
      "title": "Thanksgiving eCard Emails Distributing Malware",
      "category": "Threat Activity",
      "relevance": "25%",
      "href": "/app/href"
    }, {
      "title": "PyXie - RAT Written In Python",
      "category": "Threat Activity",
      "relevance": "25%",
      "href": "/app/href"
    }, { ...Copy code
If the returned JSON object itself is an array, as is the case for most default QRadar APIs, no mapping is necessary. But with QRadar apps, the returned JSON might have a different format.
Dynamic title
You can override the QRadar Pulse view name by using a dynamic title that describes the current state of the data. For example, a chart is titled "World Malicious Activity: <threat_name> ", where the threat name changes over time. Dynamic titles require a title key with the dynamic title name, as shown in the following example.
{
  "title": "Worldwide Malicious Activity: emotet",
  "items": [{
    "sourceIP": "81.12.213.121",
    "geoSource": "{\"geo_json\":{\"coordinates\":[44.4354,26.1033],\"type\":\"Point\"}}",
    "geoDest": "{\"geo_json\":{\"coordinates\":[1.0,38.0],\"type\":\"Point\"}}",
    "geoCountry": "{\"country\":{\"confidence\":null,\"name\":\"Romania\",\"iso_code\":\"ROU\",\"geo_id\":798549}}",
    "eventCount": 50
  }, { ...
If the title key is under the root node, use the Title mapping field. The title mapping uses the JSON dot (.) operator to traverse the document, starting from the root node. For example, if the title key is under a table root node, you would specify a table.title mapping.