Troubleshooting Session Processing
Session Smart Routers behave as both a firewall and a router. It is in its name – to be session smart – where the platform can apply a surgical amount of policy, treatment, and offer a rich amount of application data for use in understanding network performance.
Version History
| Release | Modification |
|---|---|
| 7.1.0-r1 | Session processing alarm configurations added |
Session Processing on the Session Smart Router
When it comes to determining proper performance and utilization of an SSR, you must look at three characteristics:
- Throughput
- Session Capacity
- Connections per second (CPS)
This document focuses on the last of these three factors, CPS, and understanding its utilization related to the SSR's ability to process sessions.
Connections per second influence how quickly the SSR can create, modify, and store a new session. Every system has a maximum session processing rate that is governed by the platform on which it runs. In SSR software versions prior to 6.1, session processing is single-threaded and is rate-limited by CPU clock speed and overall CPU busy-ness (as the OS scheduler delegates compute cycles to this task). In software versions 6.1 and beyond, session processing is multi-threaded and can take advantage of additional host cores. The SSR uses an RSS hashing mechanism to distribute traffic into the session processing threads based on the five tuples of packet (source IP, source port, destination IP, destination port, protocol).
The session processing thread is responsible for session setup and modify operations. Modify operations are performed for a flow move (peer path failure or SLA violation) or with the use of application identification which updates the session after DPI. The session processing thread has a buffer queue for handling bursts of traffic or when the thread is “backed up”. As the queue fills up, latency increases for all packets in the queue. This will translate into end-to-end latency within the network. Always scale the system with ample headroom to handle peak session processing load.
The SSR should be operating at no more than 80% utilization of its session processing threads, allowing it to handle bursty conditions that are triggered as a result of path migrations. When a path failure occurs, or a service is no longer within SLA, the SSR modifies existing sessions to ensure they are traversing the optimal pathway. For systems carrying considerable load, this could be many thousands of sessions that need to be updated.
Enabling Multi-Threading
While SSR software versions 6.1.x support multi-threading for session processing, it is not enabled by default. Reference the Configuration Element Reference guide for details on the configuration parameters. Note that this feature must be enabled on both nodes if operating in a HA cluster.
It is not recommended to set session-processor-mode to manual unless instructed by a member of Juniper support or the engineering team to ensure that this value is right-sized for the environment.
config authority router <router-name> node <node-name> session-setup-scaling   true
config authority router <router-name> node <node-name> session-processor-mode  automatic
Once the configuration changes have been made and committed, a restart of the SSR service is required for the changes to take effect.
Examining Utilization of Session Processing Threads
To view and understand host CPU usage, you must look at the individual session processing threads as well as the other threads in the system. This is due to how the OS scheduler works, distributing compute cycles to available CPUs.
SSR Versions < 6.1
In software versions prior to 6.1, examine the utilization of the PacketProcessing thread by viewing the output of the command top -H d 1.0 | grep PacketProcess from the OS shell, as seen below.
[centos@SOL-DL360-DUT1 ~]$ top -H d 1.0 | grep PacketProcess
 8590 root      20   0  265.2g   7.2g 113312 S 41.2  2.9 177:25.82 PacketProcessin
 8590 root      20   0  265.2g   7.2g 113312 S 39.8  2.9 177:26.23 PacketProcessin
 8590 root      20   0  265.2g   7.2g 113312 R 42.2  2.9 177:26.66 PacketProcessin
 8590 root      20   0  265.2g   7.2g 113312 S 42.7  2.9 177:27.10 PacketProcessin
 8590 root      20   0  265.2g   7.2g 113312 R 41.2  2.9 177:27.52 PacketProcessin
 8590 root      20   0  265.2g   7.2g 113312 R 37.3  2.9 177:27.90 PacketProcessin
 8590 root      20   0  265.2g   7.2g 113312 R 46.6  2.9 177:28.38 PacketProcessin
 8590 root      20   0  265.2g   7.2g 113312 R 52.0  2.9 177:28.91 PacketProcessin
 8590 root      20   0  265.2g   7.2g 113312 S 56.3  2.9 177:29.49 PacketProcessin
 8590 root      20   0  265.2g   7.2g 113312 R 61.8  2.9 177:30.12 PacketProcessin
SSR Versions >= 6.1
In software versions 6.1 and greater, the session processing thread(s) are named Session-Proc-XX where XX is a zero-based index of the number of threads allocated to session processing. An easy way to view the number of threads allocated to session processing as well as seeing current utilization is to run the command show stats process thread process-name highway | grep SessionProc | grep "cpu usage".
admin@test1.combo1# show stats process thread process-name highway | grep SessionProc | grep "cpu usage"
✔ Piping output...
 cpu usage             test1   highway        SessionProc-00         61.8
 cpu usage             test1   highway        SessionProc-01           55
 cpu usage             test1   highway        SessionProc-02           48
 cpu usage             test1   highway        SessionProc-03         40.6
 cpu usage             test1   highway        SessionProc-04         30.2
 cpu usage             test1   highway        SessionProc-05           20
Top can be used to follow the session processing threads:
[centos@SOL-DL360-DUT1 ~]$ top -H d 1.0 | grep SessionProc
 7532 root      20   0  266.9g   8.8g 120940 S 60.0  3.5  39:48.64 SessionProc-00
 7533 root      20   0  266.9g   8.8g 120940 R 55.0  3.5  37:18.75 SessionProc-01
 7534 root      20   0  266.9g   8.8g 120940 S 55.0  3.5  34:42.19 SessionProc-02
 7535 root      20   0  266.9g   8.8g 120940 S 45.0  3.5  31:33.67 SessionProc-03
 7536 root      20   0  266.9g   8.8g 120940 S 35.0  3.5  27:27.56 SessionProc-04
 7537 root      20   0  266.9g   8.8g 120940 S 20.0  3.5  22:51.79 SessionProc-05
Session Processing Alarms
Session exhaustion can occur silently, without immediate or obvious symptoms, posing a critical but often unnoticed risk. By collecting and monitoring session processing thread CPU usage and triggering alarms when usage exceeds defined thresholds, the SSR provides you with visibility into the system's capacity to establish new sessions.
Configuring Alarms
The following commands allow you to configure trigger and clear thresholds to monitor session processing capacity, and view the results.
The service-area-alarm-threshold-profile provides the following alarm parameters and defaults.
| command | description |
|---|---|
alarm-clear-threshold | Alarm clear threshold, configurable between 0-100%, default is 70%. |
alarm-clear-waiting-window | Alarm clear waiting window, in seconds. Must be a multiple of 5 (e.g., 5, 10, ..., 300). Default is 180 seconds. |
alarm-trigger-threshold | Alarm trigger threshold, configurable between 0-100%, default is 85%. |
alarm-trigger-waiting-window | Alarm trigger waiting window, in seconds. Must be a multiple of 5 (e.g., 5, 10, ..., 300). Default is 180 seconds. |
delete | Delete configuration data |
override-generated | Force auto-generated configuration and any modifications to it to persist on commit |
show | Show configuration data for 'service-area-alarm-threshold-profile' |
Show Commands
Use show system utilization session-processors to display the average session processing thread CPU value as well as the per-thread cpu usage.
[admin@test2.RTR_EAST_COMBO](mailto:admin@test2.RTR_EAST_COMBO)# show system utilization session-processors
Mon 2025-08-04 18:07:06 UTC
Retrieving session processor utilization...

Target: test1.combo1

============== ================ ============= ===========
Node            Thread           Utilization   peakUsage
============== ================ ============= ===========
test1.combo1 SessionProc-00     10.00000        78.000000
test1.combo1 SessionProc-01     20.000000       66.900002
Average - 15.00 -
When an alarm is triggered, use the detail parameter to view additional information.
[admin@test2.RTR_EAST_COMBO](mailto:admin@test2.RTR_EAST_COMBO)# show system utilization session-processors detail
====================
 Node: test1.combo1
====================
  State:                            alarmTriggered
  Time In State:                    30
  Time Remaining Until Transition:  10
  Average CPU:                      3.00%
  Session Processors CPU usage :
    SessionProc-00:    3.000000%
    SessionProc-01:    3.000000%
When there is no active alarm, the show system utilization detail command output displays the current status.
[admin@test2.RTR_EAST_COMBO](mailto:admin@test2.RTR_EAST_COMBO)# show system utilization session-processors detail
Target: test1.combo1

====================
 Node: test1.combo1
====================
  State:                            Normal
  Time In State:                    --
  Time Remaining Until Transition:  --
  Average CPU:                      0.00%
  Session Processors CPU usage :
    SessionProc-00:    0.000000%
    SessionProc-01:    0.000000%
Understanding CLI Output
The Service Area is the informal name given to the business logic responsible for session processing. The set of stats related to internal-application of Service Area processing are valuable to understand system behavior. These stats are monotonically increasing scalar values; you will need to compare deltas over two periods of time to get an accurate view of rate. In particular, schedule-failure and sent-timeout are signs that the session processing is unable to keep up with load or unable to handle bursty traffic patterns.
admin@test1.combo1# show stats traffic-eng internal-application internal-application "Service Area"
Wed 2023-10-18 17:03:48 UTC
✔ Retrieving statistics...

Internal Application Traffic Engineering Stats
----------------------------------------------

==================================================== ======= ====================== =============
 Metric                                               Node    Internal-application         Value
==================================================== ======= ====================== =============
 per-traffic-class buffer-capacity-exceeded-packets   test1   Service Area                     0
 per-traffic-class dequeue-aqm-drop-packets           test1   Service Area                     0
 per-traffic-class dequeue-max-latency-drop-packets   test1   Service Area                     0
 per-traffic-class dequeue-success-packets            test1   Service Area              24113256
 per-traffic-class schedule-failure-packets           test1   Service Area                     0
 per-traffic-class schedule-success-packets           test1   Service Area              24113256
 schedule-failure                                     test1   Service Area                     0
 schedule-success                                     test1   Service Area              24114030
 scheduler-reset                                      test1   Service Area                     0
 sent-retry                                           test1   Service Area           32121873138
 sent-success                                         test1   Service Area              24113708
 sent-timeout                                         test1   Service Area                     0

Completed in 0.03 seconds
SSR software version 6.1 introduces the thread-specific metrics show stats process thread process-name highway thread-name.
admin@test1.combo1# show stats process thread process-name highway thread-name SessionProc-00
Wed 2023-10-18 17:01:07 UTC
✔ Retrieving statistics...

Process Thread Metrics
----------------------

===================== ======= ============== ================ =========
 Metric                Node    Process-name   Thread-name        Value
===================== ======= ============== ================ =========
 cpu iowait            test1   highway        SessionProc-00         0
 cpu system-usage      test1   highway        SessionProc-00       9.2
 cpu usage             test1   highway        SessionProc-00        63
 cpu user-usage        test1   highway        SessionProc-00      53.8
 queue delay           test1   highway        SessionProc-00        59
 queue depth           test1   highway        SessionProc-00         0
 queue total           test1   highway        SessionProc-00   8355742
 task errors           test1   highway        SessionProc-00         0
 task execution-time   test1   highway        SessionProc-00       389
 task total            test1   highway        SessionProc-00   8363312

Completed in 0.02 seconds
The units for queue delay and task execution-time are in microseconds.
All values are rolling averages, except for queue total and task total which are counters.
The values cpu system-usage, cpu usage, and cpu user-usage are percentages and indicate utilization of the service area thread performing session setup.
High values for queue depth and queue delay, coupled with high CPU usage values, are indicative of the service area threads not keeping up.
Metrics Retention
To view metrics over a longer period of time than the defaults, you can adjust the retention for key metrics relating to session processing. The current metrics retention defaults are as follows:
| Retention | State | Interval | Duration |
|---|---|---|---|
| short | Enabled: true | 5 seconds | 1 hour |
| intermediate | Enabled: true | 5 minutes | 1 day |
| long | Enabled: true | 1 hour | 180 days |
Increasing the retention duration and/or decreasing the interval from the defaults has the potential to impact system overhead and should be carefully considered.
For additional details about metrics retention profiles, see Configuring In-Memory Metrics.
Use the following processes and examples to adjust the retention time for session processing metrics. Procedures for both the CLI and GUI are provided.
CLI
- Create a new metrics-profile referencing the key session processing metrics. Example:
config
    authority
        metrics-profile  session-processing-metrics-profile
            name    session-processing-metrics-profile
            metric  /stats/traffic-eng/internal-application/sent-success
                id           /stats/traffic-eng/internal-application/sent-success
                description  "Internal application sent-timeout"
            exit
            metric  /stats/traffic-eng/internal-application/sent-timeout
                id           /stats/traffic-eng/internal-application/sent-timeout
                description  "Internal application sent-timeout"
            exit
            metric  /stats/traffic-eng/internal-application/sent-retry
                id           /stats/traffic-eng/internal-application/sent-retry
                description  "Internal application sent-retry"
            exit
            metric  /stats/aggregate-session/node/session-arrival-rate
                id           /stats/aggregate-session/node/session-arrival-rate
                description  "Session arrival rate"
            exit
            metric  /stats/process/thread/queue/delay
                id           /stats/process/thread/queue/delay
                description  "Packet processing thread queue delay"
            exit
            metric  /stats/process/thread/cpu/usage
                id           /stats/process/thread/cpu/usage
                description  "CPU thread usage"
            exit
            metric  /stats/process/thread/queue/depth
                id           /stats/process/thread/queue/depth
                description  "Packet processing thread queue depth"
            exit
        exit
    exit
exit
- For each router, reference the metrics profile in the
system->metricssettings, and set the retention tolong. Example:
config
    authority
        router           my-router
            system
                metrics
                    profile  session-processing-metrics-profile
                        name       session-processing-metrics-profile
                        retention  long
                    exit
                exit
            exit
        exit
    exit
exit
GUI
Use the process below to create a new Metrics Profile referencing the key session processing metrics.
- On the Conductor GUI, navigate to
CONFIGURATIONthenAuthority.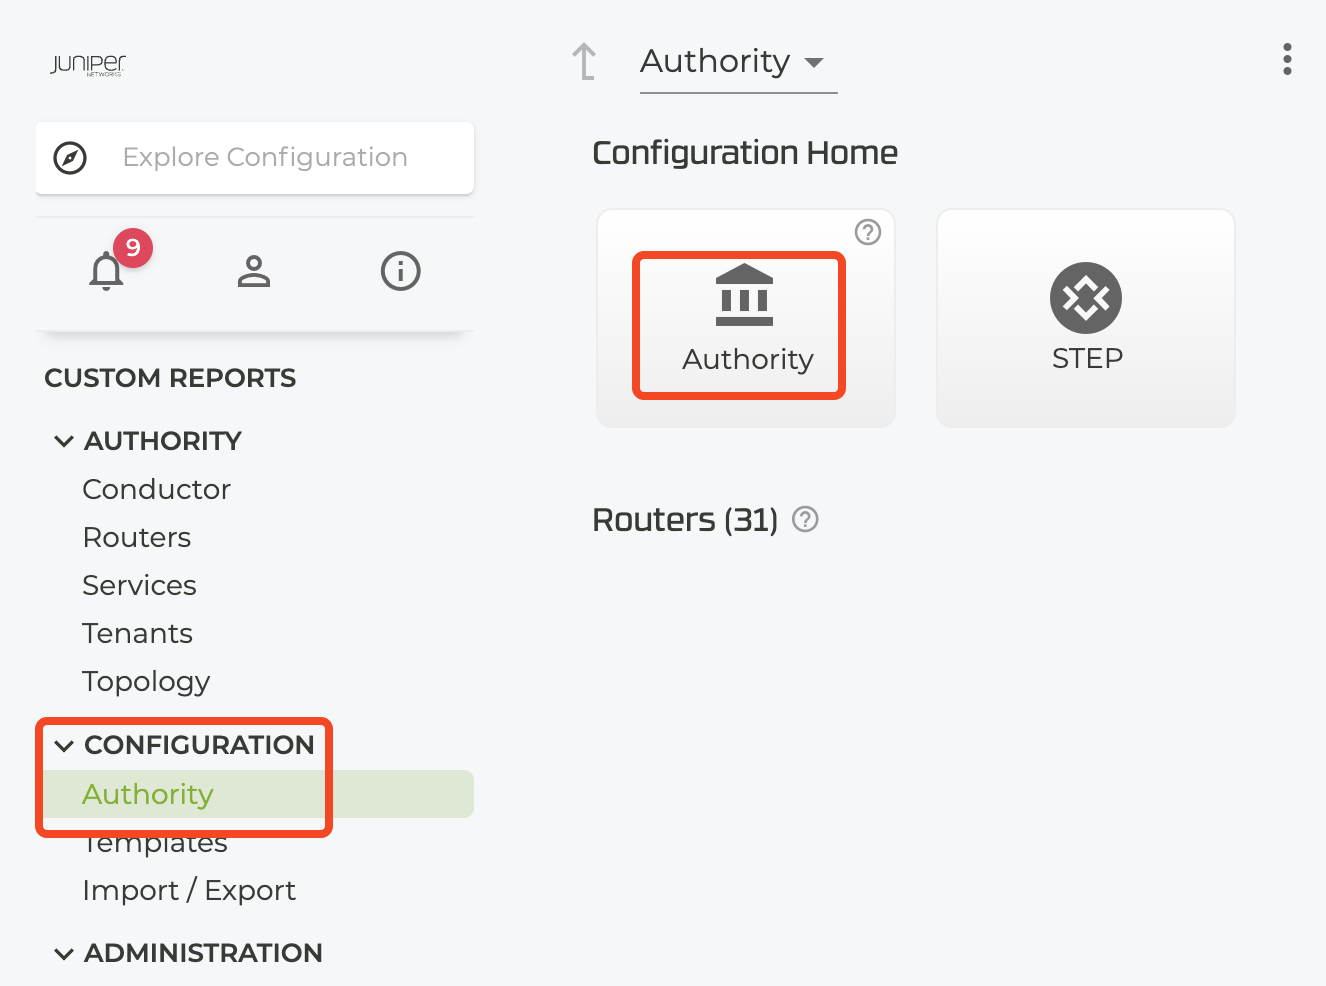
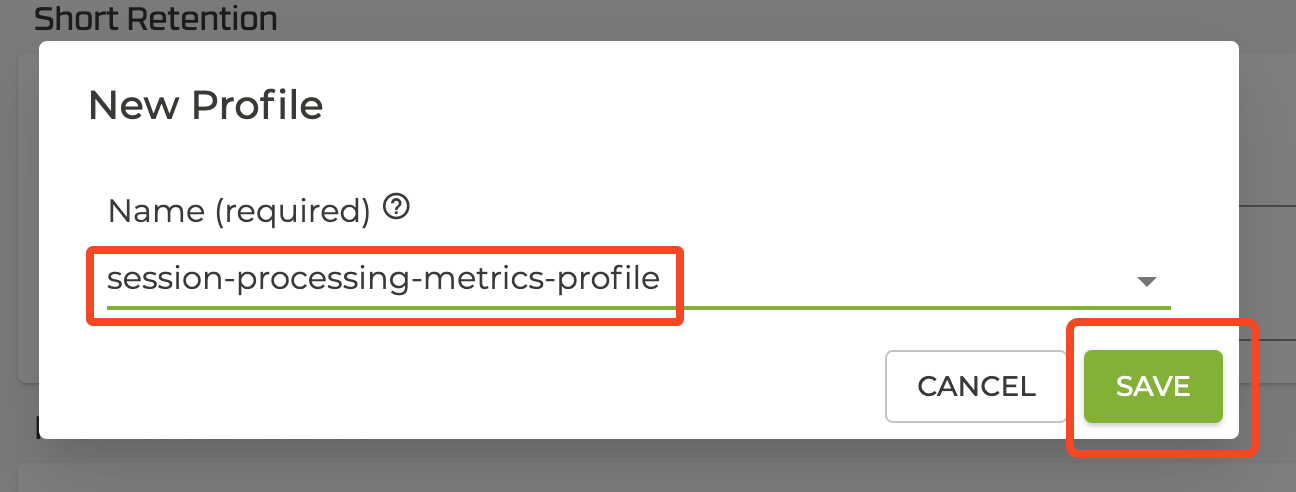
- Create a new Metrics Profile.

- Name the new Metrics Profile (example:
session-processing-metrics-profile)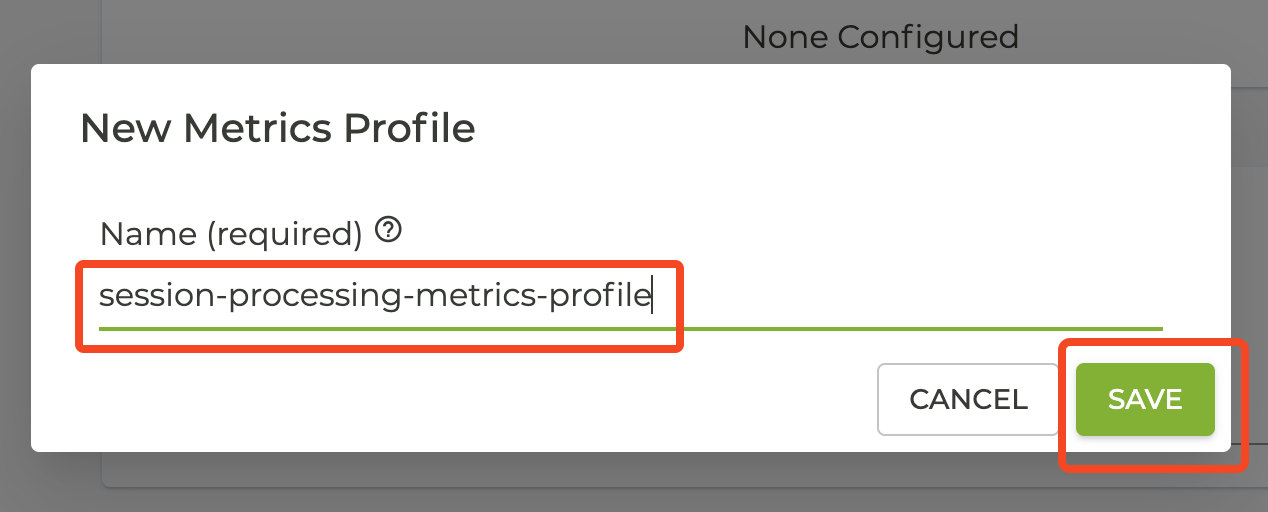
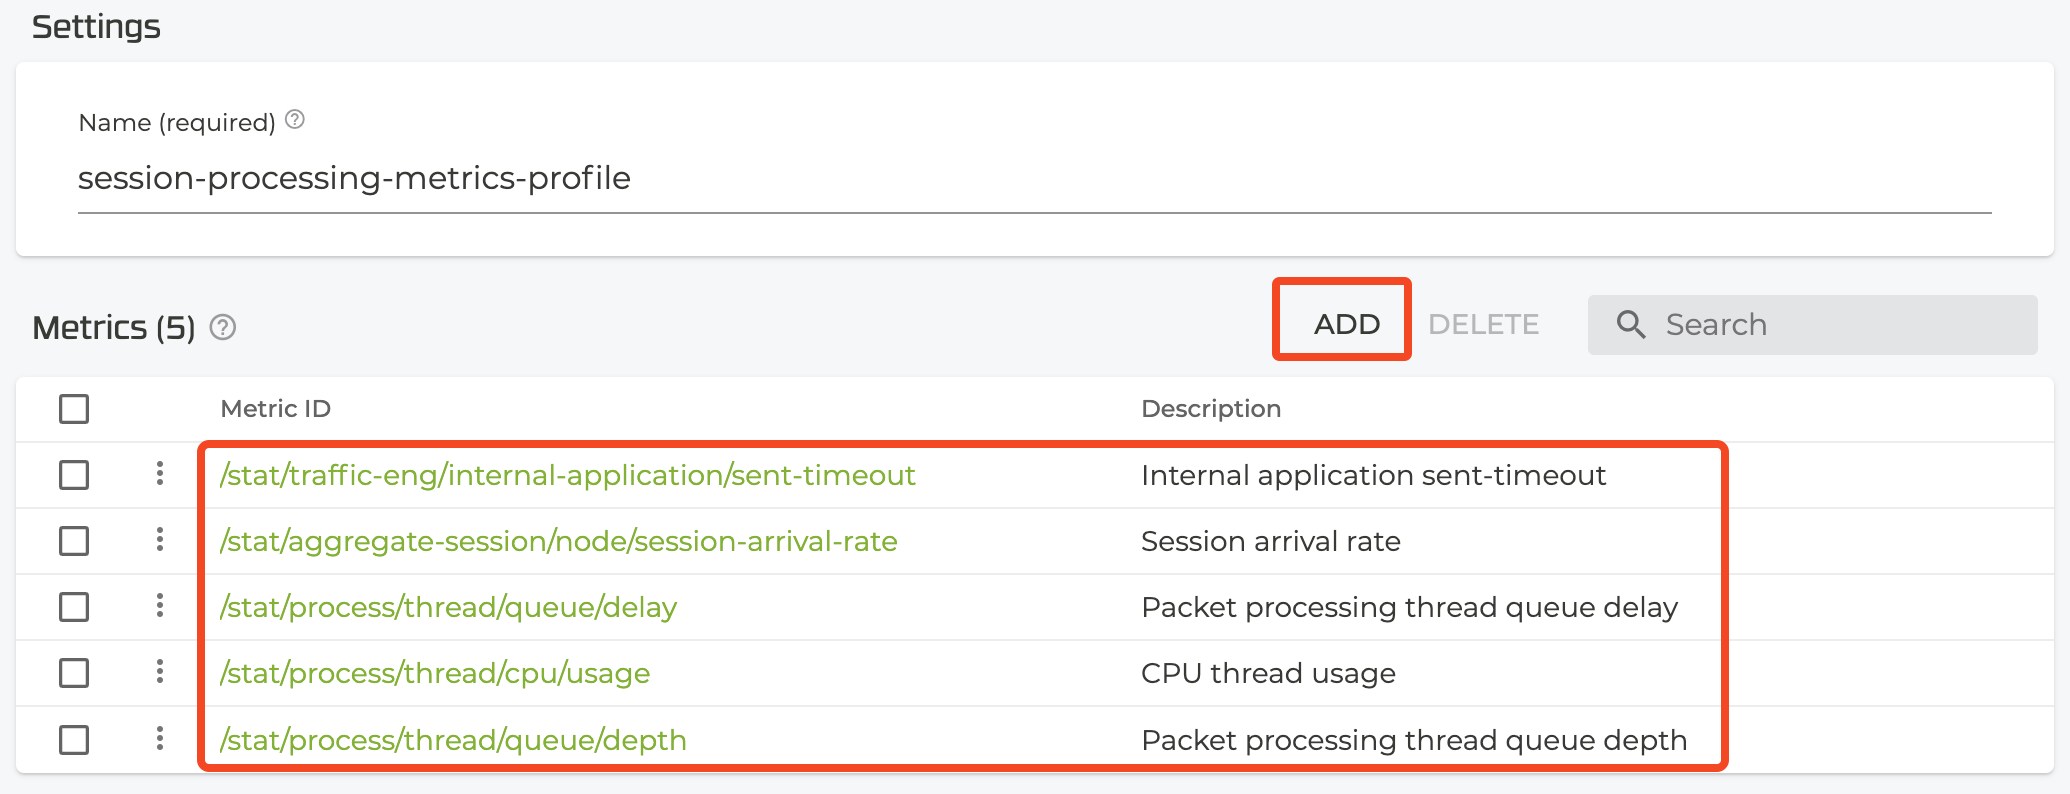
- Add each of the following session processing metrics to the profile:
/stats/traffic-eng/internal-application/sent-timeout/stats/aggregate-session/node/session-arrival-rate/stats/process/thread/queue/delay/stats/process/thread/cpu/usage/stats/process/thread/cpu/depth
For each router, reference the metrics profile in the System -> Metrics settings, and set the retention to long. Example:
- On the Conductor GUI, navigate to the router you wish to set up longer retention of session processing metrics.
- Navigate to the
SystemthenMetricssettings for the router.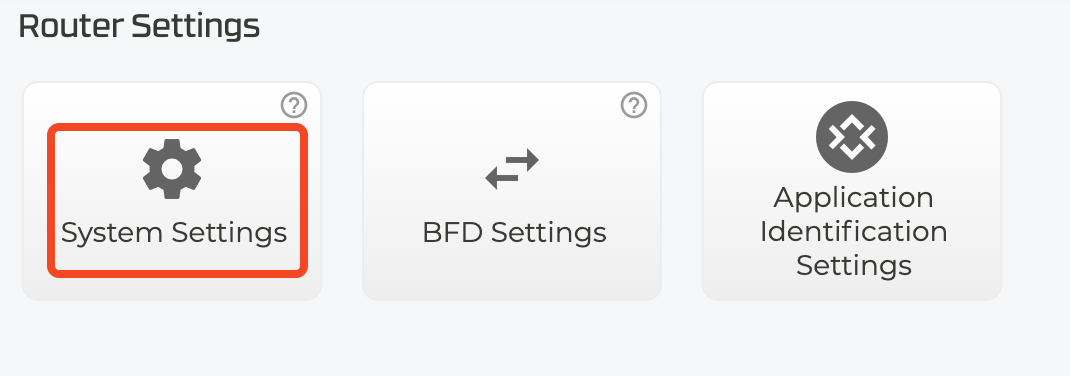
- Add a new
Metrics Profile.
- Select your session processing metrics profile from the dropdown, and save.
- Set the retention to
long.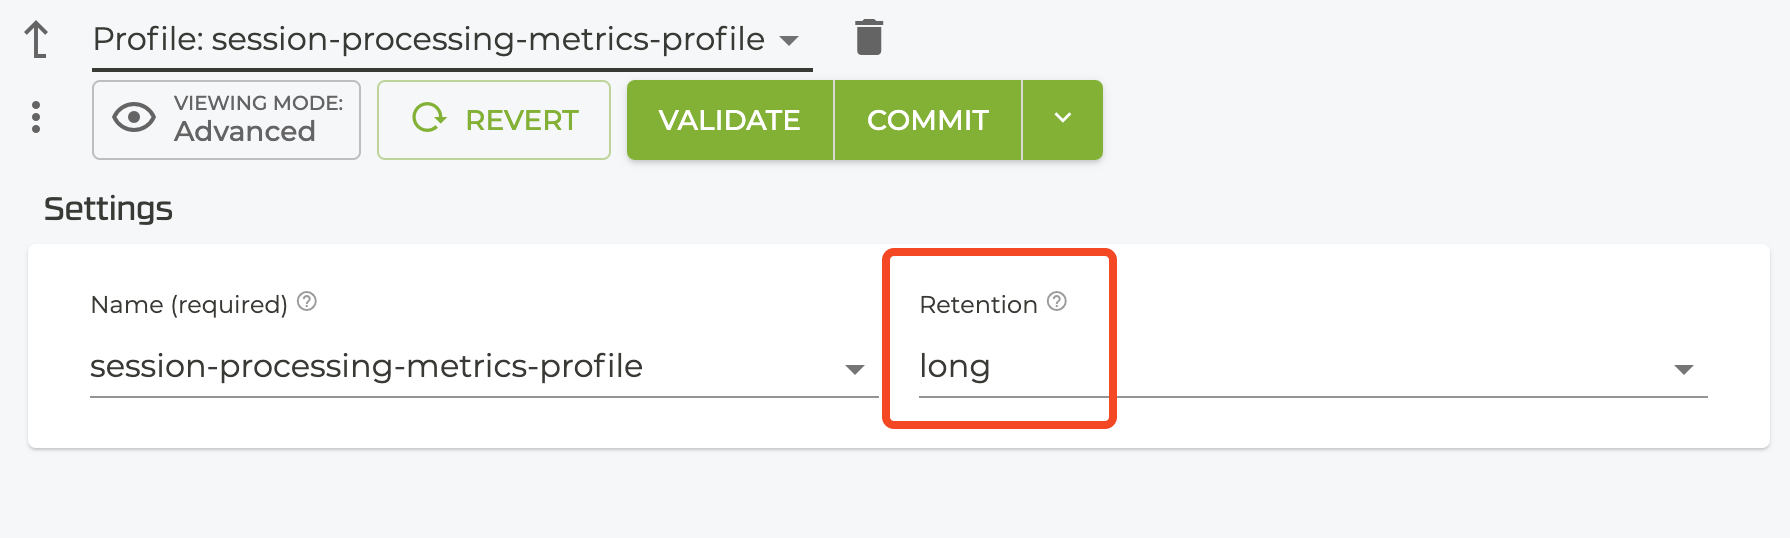
Creating a Dashboard for Active Monitoring
Creating a Custom Report on the Conductor is strongly recommended for each head-end router in an authority. Head-ends are central aggregation points for traffic and typically have the highest utilization and blast radius.
Dashboard Setup
To create a custom report, use the following procedure:
- On the Conductor GUI, navigate to
CUSTOM REPORTS. - Click on
NEWin the top-right corner. - Select
New Empty Report. - Name the report. For example:
Session Processing Utilization - <Router Name>(where<Router Name>is the name of the router on which these reports will be customized).
Time series graphs of per-thread utilization are only available on SSR software starting with 6.1.
The graph shows time series thread utilization of session processing threads. This graph can be customized per router, per node, per process, and each SessionProc thread.
When building this graph, make sure to include each of the running SessionProc threads.
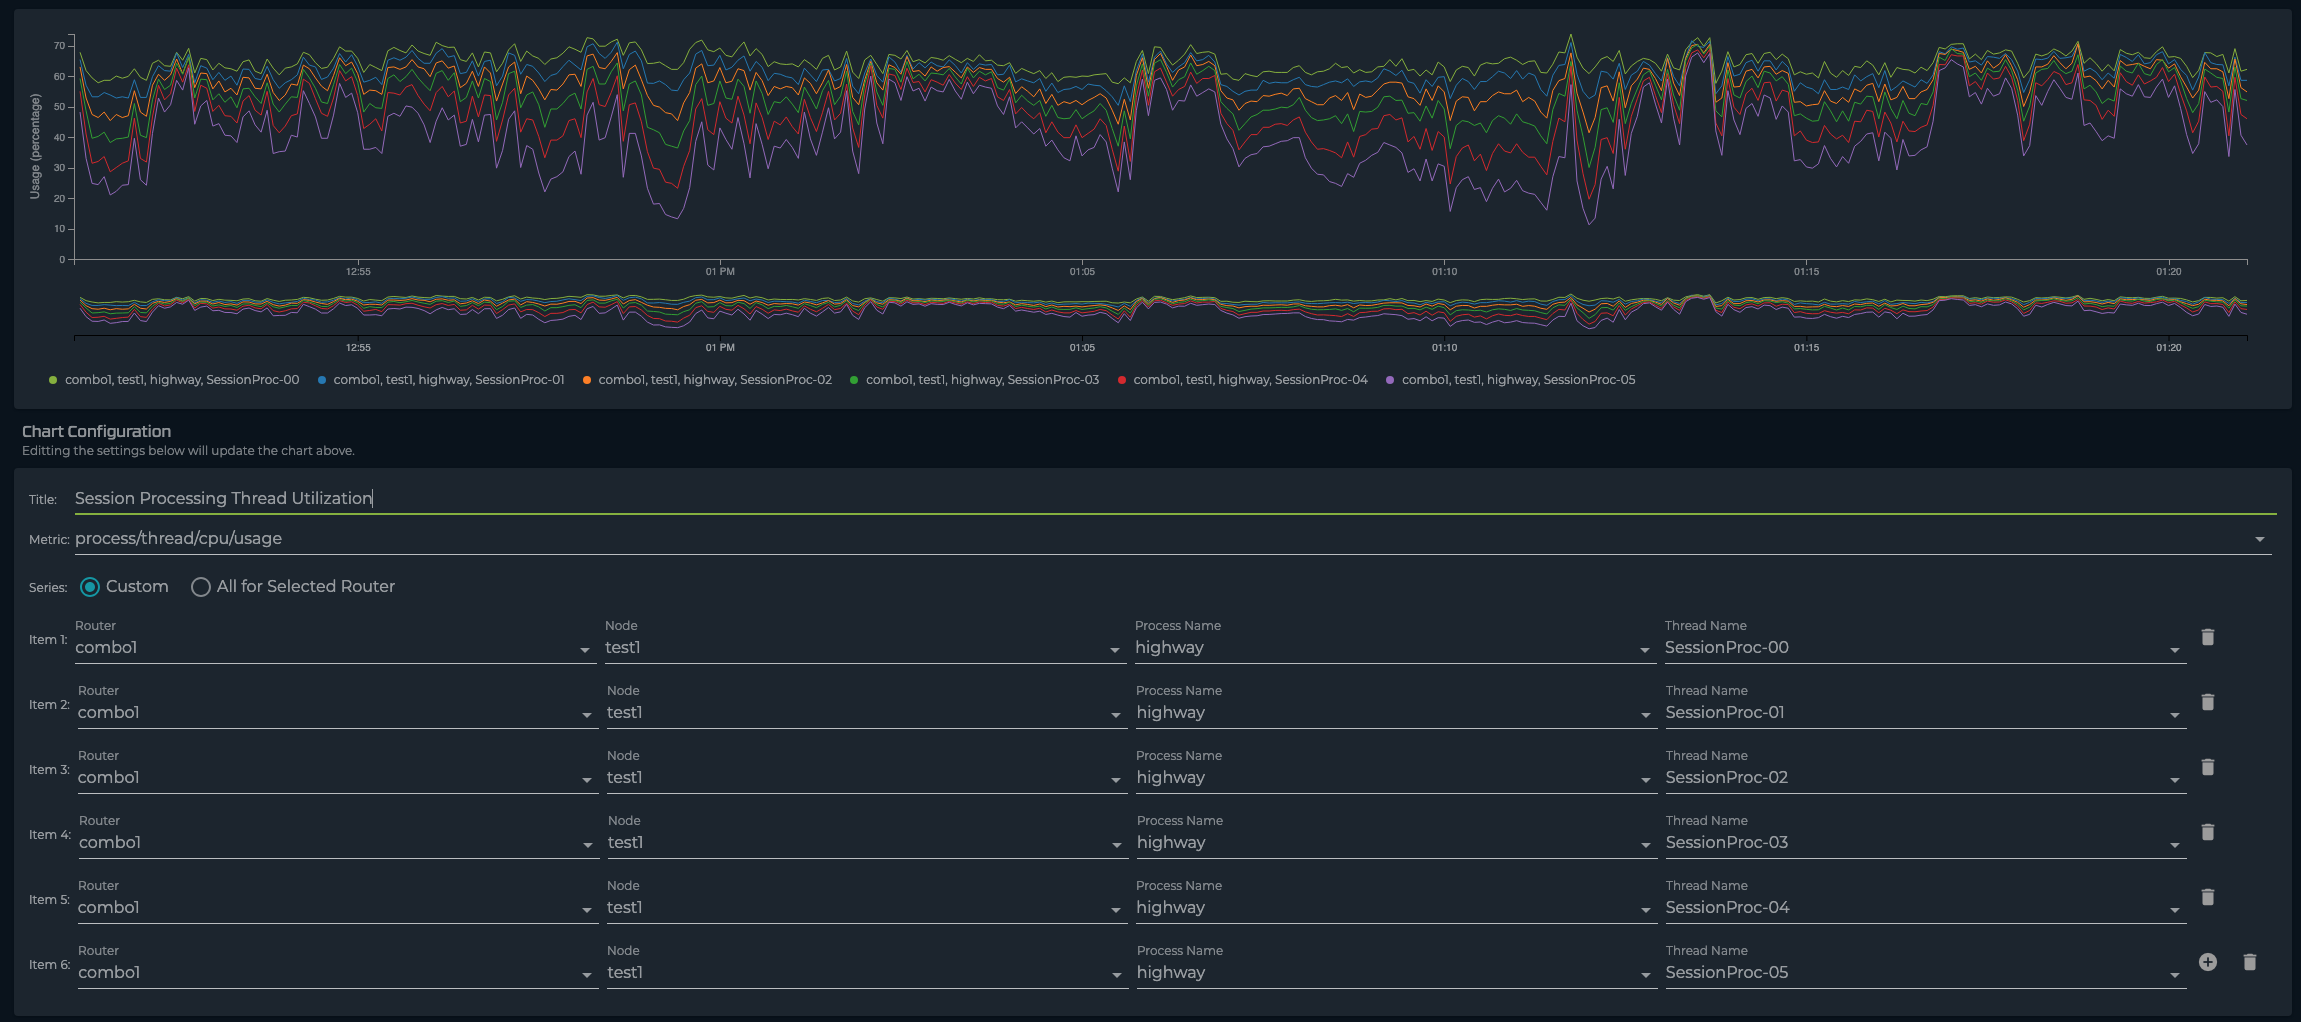 Metric:
 process/thread/cpu/usage
Series: Router <router-name> Node <node-name> Process Name 'highway' Thread Name 'SessionProc-XX'
To ensure a holistic view of session processing along with the stated above, looking that the utilization of all the other threads is important. It is valuable to determine if other processes are starving out the session processing threads.
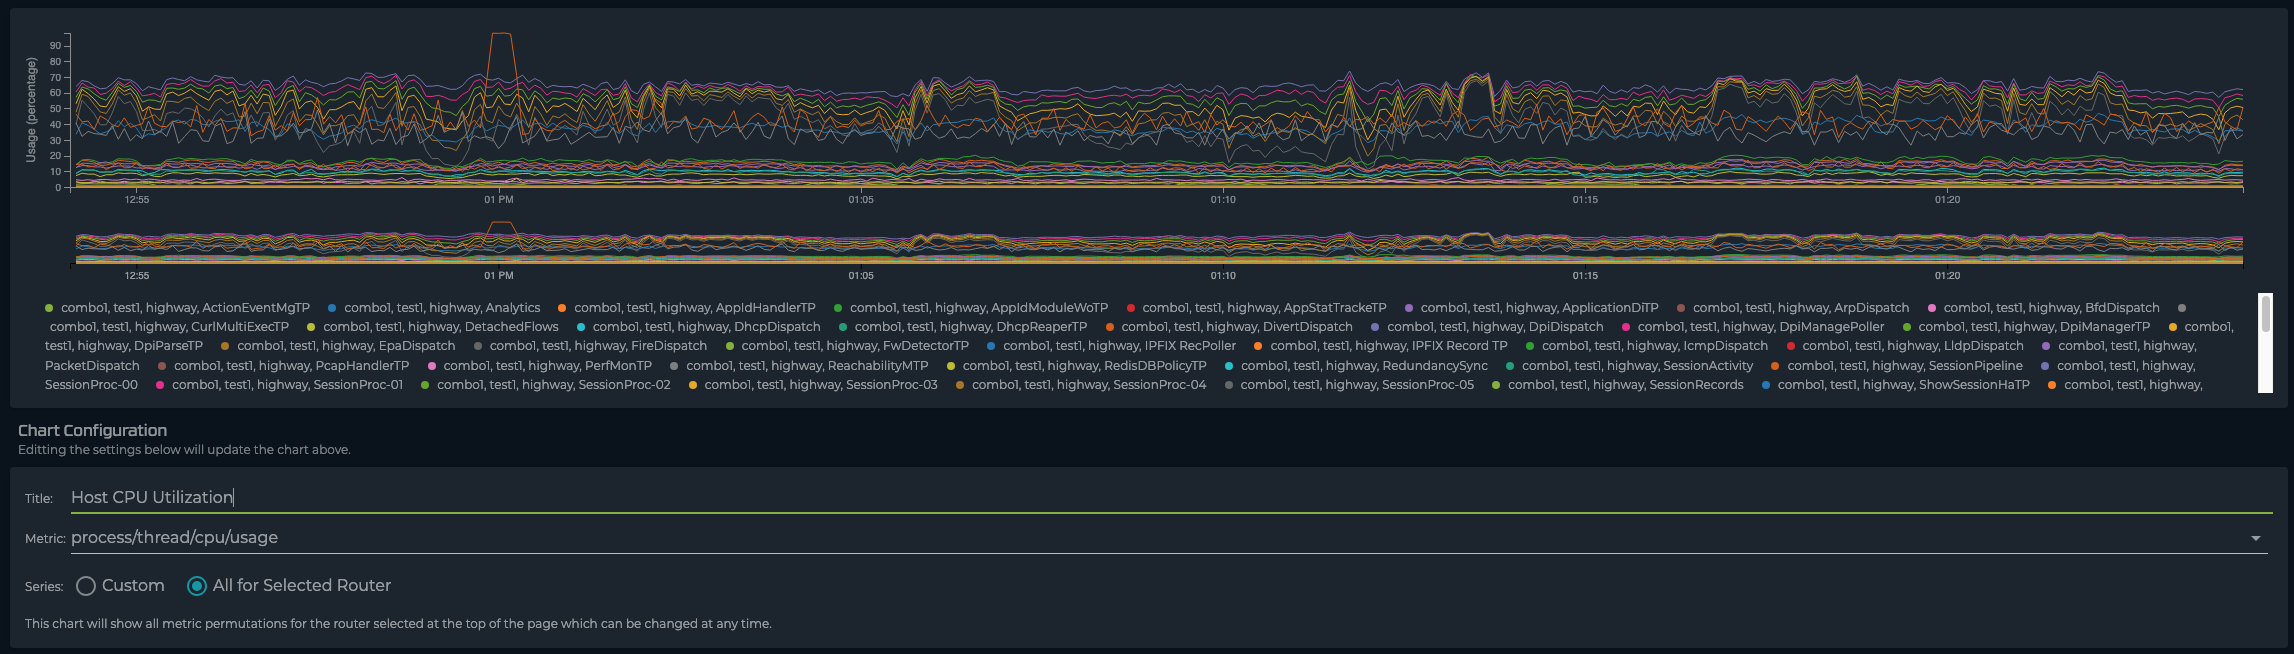 Metric:
 process/thread/cpu/usage
Series: All for Selected Router
On a production system there will be a non-zero value of packets waiting in a queue to be processed by the session processing threads. When this value increases steadily and remains at a steady state, this indicates that the system is unable to keep up with load. The following graph shows the queue depth for all packets destined for session processing. Note that this graph requires a custom series with the router, node, process and thread name specified according to the image below.
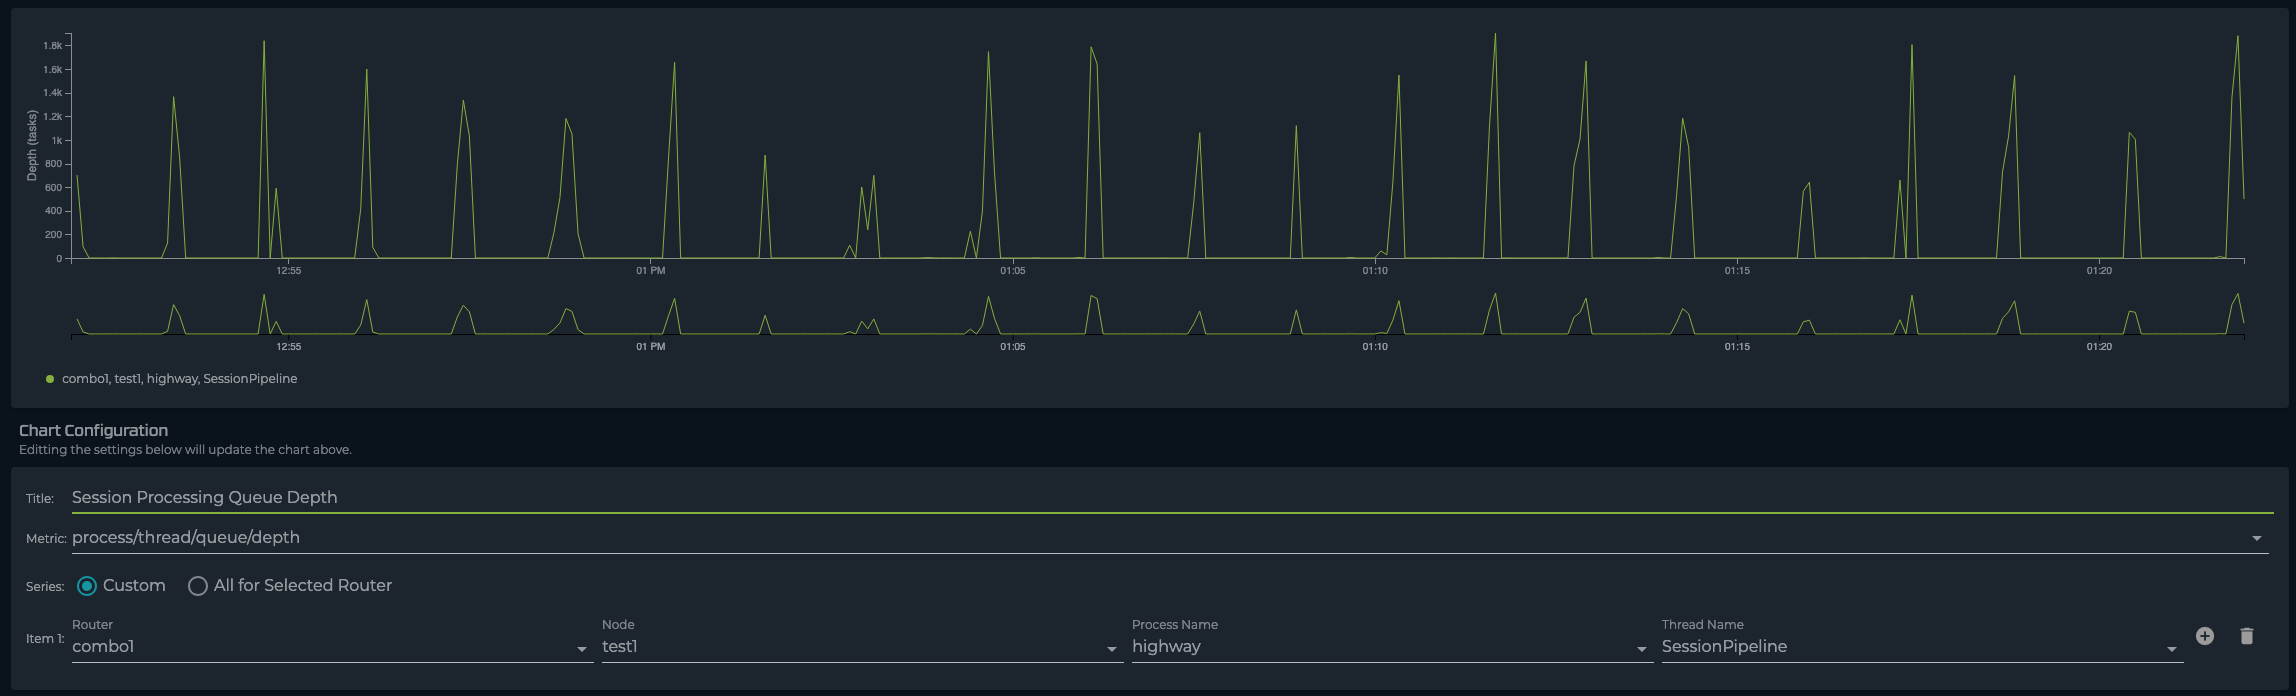 Metric:
 process/thread/queue/depth
Series: Router <router-name> Node <node-name> Process Name 'highway' Thread Name 'SessionPipeline'
Queue delay represents the average amount of time (in microseconds) packets are waiting to be processed. When this value is steadily increasing, this indicates that the system is unable to keep up with load. The following graph shows the average time packets are waiting to be processed. Note that this graph requires a custom series with the router, node, process and thread name specified according to the image below.
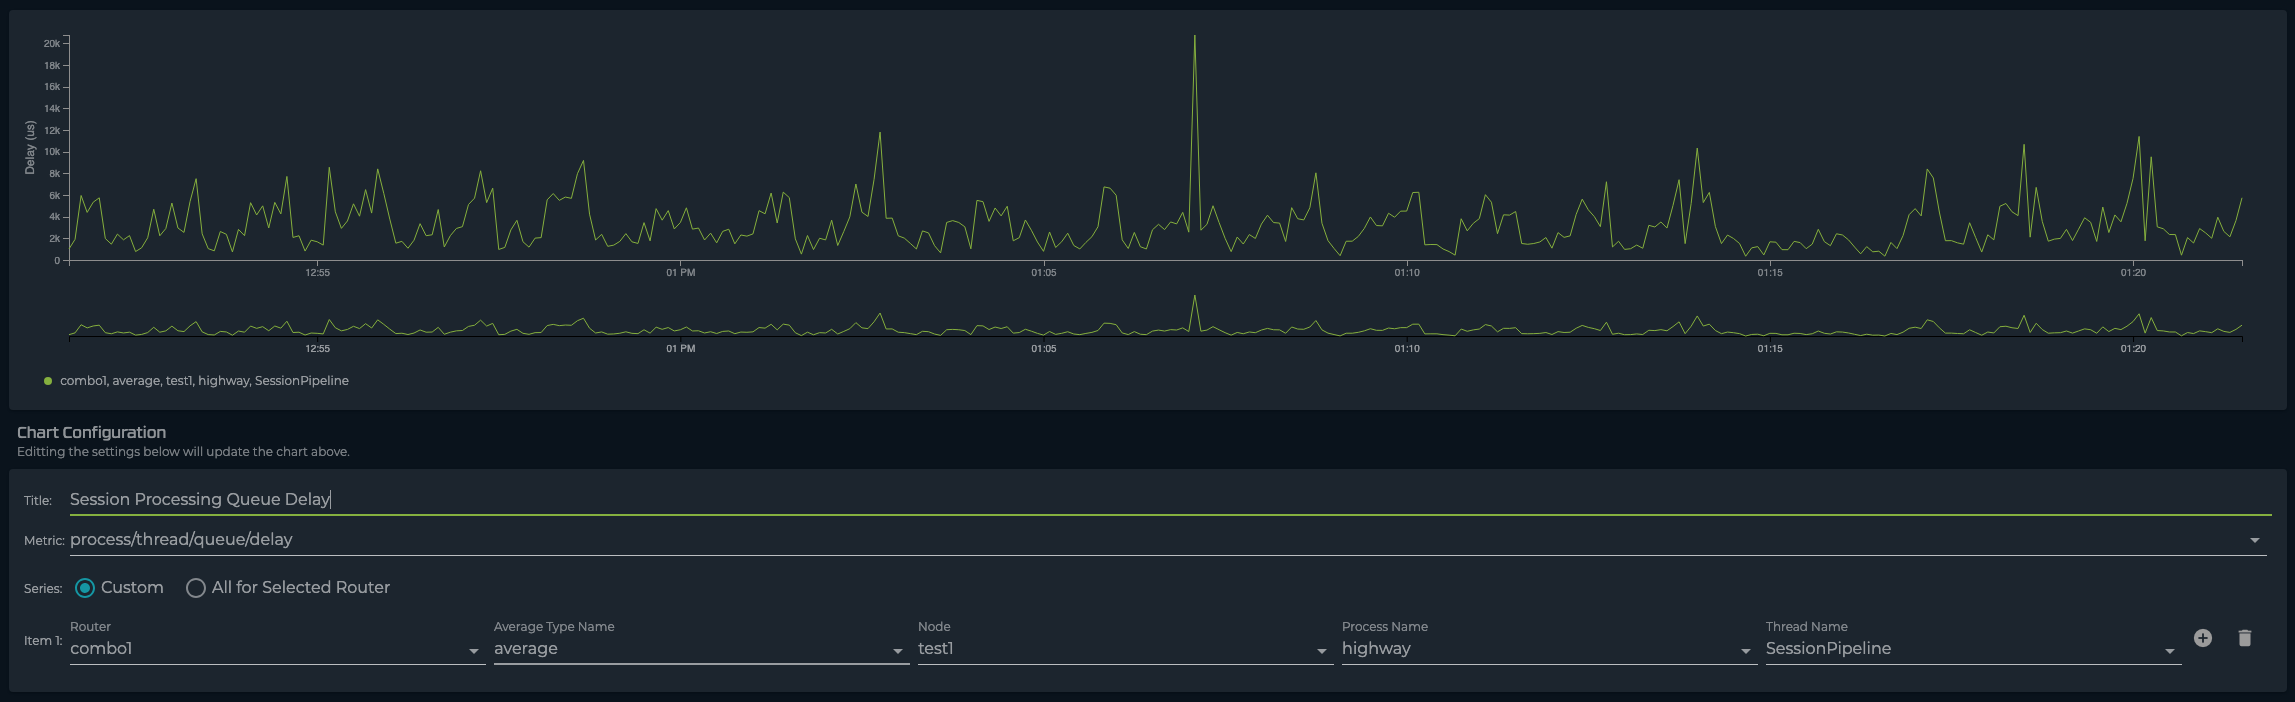 Metric:
 process/thread/queue/delay
Series: Router <router-name> Node <node-name> Process Name 'highway' Thread Name 'SessionPipeline'
The Session Processing threads operate on packets that either create or modify a session. In a steady-state environment, the majority of packets arriving to the Service Area are first packets that create a session. A KPI valuable for determining (at least partial) load of the session processing threads is session-arrival-rate, or the rate at which new sessions are being setup.
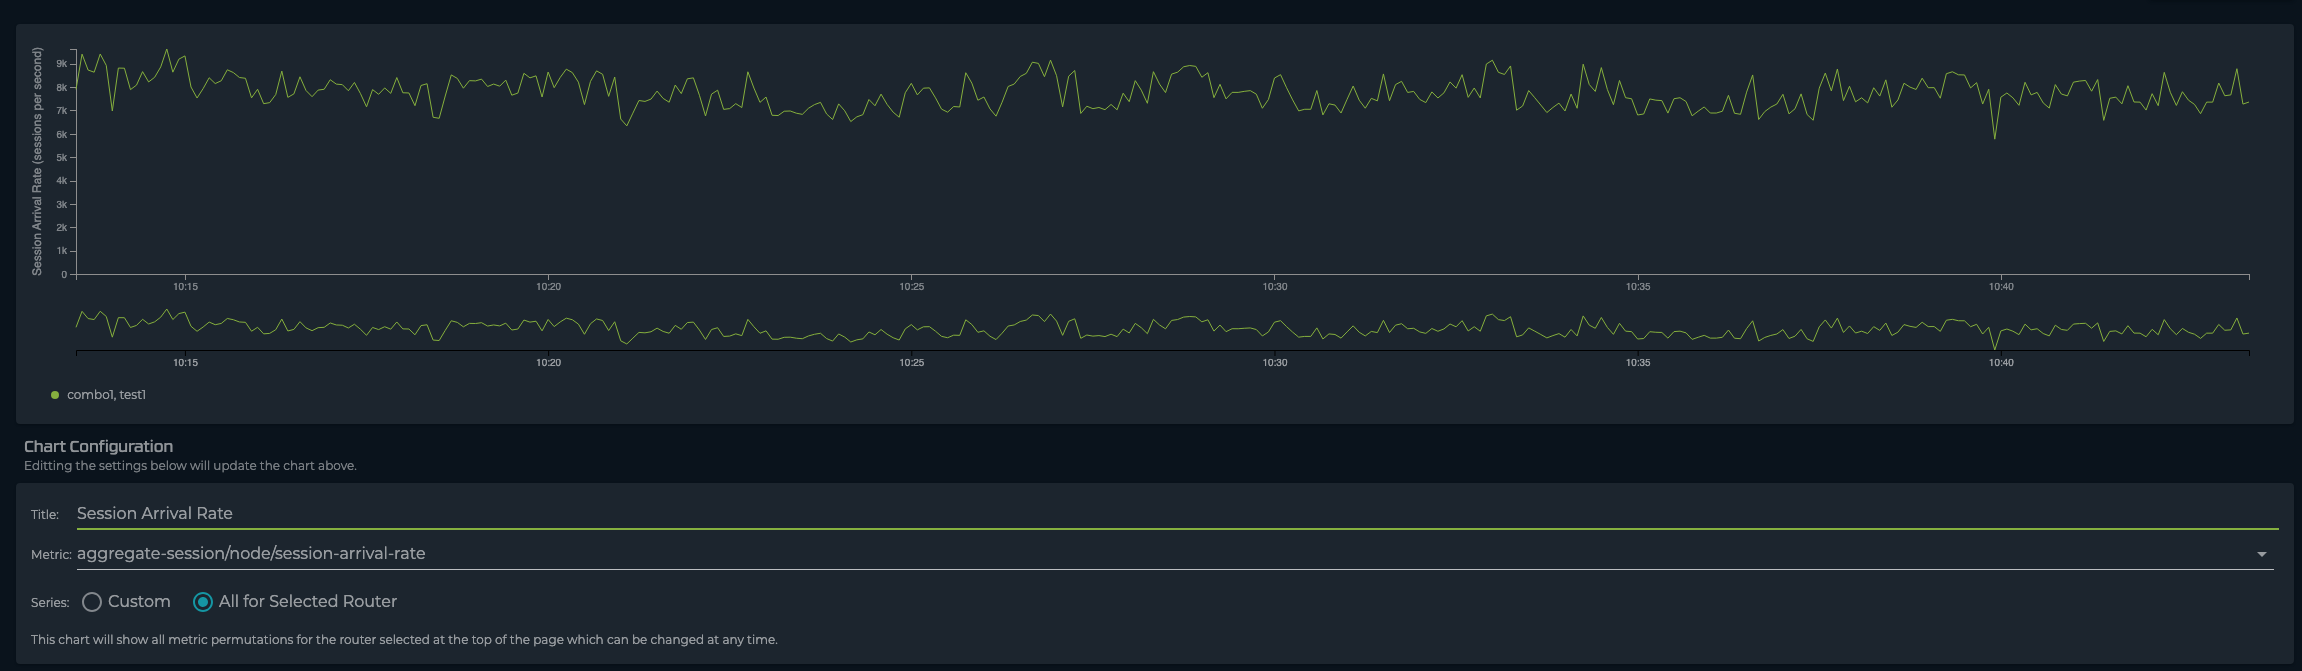 Metric:
 aggregate-session/node/session-arrival-rate
Series: All for Selected Router
When the session processing queue overflows or packets exceed their maximum time waiting in the queue, they are dropped so that clients can re-transmit the packet. Timeouts on their own do not indicate an overloaded SSR as bursts always happen in a network during network churn. However, if this value is steadily increasing it can mean that the SSR is unable to keep up with session processing load.
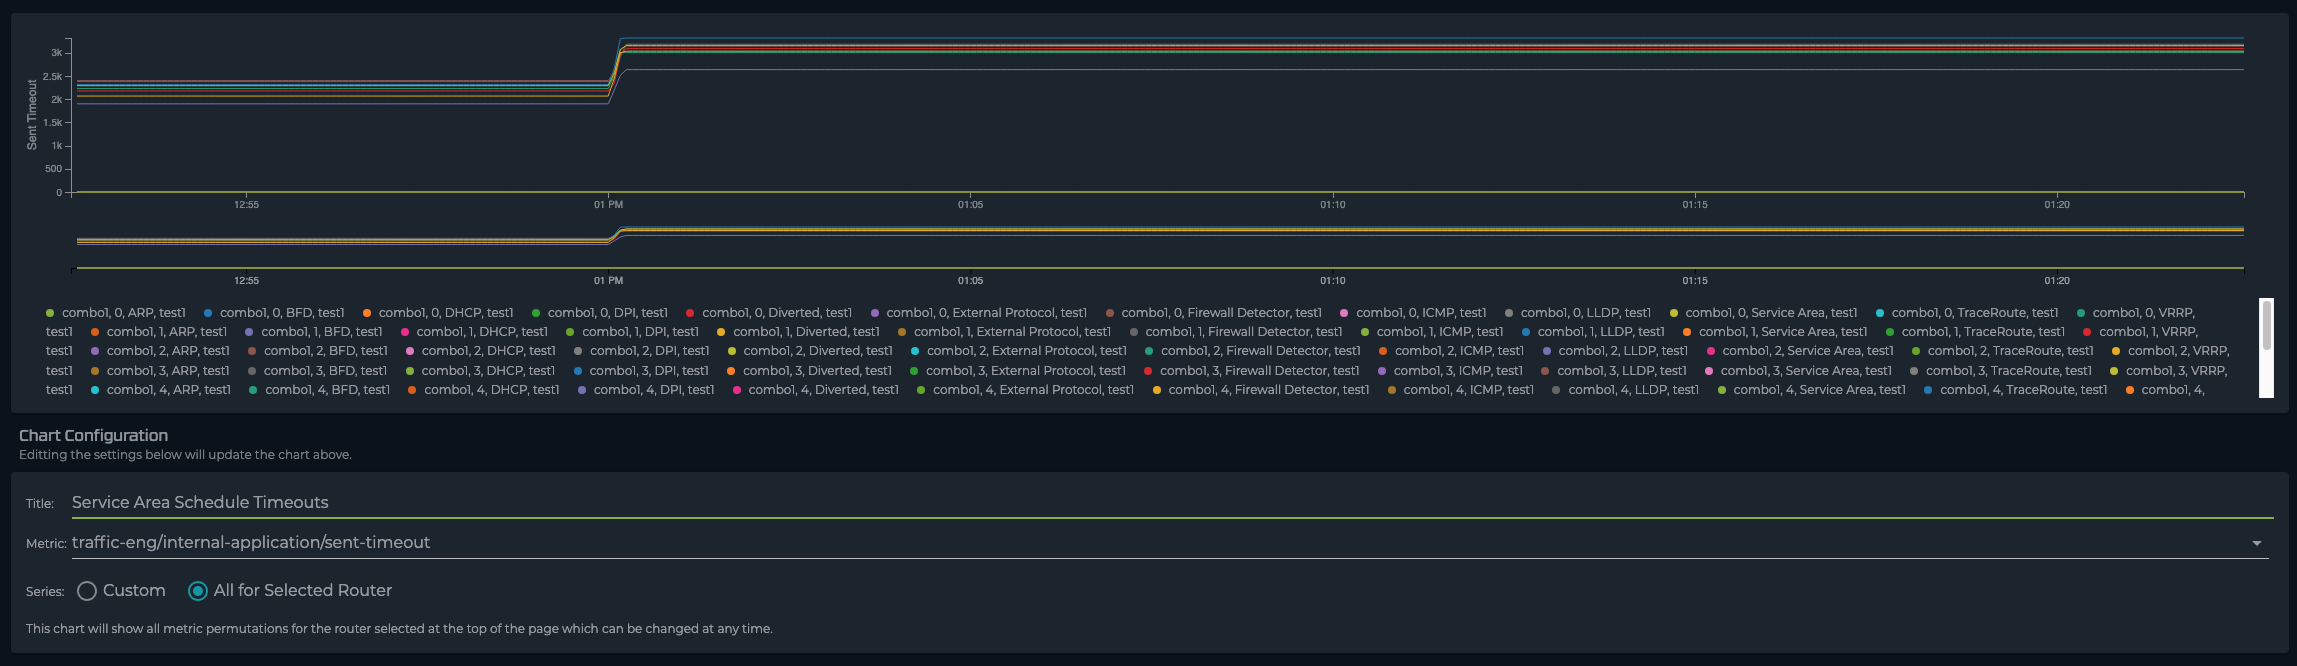 Metric:
 traffic-eng/internal-application/sent-timeout
Series: All for Selected Router