Alarms and Events
What are Alarms and Events?
An event is an occurrence that happens at a specific point of time. These indicate that a significant system event has occurred but is not an ongoing persistent event.
An alarm is an indication that the system is in a state that may require user intervention to resolve.
An alarm is stateful, an event is a one-off occurrence. For example, an alarm is usually associated with two events, an "ADD" when it is created and a "CLEAR" when it goes away.
How Do I Find Alarms?
You can find alarms in the PCLI by typing:
admin@conductor1.nycsite1# show alarms
Tue 2018-09-11 14:44:15 UTC

=============================== ===================== ========== ============================================== =========== ====================================================
 ID                              Time                  Severity   Source                                         Category    Message
=============================== ===================== ========== ============================================== =========== ====================================================
 datacenter1.bostonsite1:60      2018-09-11 14:42:46   info       unavailable                                    interface   Intf 10 (1) administratively down
 datacenter1.bostonsite1:61      2018-09-11 14:42:46   major      If - 1 | Destination - 10.0.128.0 | Vlan - 0   peer        Peer seattlesite1 path is down (PeerName:
                                                                                                                             seattlesite1 | Destination: 10.0.128.0 | NodeName:
                                                                                                                             datacenter1 | DeviceInterface: 1 | Vlan: 0)
 branchoffice1.seattlesite1:36   2018-09-11 14:42:41   major      If - 1 | Destination - 10.0.128.1 | Vlan - 0   peer        Peer bostonsite1 path is down (PeerName:
                                                                                                                             bostonsite1 | Destination: 10.0.128.1 | NodeName:
                                                                                                                             branchoffice1 | DeviceInterface: 1 | Vlan: 0)

There are 0 shelved alarms
Completed in 0.62 seconds
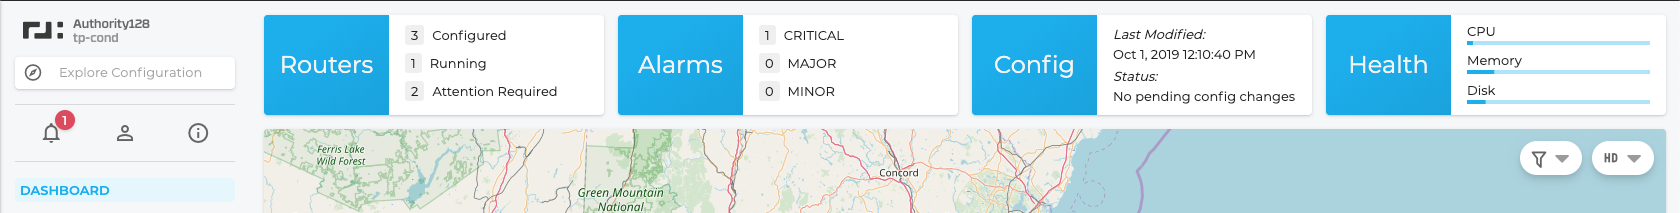
The web client will have a badge icon on the bell on the left panel that indicates the total number of alarms. Additionally, the header on the Dashboard will enumerate the total alarms into one of three categories: critical, major and minor. Both the bell and the critical, major and minor are links to the alarm page which filters alarms respectively.
How Do I Find Events?
You can find events in the PCLI by typing:
admin@conductor1.nycsite1# show events alarm
Tue 2018-09-11 14:46:14 UTC

============== =============== ============ ====================== ========== ========================================== =================== ================== ================
 Router         Node            Event Type   Time                   Severity   Source                                     Category            Message            Shelved Status
============== =============== ============ ====================== ========== ========================================== =================== ================== ================
 seattlesite1   branchoffice1   add          2018-09-10T23:49:47Z   major      bostonsite1+3.3.3.128+branchoffice1+3+0    peer                Peer bostonsite1   not-shelved
                                                                                                                                              path is down
                                                                                                                                              (PeerName:
                                                                                                                                              bostonsite1 |
                                                                                                                                              Destination:
                                                                                                                                              3.3.3.128 |
                                                                                                                                              NodeName:
                                                                                                                                              branchoffice1 |
                                                                                                                                              DeviceInterface:
                                                                                                                                              3 | Vlan: 0)
 bostonsite1    datacenter1     add          2018-09-10T23:49:53Z   major      seattlesite1+1.1.1.128+datacenter1+4+0     peer                Peer               not-shelved
                                                                                                                                              seattlesite1
                                                                                                                                              path is down
                                                                                                                                              (PeerName:
                                                                                                                                              seattlesite1 |
                                                                                                                                              Destination:
                                                                                                                                              1.1.1.128 |
                                                                                                                                              NodeName:
                                                                                                                                              datacenter1 |
                                                                                                                                              DeviceInterface:
                                                                                                                                              4 | Vlan: 0)
 seattlesite1   branchoffice1   clear        2018-09-10T23:49:54Z   major      bostonsite1+3.3.3.128+branchoffice1+3+0    peer                Peer bostonsite1   not-shelved
                                                                                                                                              path is down
                                                                                                                                              (PeerName:
                                                                                                                                              bostonsite1 |
                                                                                                                                              Destination:
                                                                                                                                              3.3.3.128 |
                                                                                                                                              NodeName:
                                                                                                                                              branchoffice1 |
                                                                                                                                              DeviceInterface:
                                                                                                                                              3 | Vlan: 0)
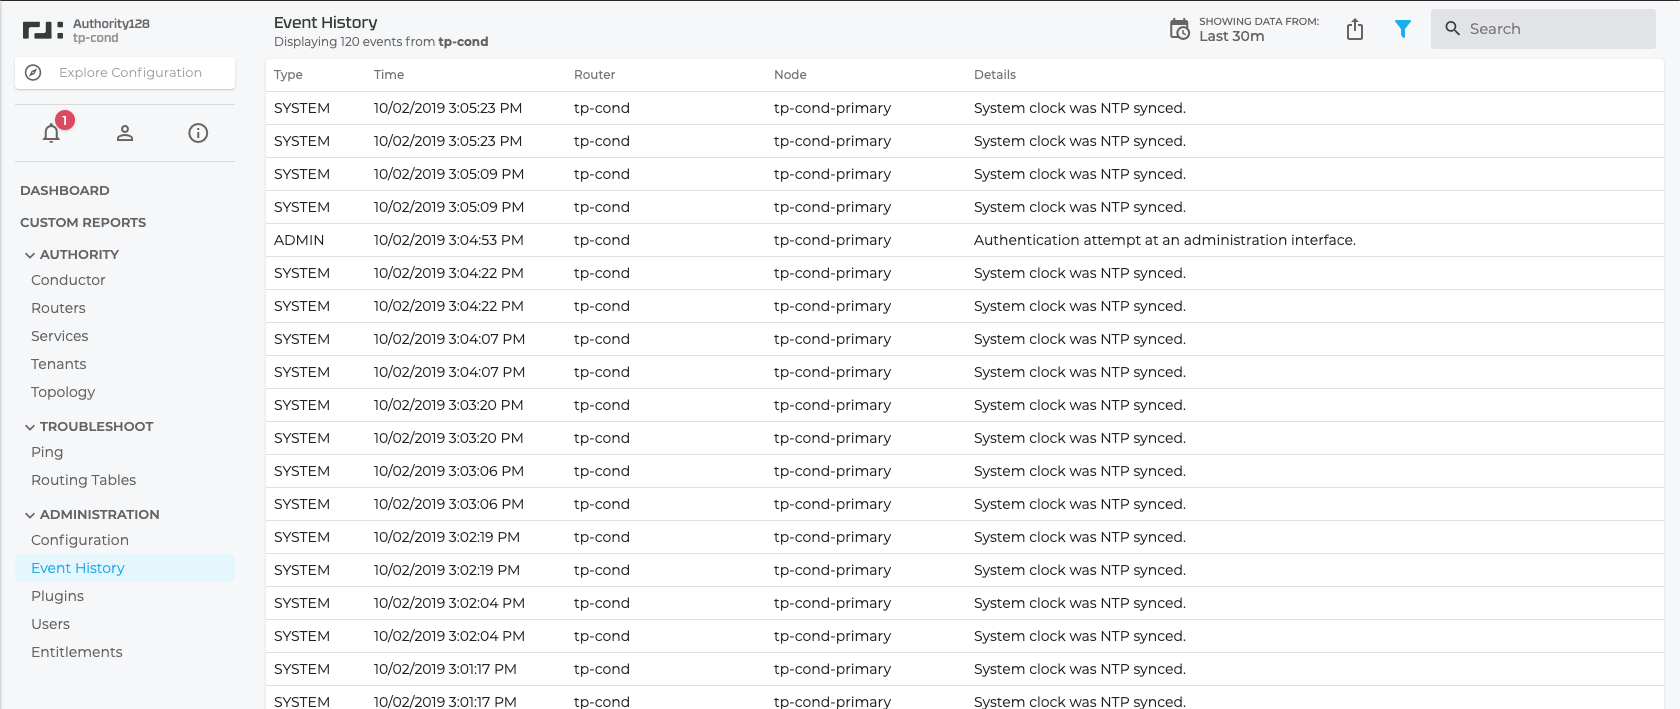
Within the web client, the Event History link will bring you to a page where all events can be displayed, or by applying varying level of filters, restrict the messages to only a particular router or event type.
In large deployments, there may be a large number of events on a conductor. It may be difficult to wade through the pages of events if you know you are looking for a particular event within a window of time. The show events command supports filtering events by time when specifying starting and ending time ranges. The syntax for time follows the same format of the event timestamps.
show events alarm from 2020-03-30T22:00:00Z to 2020-03-30T23:59:59Z router burlma-corp
Note the trailing Z. Most systems are configured to be in UTC time. If the trailing Z was absent, the time filter would be restricted to the local time zone
show events alarm from 2020-03-30T22:00:00Z to 2020-03-30T23:59:59Z router AAPDENCOPOD4
Contents of Alarms and Events
| Field | Description |
|---|---|
| dateTime | This is the date and time that the event occurred. The format of the value follows the ISO 8601 standard. |
| node | The system within the SSR which produced the event. |
| process | The process within the node which produced the event. |
| source | The name of the entity which was the originator of the alarm. When the topic is a network-interface, this would be the name of the network-interface. |
| category | This is the alarm type. Each category has a specific message format: • system Related to the system, e.g. CPU, memory, etc. • process Related to an internal software process • interface/network-interface Related to an interface on the SSR (up, down,etc.) • platform Related to low-level events that aren't necessarily derived from the machine; e.g. security keys • peer Related to connectivity between SSR routers • platform-state Sourced from the stats infrastructure • redundancy Related to high availability behavior; e.g. a failover or leadership change • giid Related to an interface that is part of a redundant pair (giid is an interface's "global ID") • asset An alarm sourced by an asset (a managed node) that is derived from Automated Provisioner |
| severity | Alarms can be categorized in one of four severities: critical, major, minor and info. These severity levels can be used to filter alerts based on one of these levels. The default severity level is info, which shows all alarms. • critical The condition affects service • major Immediate action is required • minor Minor warning conditions • info No action is required |
| message | Descriptive text regarding the nature of the alarm |
Shelving Alarms
When an SSR is put into Maintenance Mode all alarms for that SSR are “shelved”. Shelved alarms continue to be monitored by the system, but are not presented on the standard UI. The state of shelved alarms can be viewed by issuing the following command:
admin@conductor1.nycsite1# show alarms shelved
For information on how to shelve individual alarms, see Alarm Suppression.