Using Application Summary
The Application Summary is available for routers where both Application Identification and Summary Tracking are enabled. summary-tracking is enabled by default, and application-identification must be set to mode all.
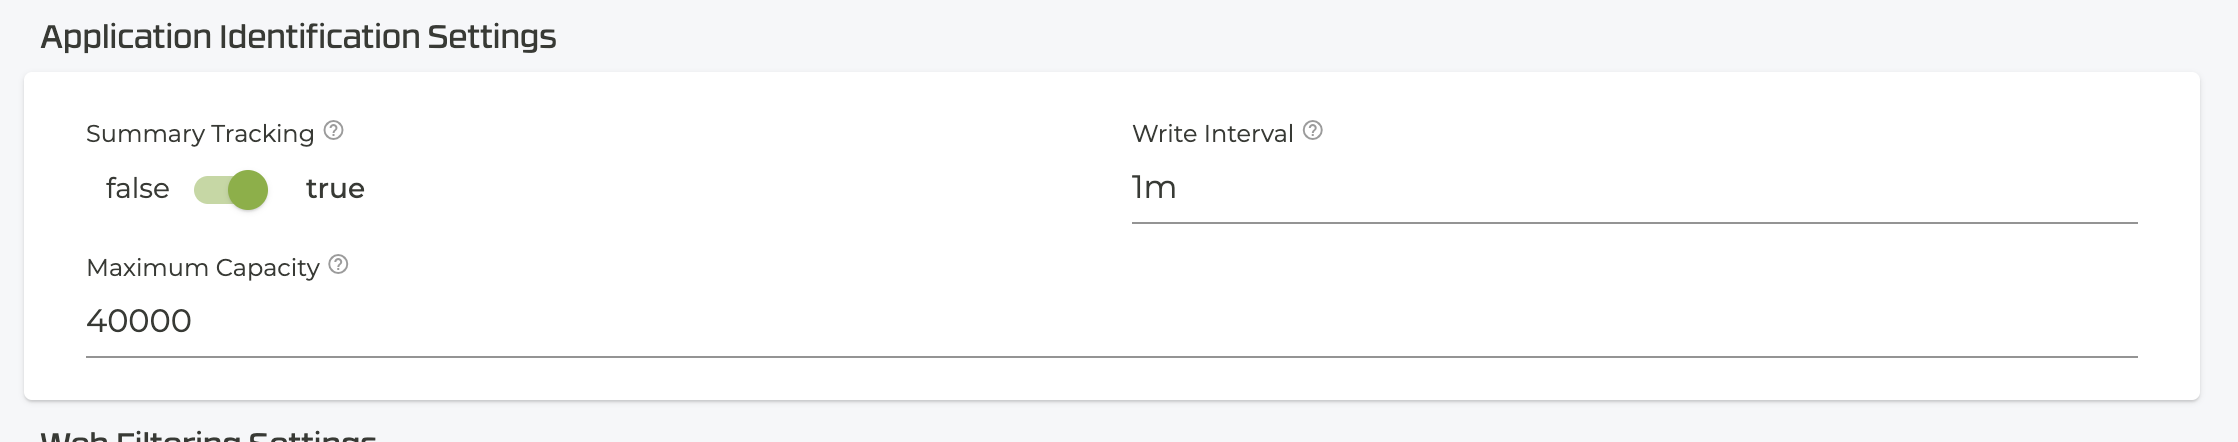
The following Application Summary settings are configured in the Application Identification panel.
- Summary Tracking: Enable session stats tracking by application.
- Write Interval: Interval to define how often analytics are calculated.
- Max Capacity: The maximum capacity for resolved next-hops under a client.
Application Summary Table
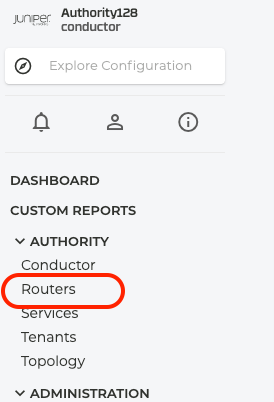
Access the Application Summary table from the Router page. Under Authority on the left side of the GUI, select Routers.
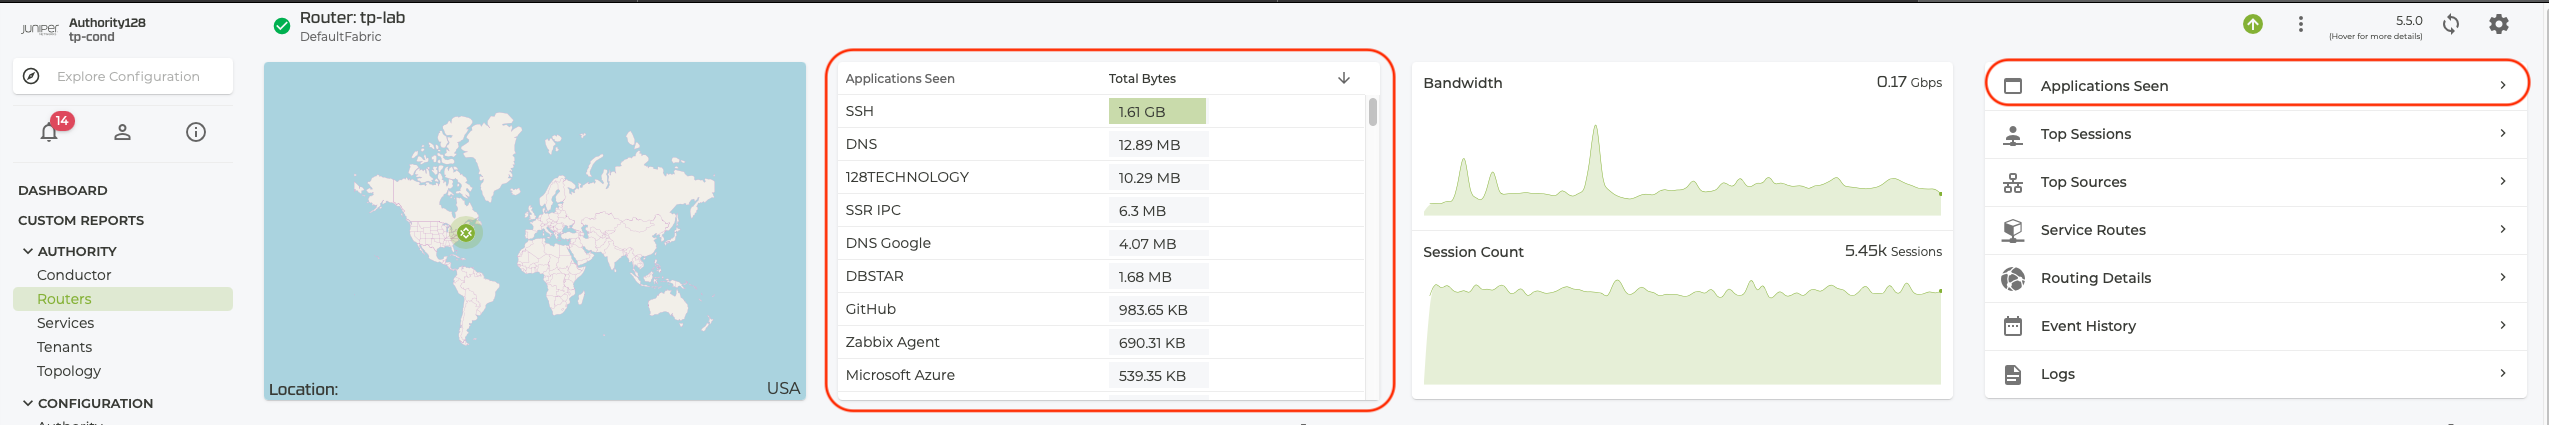
To display the Application Summary, click on an application in the Applications Seen table, or the Applications Seen selection on the right side of the top panel.
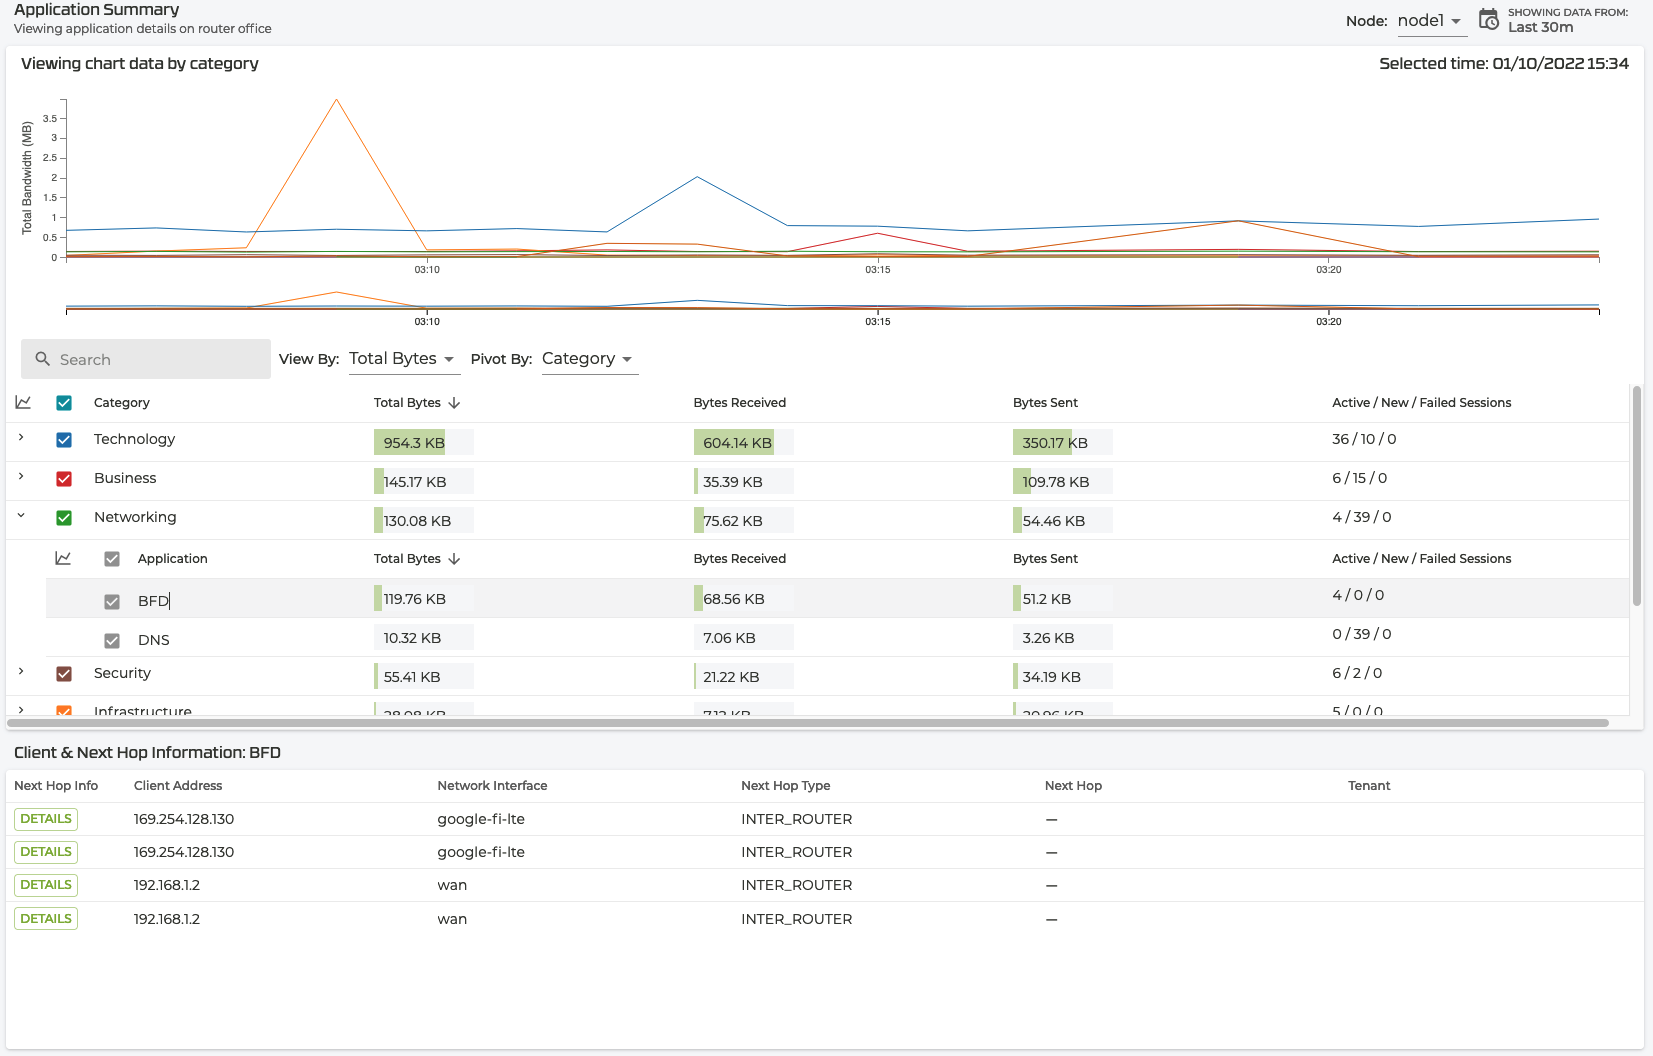
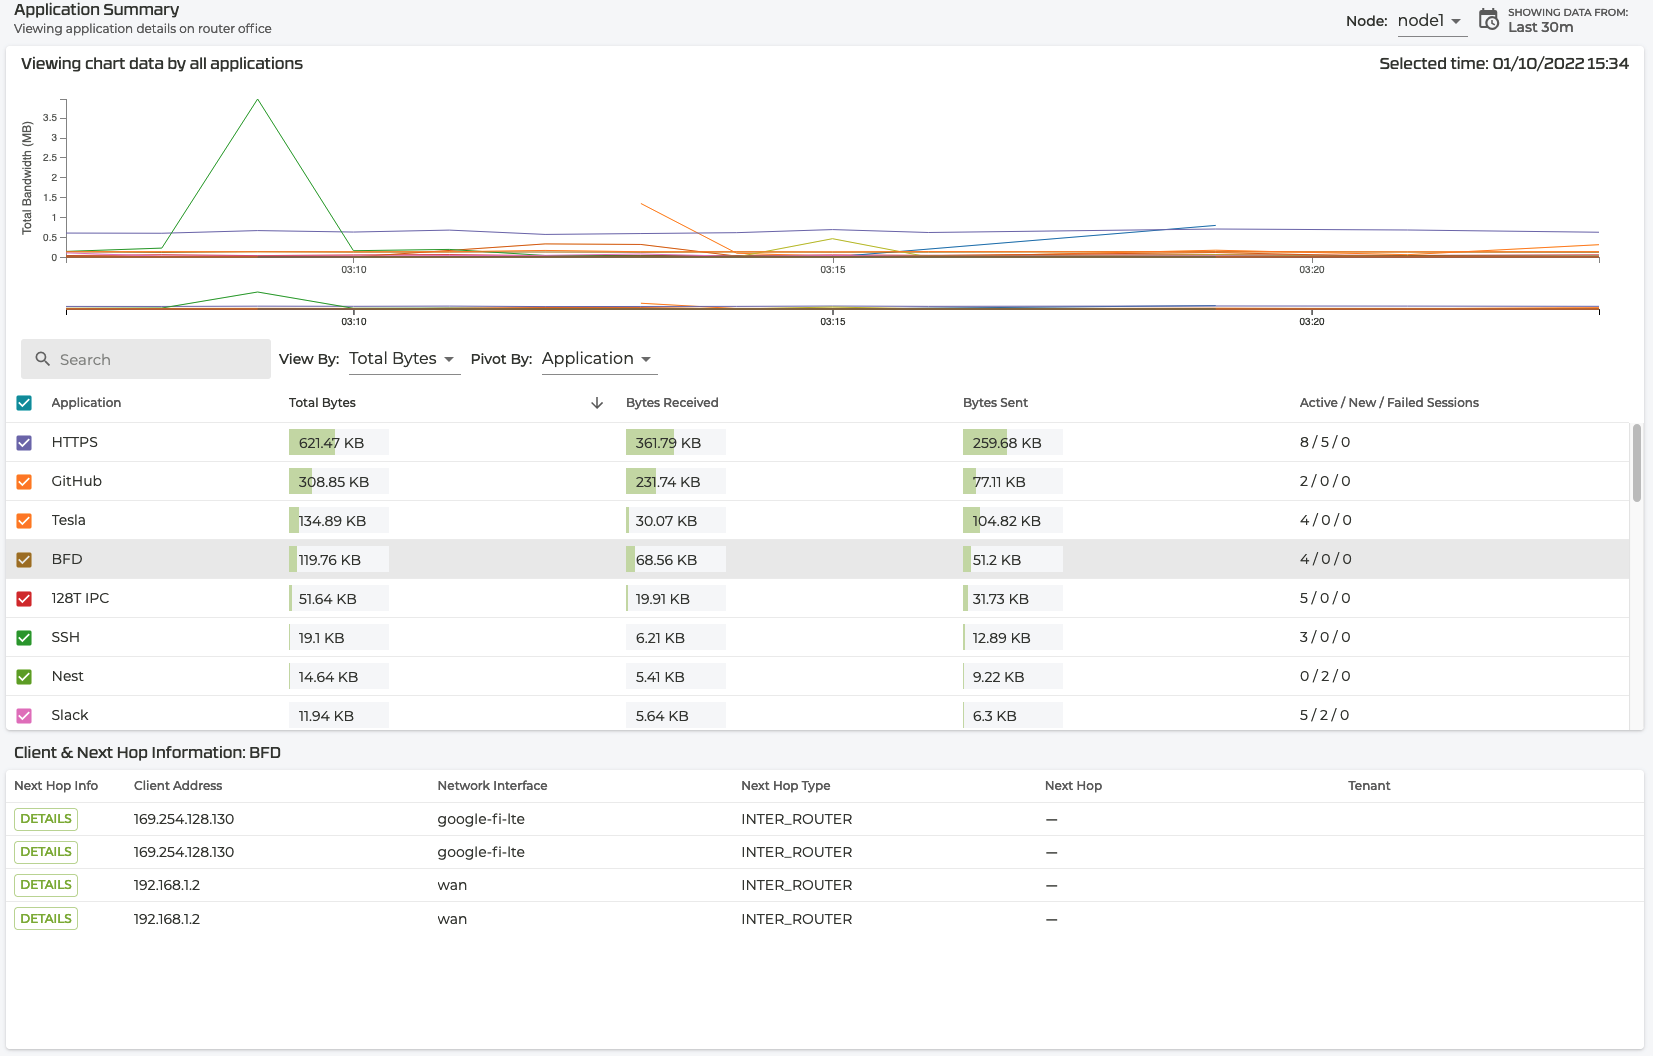
Pivot by Category
By default the table shows all Applications, grouped by Category. To view Applications or Clients, use the Pivot By dropdown. The table controls include Search, View By, and Pivot By. Search is typically used to locate specific applications or clients when the list is extensive. Application Summary information is displayed below the router chart when a point in the graph is selected. The selected time is shown at the top right of the chart.
- View By options include: Bytes Recieved, Bytes Sent, Total Bytes.
- Pivot By: Application, Category, Clients.
Pivot by Application
Pivot by Client
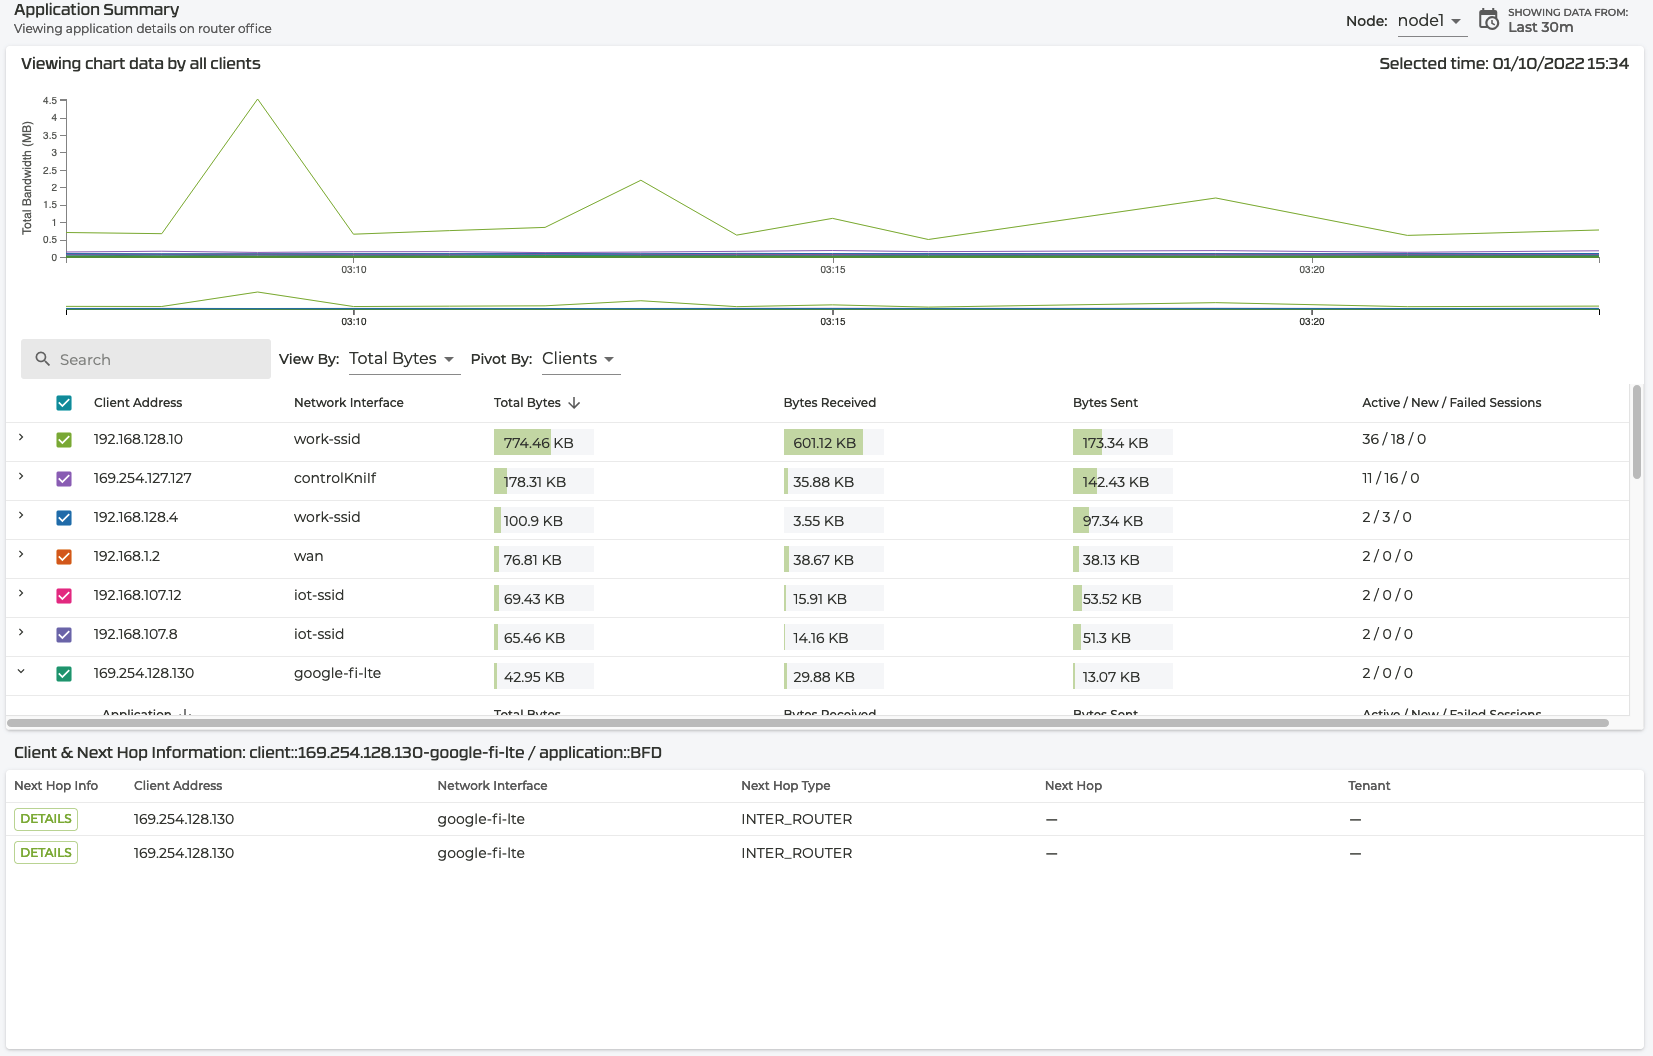
Clicking on the down arrow on the left side of the table expands collapsed rows, showing associated child data when available. Click on the appropriate color-coded checkbox to hide the series in the chart. You can also change the data being viewed by clicking the chart icon in the top left of the table. This switches the chart to view all parent data in a given Pivot, or only relevant child data related to the parent (for example, all Applications related to a Category).
Application Summary data is viewed on a node-by-node basis; data is displayed one node at a time. Use the Node dropdown on the top right of the page to change the node being viewed.
Clicking a row in the table populates the Client & Next Hop Information table. This table shows Next Hop information related to a client directly under the selected row. To view all details about a client, click on the Details button in the first column of the table.
Similar to the Custom Reports functionality, a time selector in the top right of the page allows you to select a time range (default is 30 minute lookback). To minimize load time and strain on the system, the max lookback is limited to 24 hours.