Help us improve your experience.
Let us know what you think.
Do you have time for a two-minute survey?
Help us improve your experience.
Let us know what you think.
Do you have time for a two-minute survey?
Juniper Mist Government Cloud (GovCloud) operates within the AWS GovCloud (US) Regions. These regions are designed to host sensitive data and regulated workloads, ensuring compliance with stringent U.S. government security and compliance requirements. By leveraging AWS Government Cloud (US), Juniper Mist provides a secure and compliant environment tailored for U.S. government agencies, contractors, educational institutions, and other organizations handling sensitive workloads in the cloud. Currently, this environment is “Authorized” on FedRAMP and GovRAMP (previously known as StateRAMP) marketplace for Impact level “Moderate”.
This page lists the Juniper Mist updates released on US GovCloud in May 2026.
We are excited to announce the launch of a redesigned and enhanced version of the Juniper Mist site Insights page. This update provides comprehensive visibility into insights across Wireless, Wired, and WAN networks for each site.
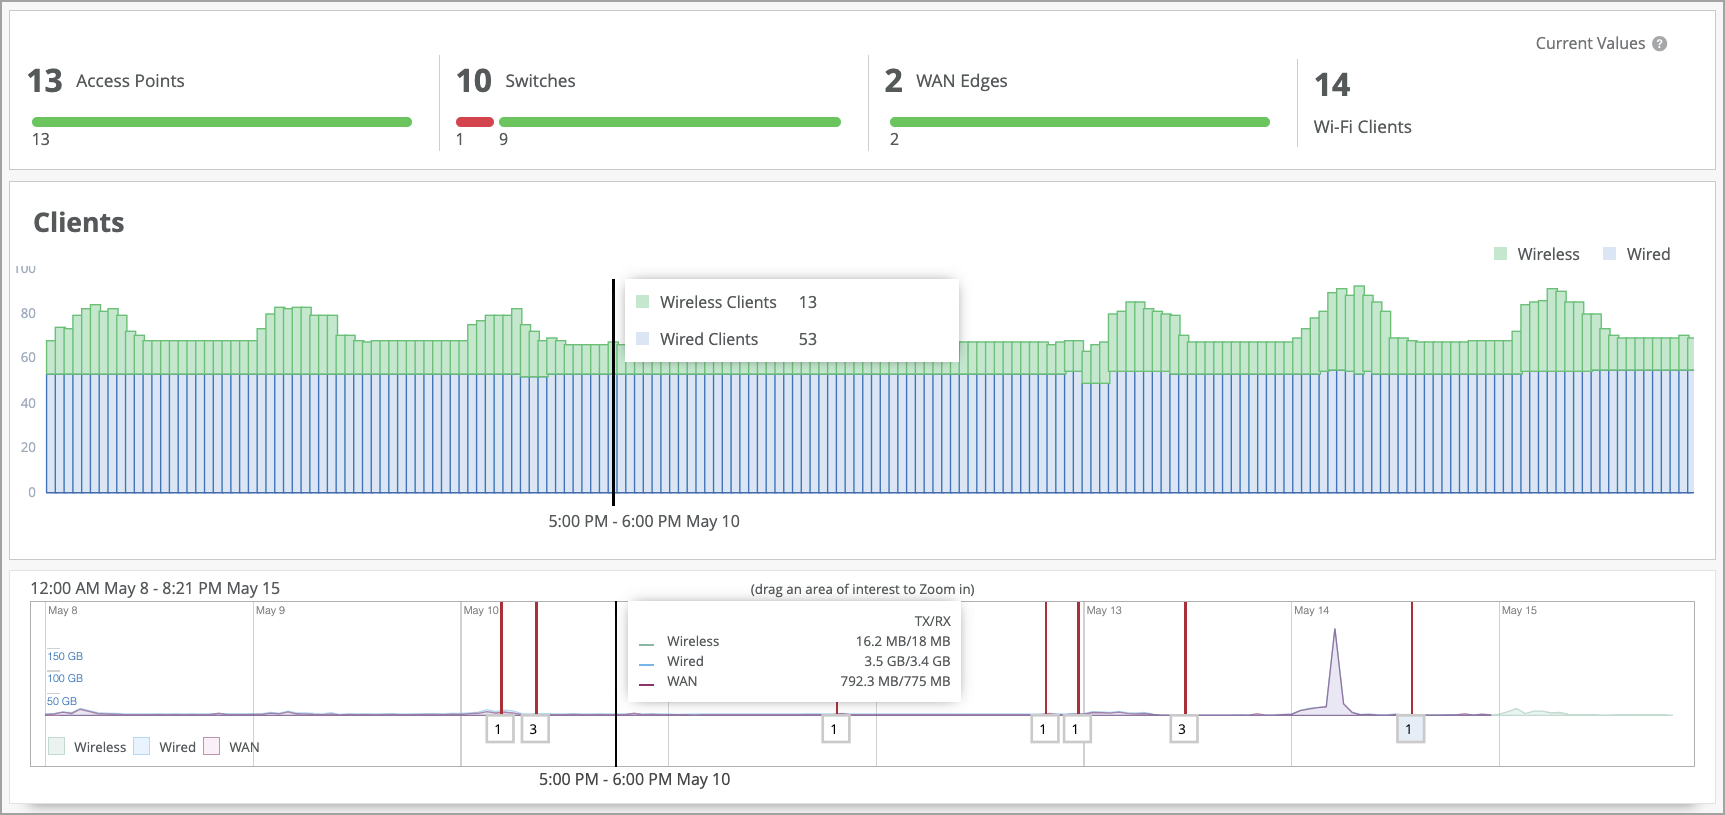
The enhancement includes new views for device connection status, client connection trends over time, network traffic, and critical alerts, in addition to all the existing information.
The redesigned page also includes tabbed views for each network swimlane deployed at the site, offering key insights.
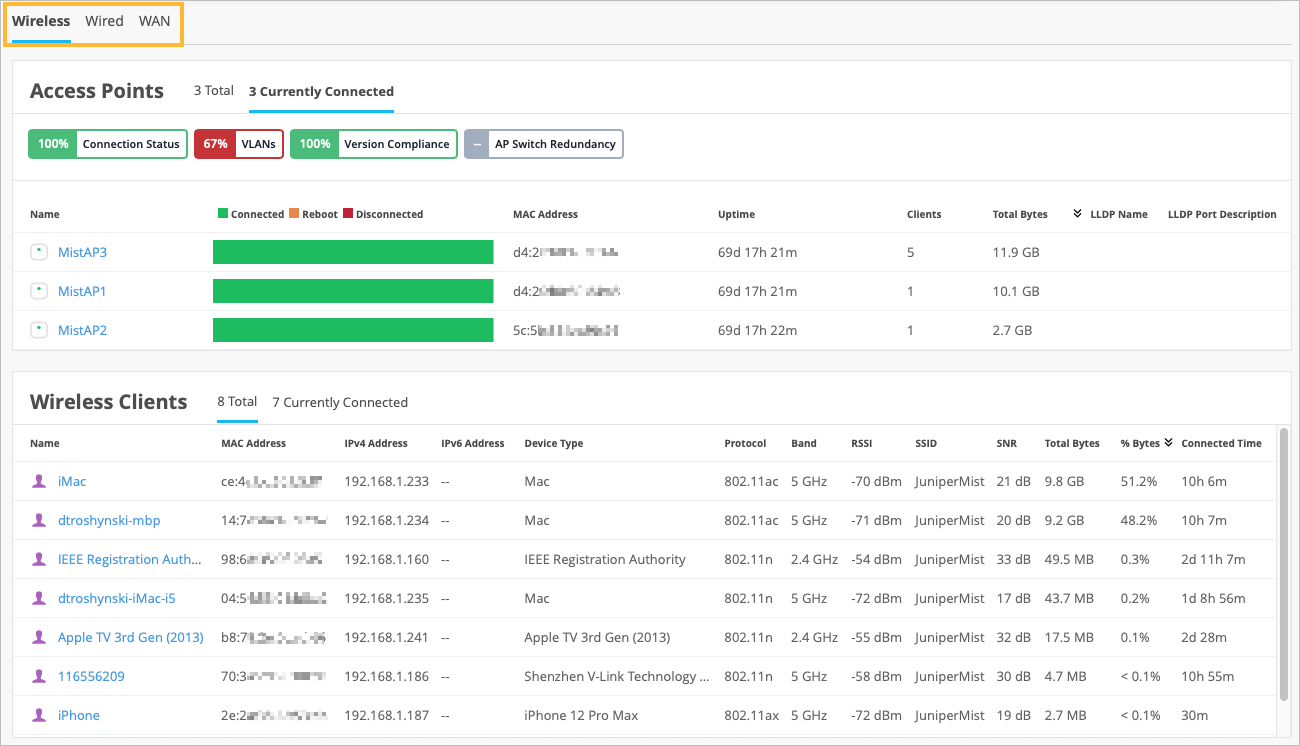
Other key features of the enhanced site Insights page include the following:
A summary view that shows the connection status of devices such as access points (APs), switches, WAN edges, and Wi-Fi clients.
An enhanced Events section which provides a tabbed view of events for different device types at the site level.
An updated applications view which shows the name of each application, the number of clients, and the bytes sent and received. Although Mist collects application data across both WAN and Wireless networks, WAN-based insights are given priority. Wireless network-based insights are displayed if WAN-based data is not available.
Juniper Mist now gives you greater control over access point (AP) upgrade processes. You can choose to upgrade APs instantly or schedule upgrades to start at a time that best suits your business needs.
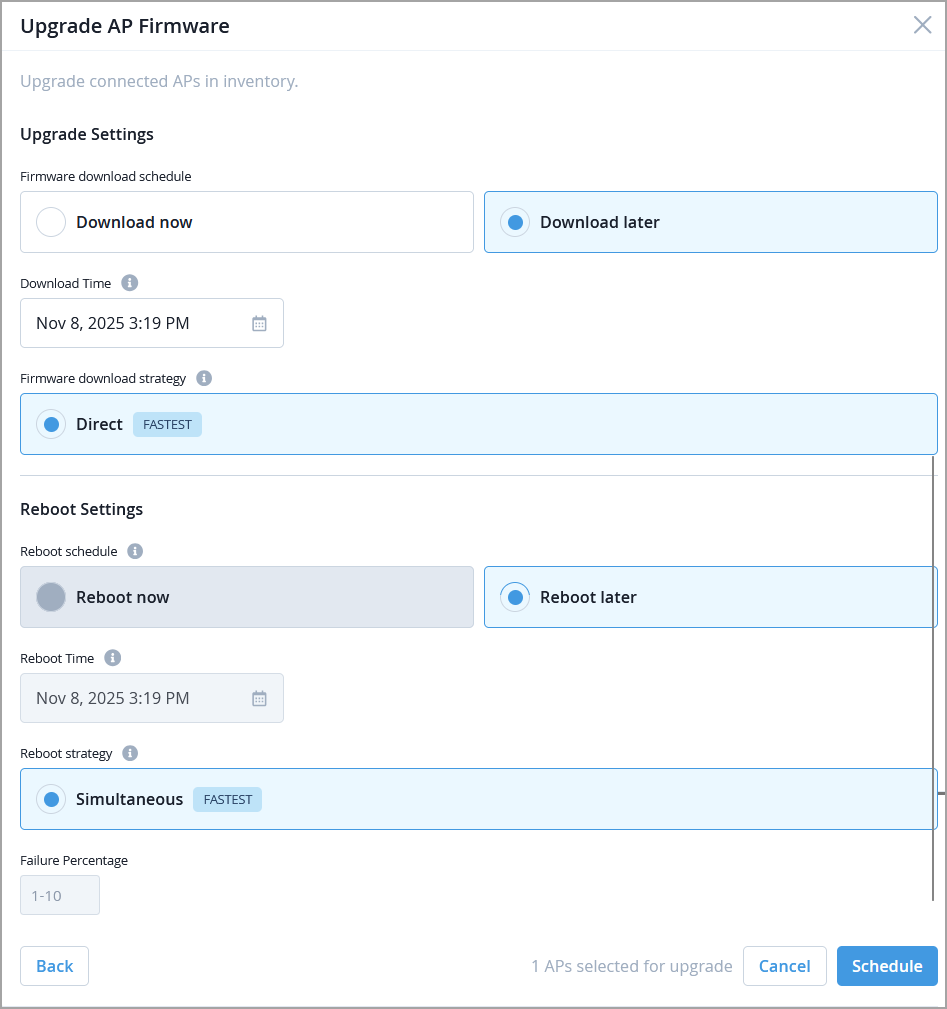
In upgrade settings, you can schedule firmware installation and device reboot separately. For example, configure APs to install firmware and reboot immediately, or schedule both steps for later.
All APs in a scheduled upgrade will download and install firmware simultaneously, and all APs reboot at the same time.
To initiate an upgrade, do the following:
Go to the Access Points page (list of APs).
Select the APs to be upgraded and then click Upgrade APs.
Select the firmware version and then click Next.
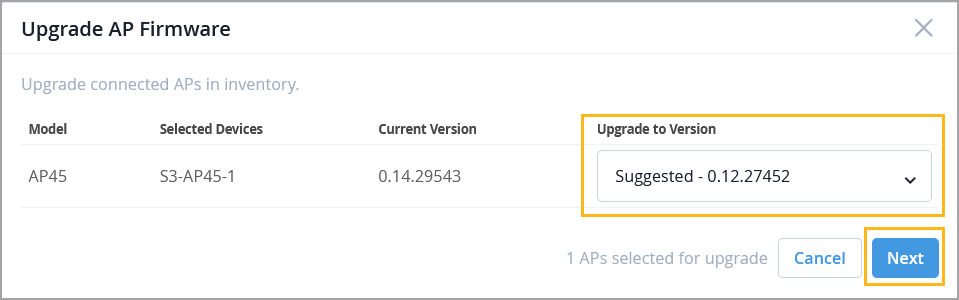
Specify the schedule details and then click Schedule.
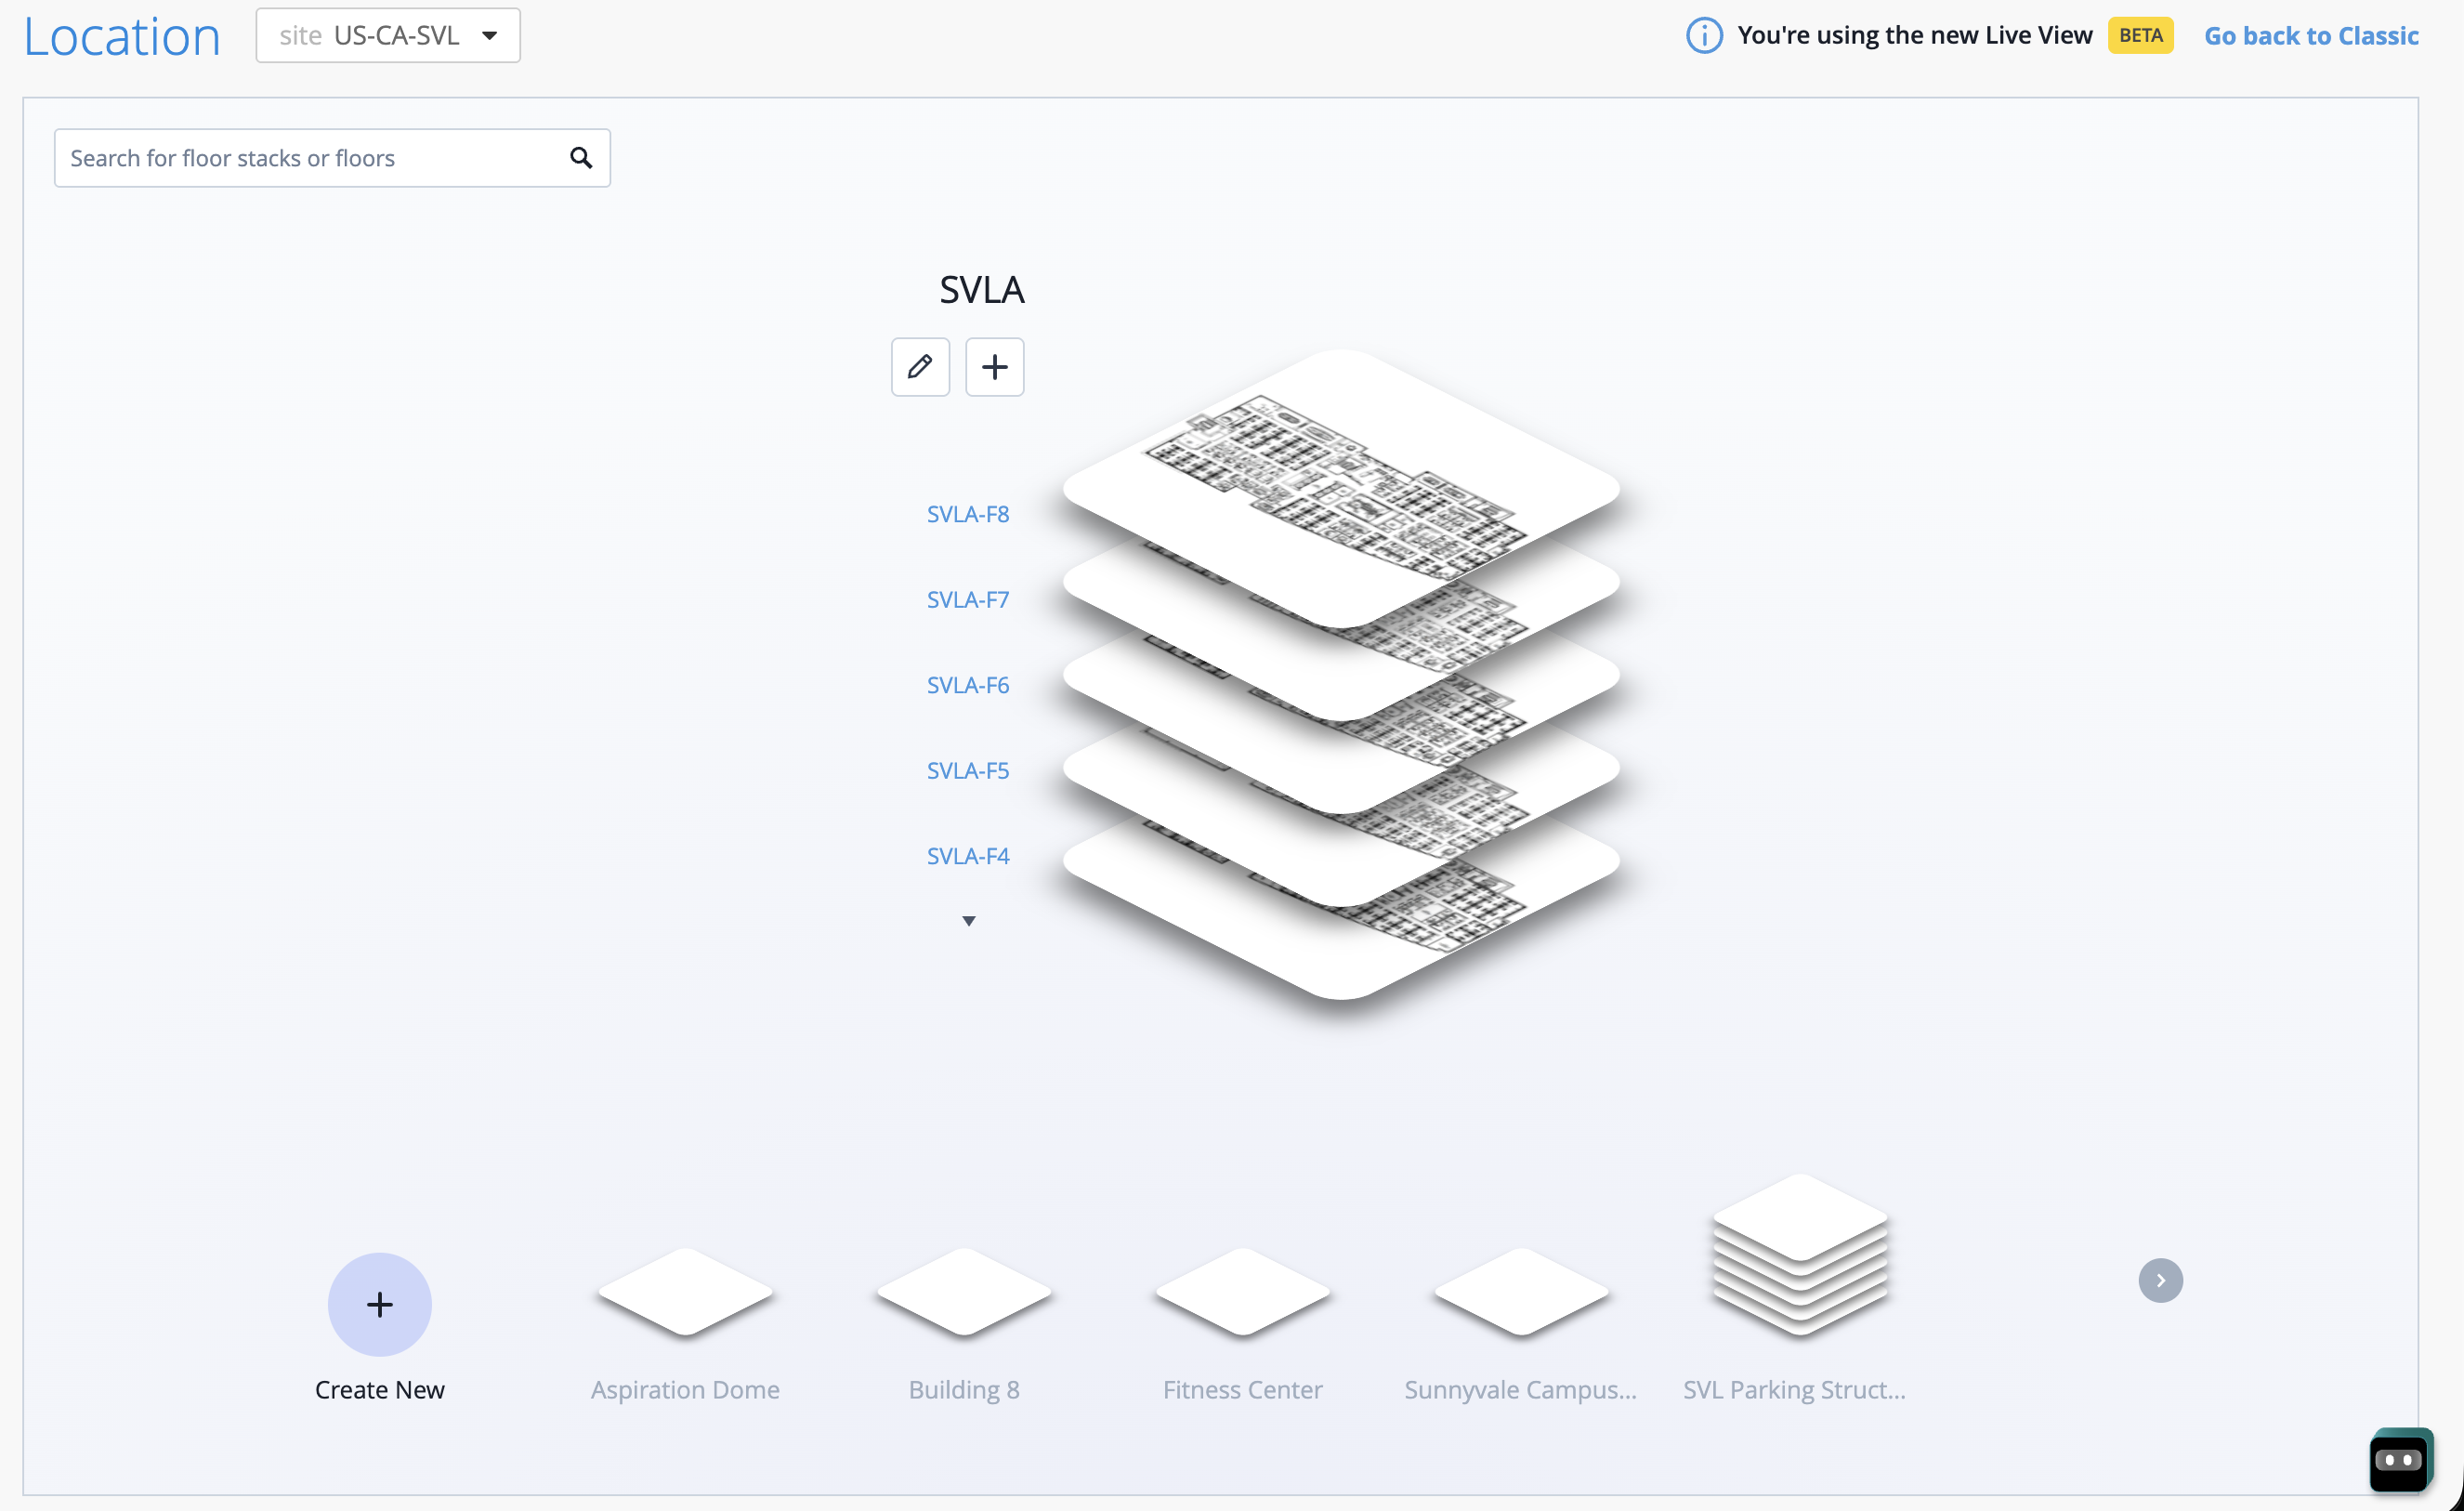
We are excited to unveil the redesigned Location Live View in Beta, built to deliver a modern, visually rich experience and streamlined navigation. The enhanced interface offers a more intuitive design alongside new interactive visalizations that let you explore floorplans in multi‑level floor stacks. To experience the new Live View, navigate to the Live View page (Location > Live View) and then click Try the new experience on the upper right of the page.
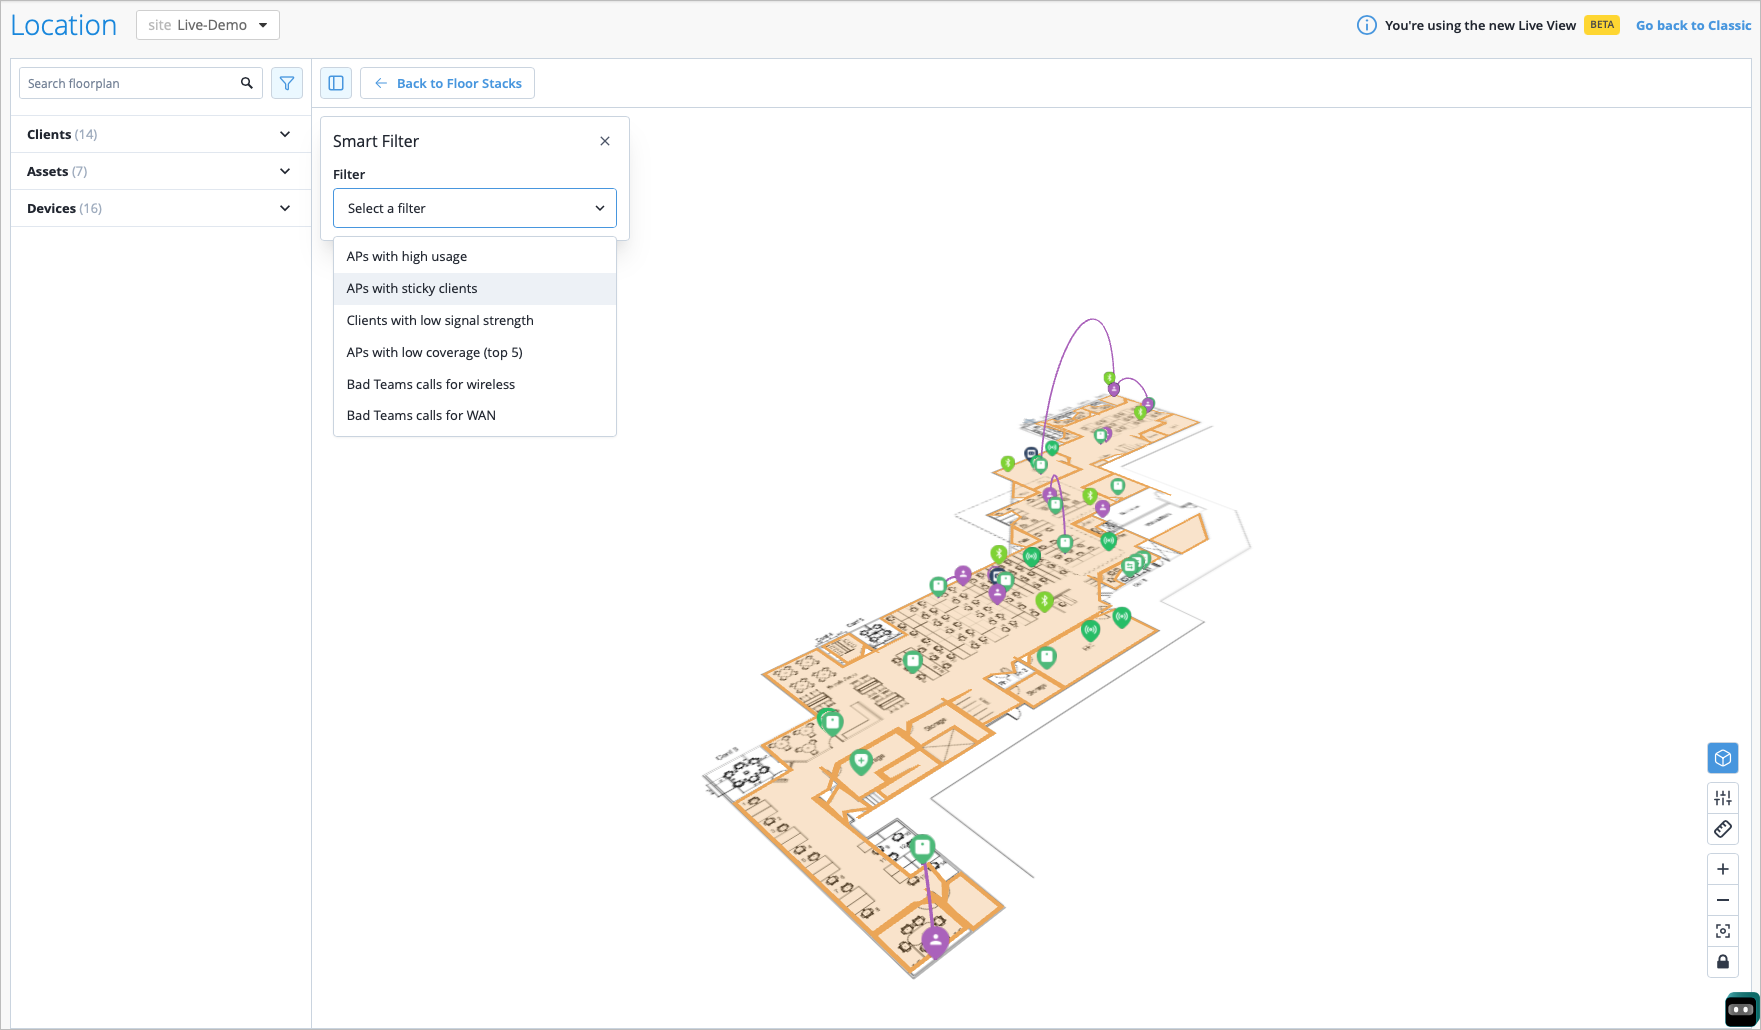
The updated Live View introduces smart filters, including insights into APs with high usage, low coverage, or sticky clients; clients with low signal strength; and poor Teams call quality—making it easier to quickly identify and troubleshoot issues. The following image shows a view filtered for APs with sticky clients.
We are excited to introduce the enhanced Org Insights dashboard. As announced in our September 2025 release note, Network Operation Center (NOC) users can use the Org Insights dashboard to access a single-pane-of-glass that displays any potential issues affecting the network.
You can access this page by navigating to Monitor > Service Levels > Insights, then select Entire Org.
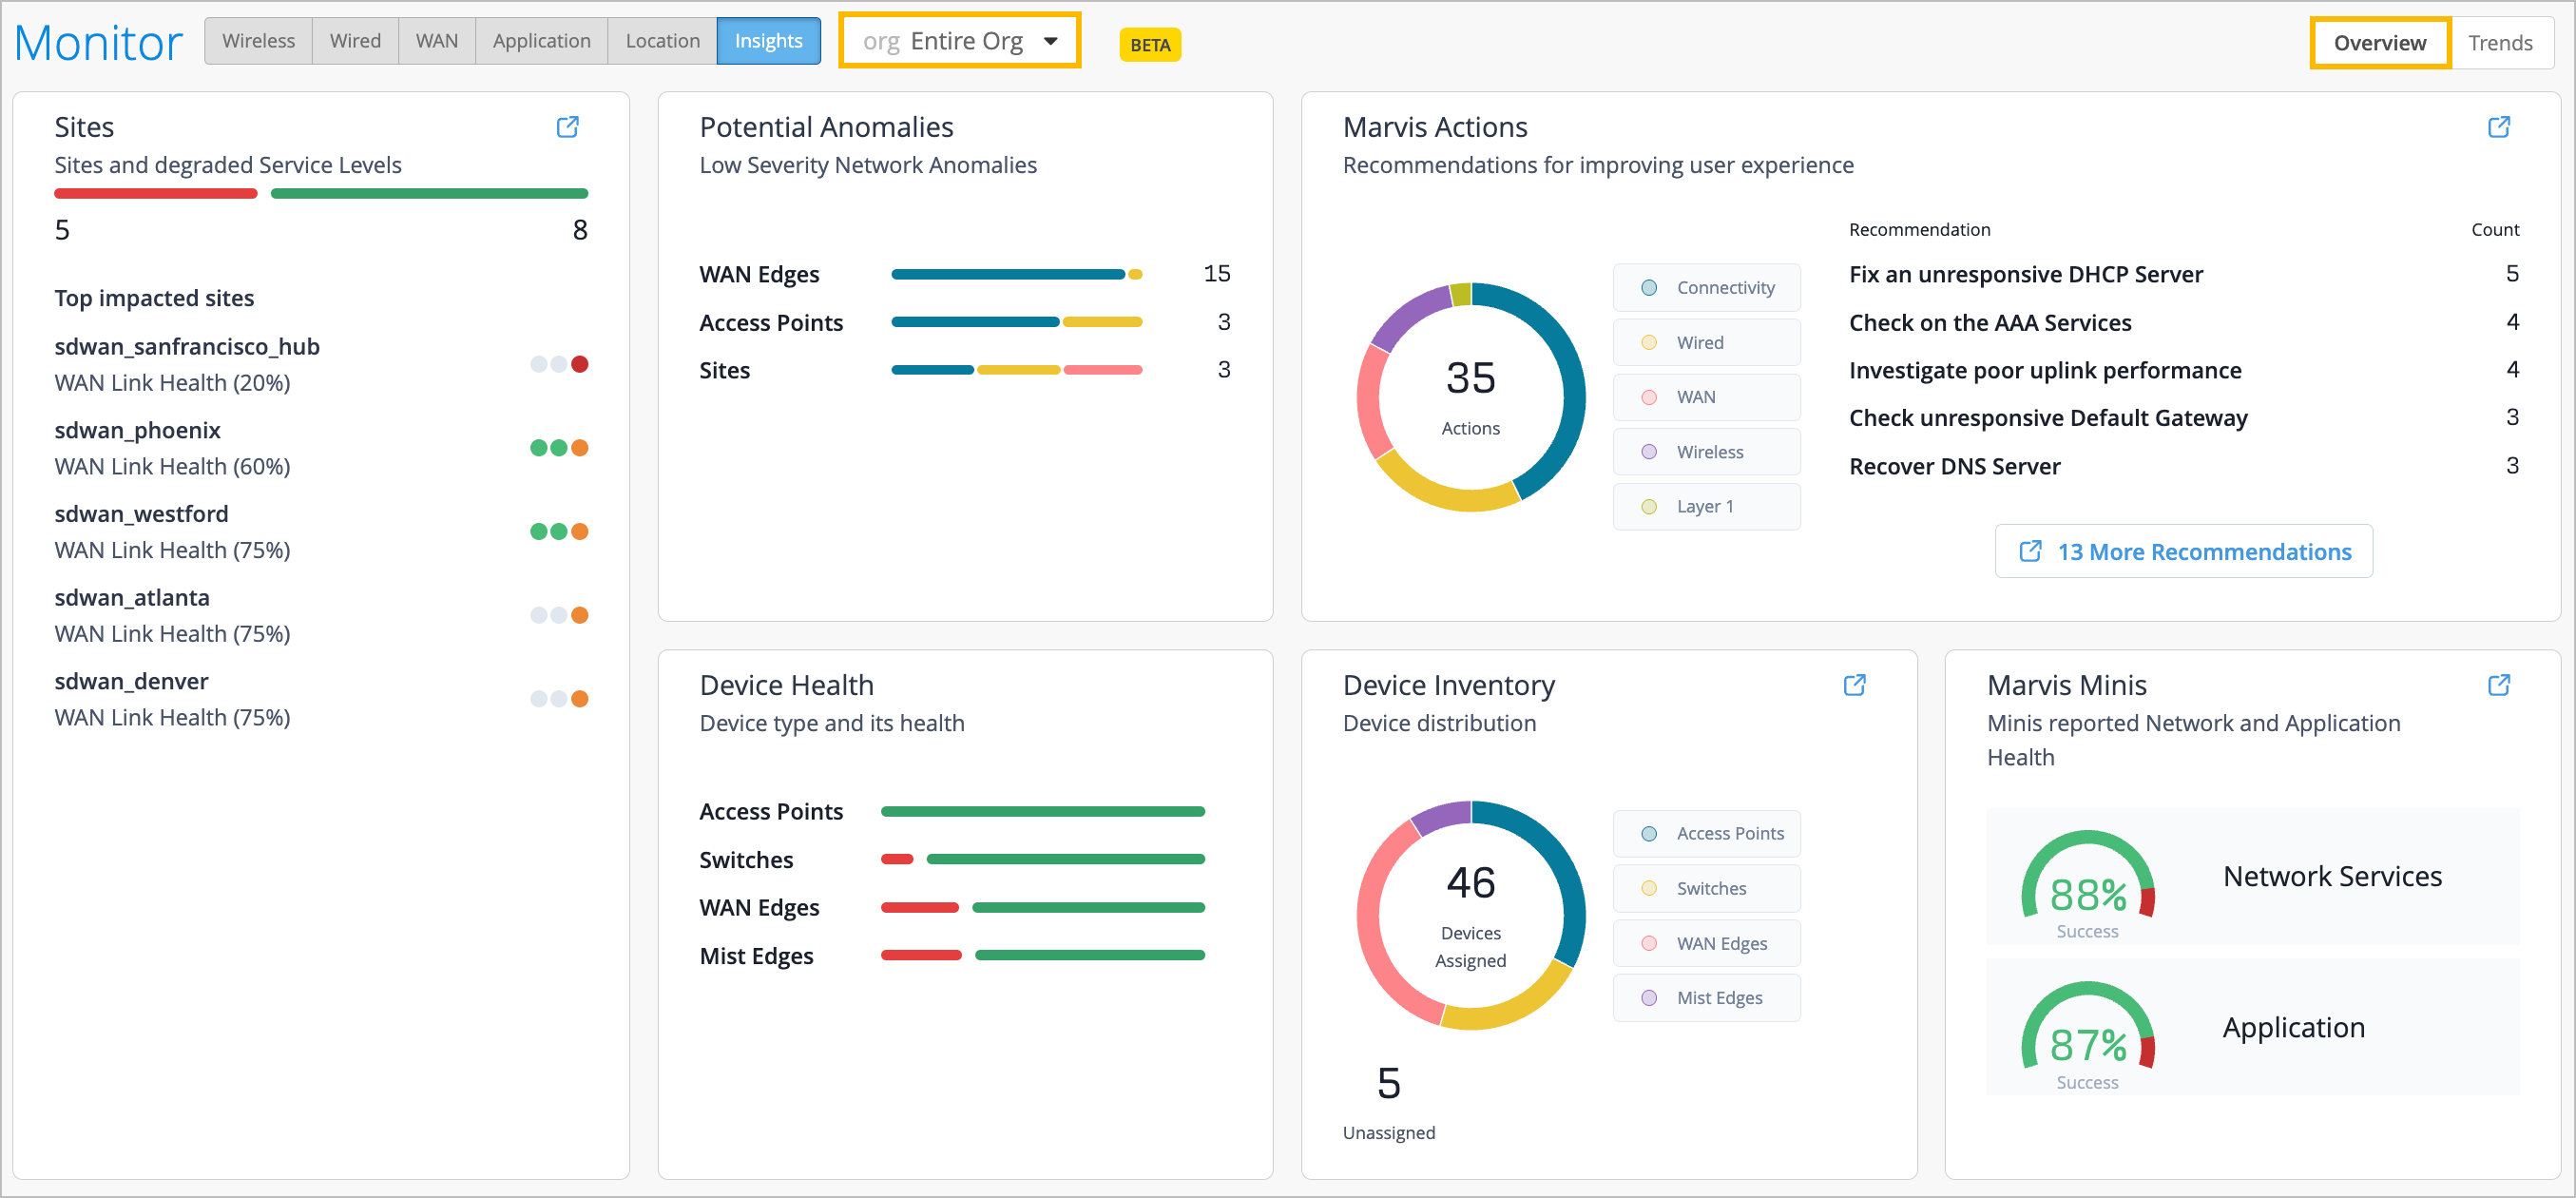
The Organization Insights Overview delivers actionable and relevant information on the health of user experience across all sites and includes the following key information that includes not only the typical device health and inventory views, but focuses on our Service Level Expecation framework to measure user experience, and bubbles up any potential anomalies, Marvis Actions or proactive issues found by Marvis Minis digital twin that are impacting user experience.
Sites—View the top 10 worst sites in relation to degraded WAN, wired, and wireless health Service Level Expectations impacting end user experiences.
Device Health—View the overall health by device type for your organization.
Device Inventory—View device distribution and activities. Quickly glance at the number of devices in your organization that require site assignment.
Potential Anomalies—Gain visibility into the low-severity network anomalies for the organization that indicate potential issues that could impact users, before they transalte to a Marvis Action with high efficacy. Categories that display here include Sites, Servers, ISP, Application, Access Points, Mist Edges, WAN Edges, Switches, Routers, and Clients.
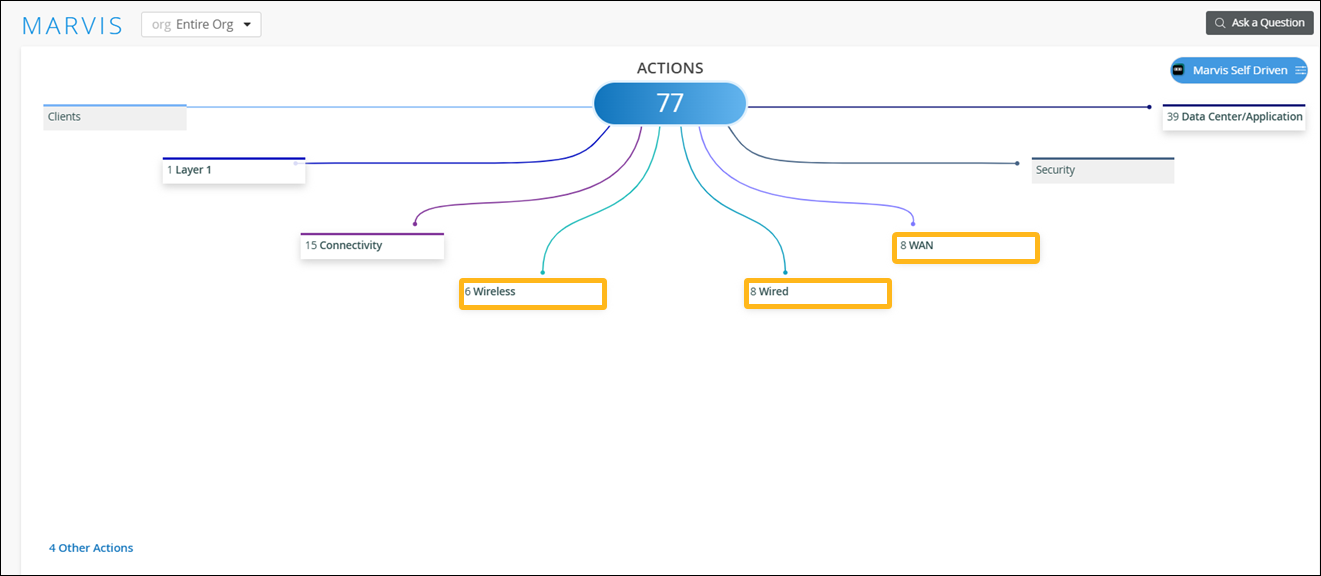
Marvis Actions—See the Marvis Actions recommendations for optimizing network performance and improving user experience. The categories are Layer 1, Wireless, WAN, Wired, and Connectivity.
Marvis Minis—Learn the Marvis Minis reported information regarding network and application health.
You can click on the information within the widgets to gain insight into the issue affecting end users. For example, when you click on a site from the Sites widget, you are brought to the Site Insights page for that site, and when you click on the color coding to the right, you are brought to the corresponding WAN, wired, or wireless SLE. In some widgets, such as the Potential Anomalies widget, clicking on the color-coded status line opens a window containing further details. You can hover your mouse over any of the color coding on the Org Insights page to understand its meaning.
We have renamed the following categories so that the category names reflect the respective network domain instead of the device type:
“AP” as "Wireless"
"Switch" as "Wired”
"WAN Edge" as "WAN”
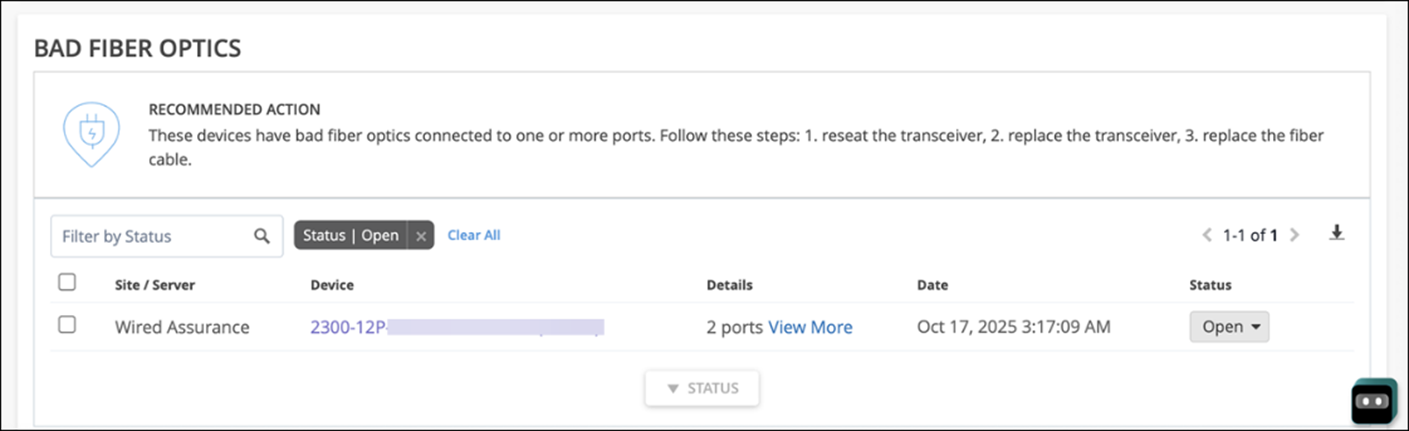
We have added a new Marvis Action called “Bad Fiber Optics” under the Layer 1 category. This action highlights faulty fiber optics, allowing for quick resolution and minimizing network disruptions. Marvis leverages switch reported events and network statistics to identify these issues. Marvis generates a Bad Fiber Optics action when both of the following issues occur on the same switch port within a 2-hour window:
Cable related issues, which include CRC errors, link flaps, and packet mismatches.
Fiber optics hardware issues indicated by low-light alarms.
Previously, the “Bad WAN Uplink” Marvis Action was used to highlight issues related to ISP connectivity problems, including ISP ARP and ISP DHCP failures. Any disruptions in WAN connectivity were grouped under the “Bad WAN Uplink” action. We have now refined the scope of this action to focus specifically on issues stemming from poor LTE connectivity.
To address the need for identifying ISP-related failures separately, we have introduced a new action called "Intermittent WAN Connectivity." This action highlights ISP ARP and ISP DHCP failures, which were previously listed under the “Bad WAN Uplink” Marvis Action.
The “Bad WAN Uplink” action will no longer be self-driving. However, the “Intermittent WAN Connectivity” action will be self-driving and enabled by default.
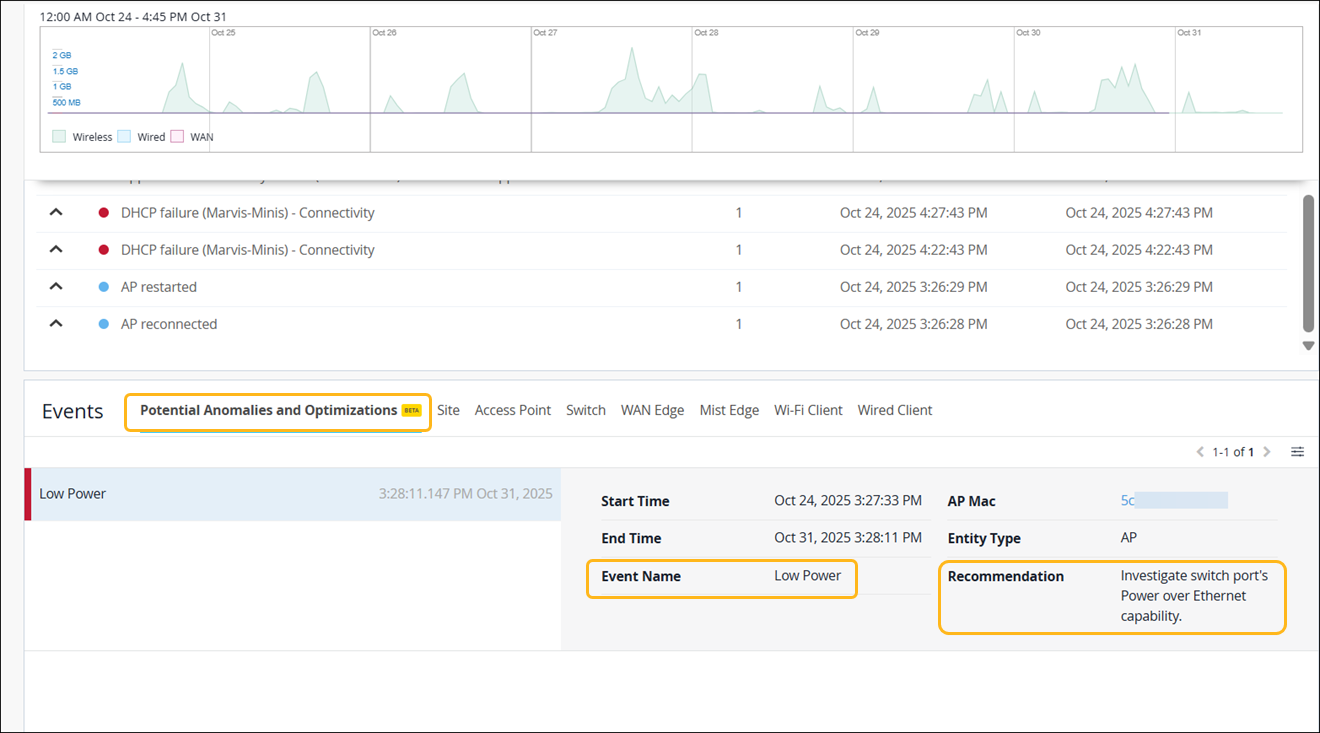
Marvis continuously monitors and analyzes real-time data from APs, switches, and WAN Edges to identify user-impacting issues across networks. By leveraging device telemetry, system logs, and performance metrics, Marvis flags potential anomalies and displays them on the Insights page along with recommended remediation steps for each anomaly. Covering issues from hardware and connectivity to configuration and performance, these anomalies can be site-level, like DHCP failures, or device-level, like device health. Potential anomalies serve as early warning signals, allowing administrators to address issues before they escalate, thus improving operational efficiency and reducing troubleshooting time.
The potential anomalies identified by Marvis can be found under the Potential Anomalies and Optimizations tab within the Events section on the site Insights page.
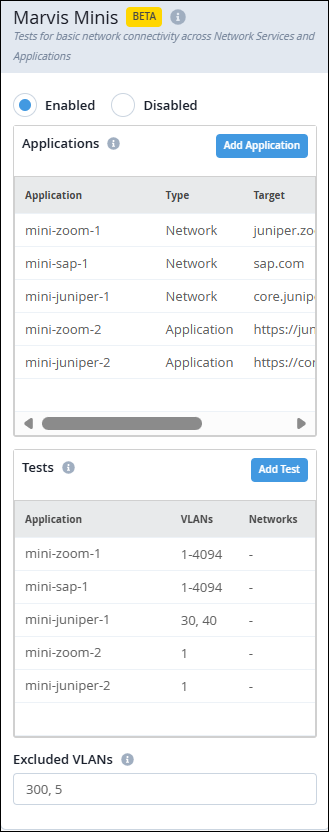
The updated version of Marvis Minis configuration now allows users to name their monitored custom applications. Users can define the applications and set up automated tests to continuously monitor their performance at both the organization and site levels. For each application, users can list the VLANs on which the tests need to be run. There is no change to the Marvis Minis functionality and the validations will continue to run on an hourly basis. For more information, see Add Custom URLs for Marvis Minis Validation.
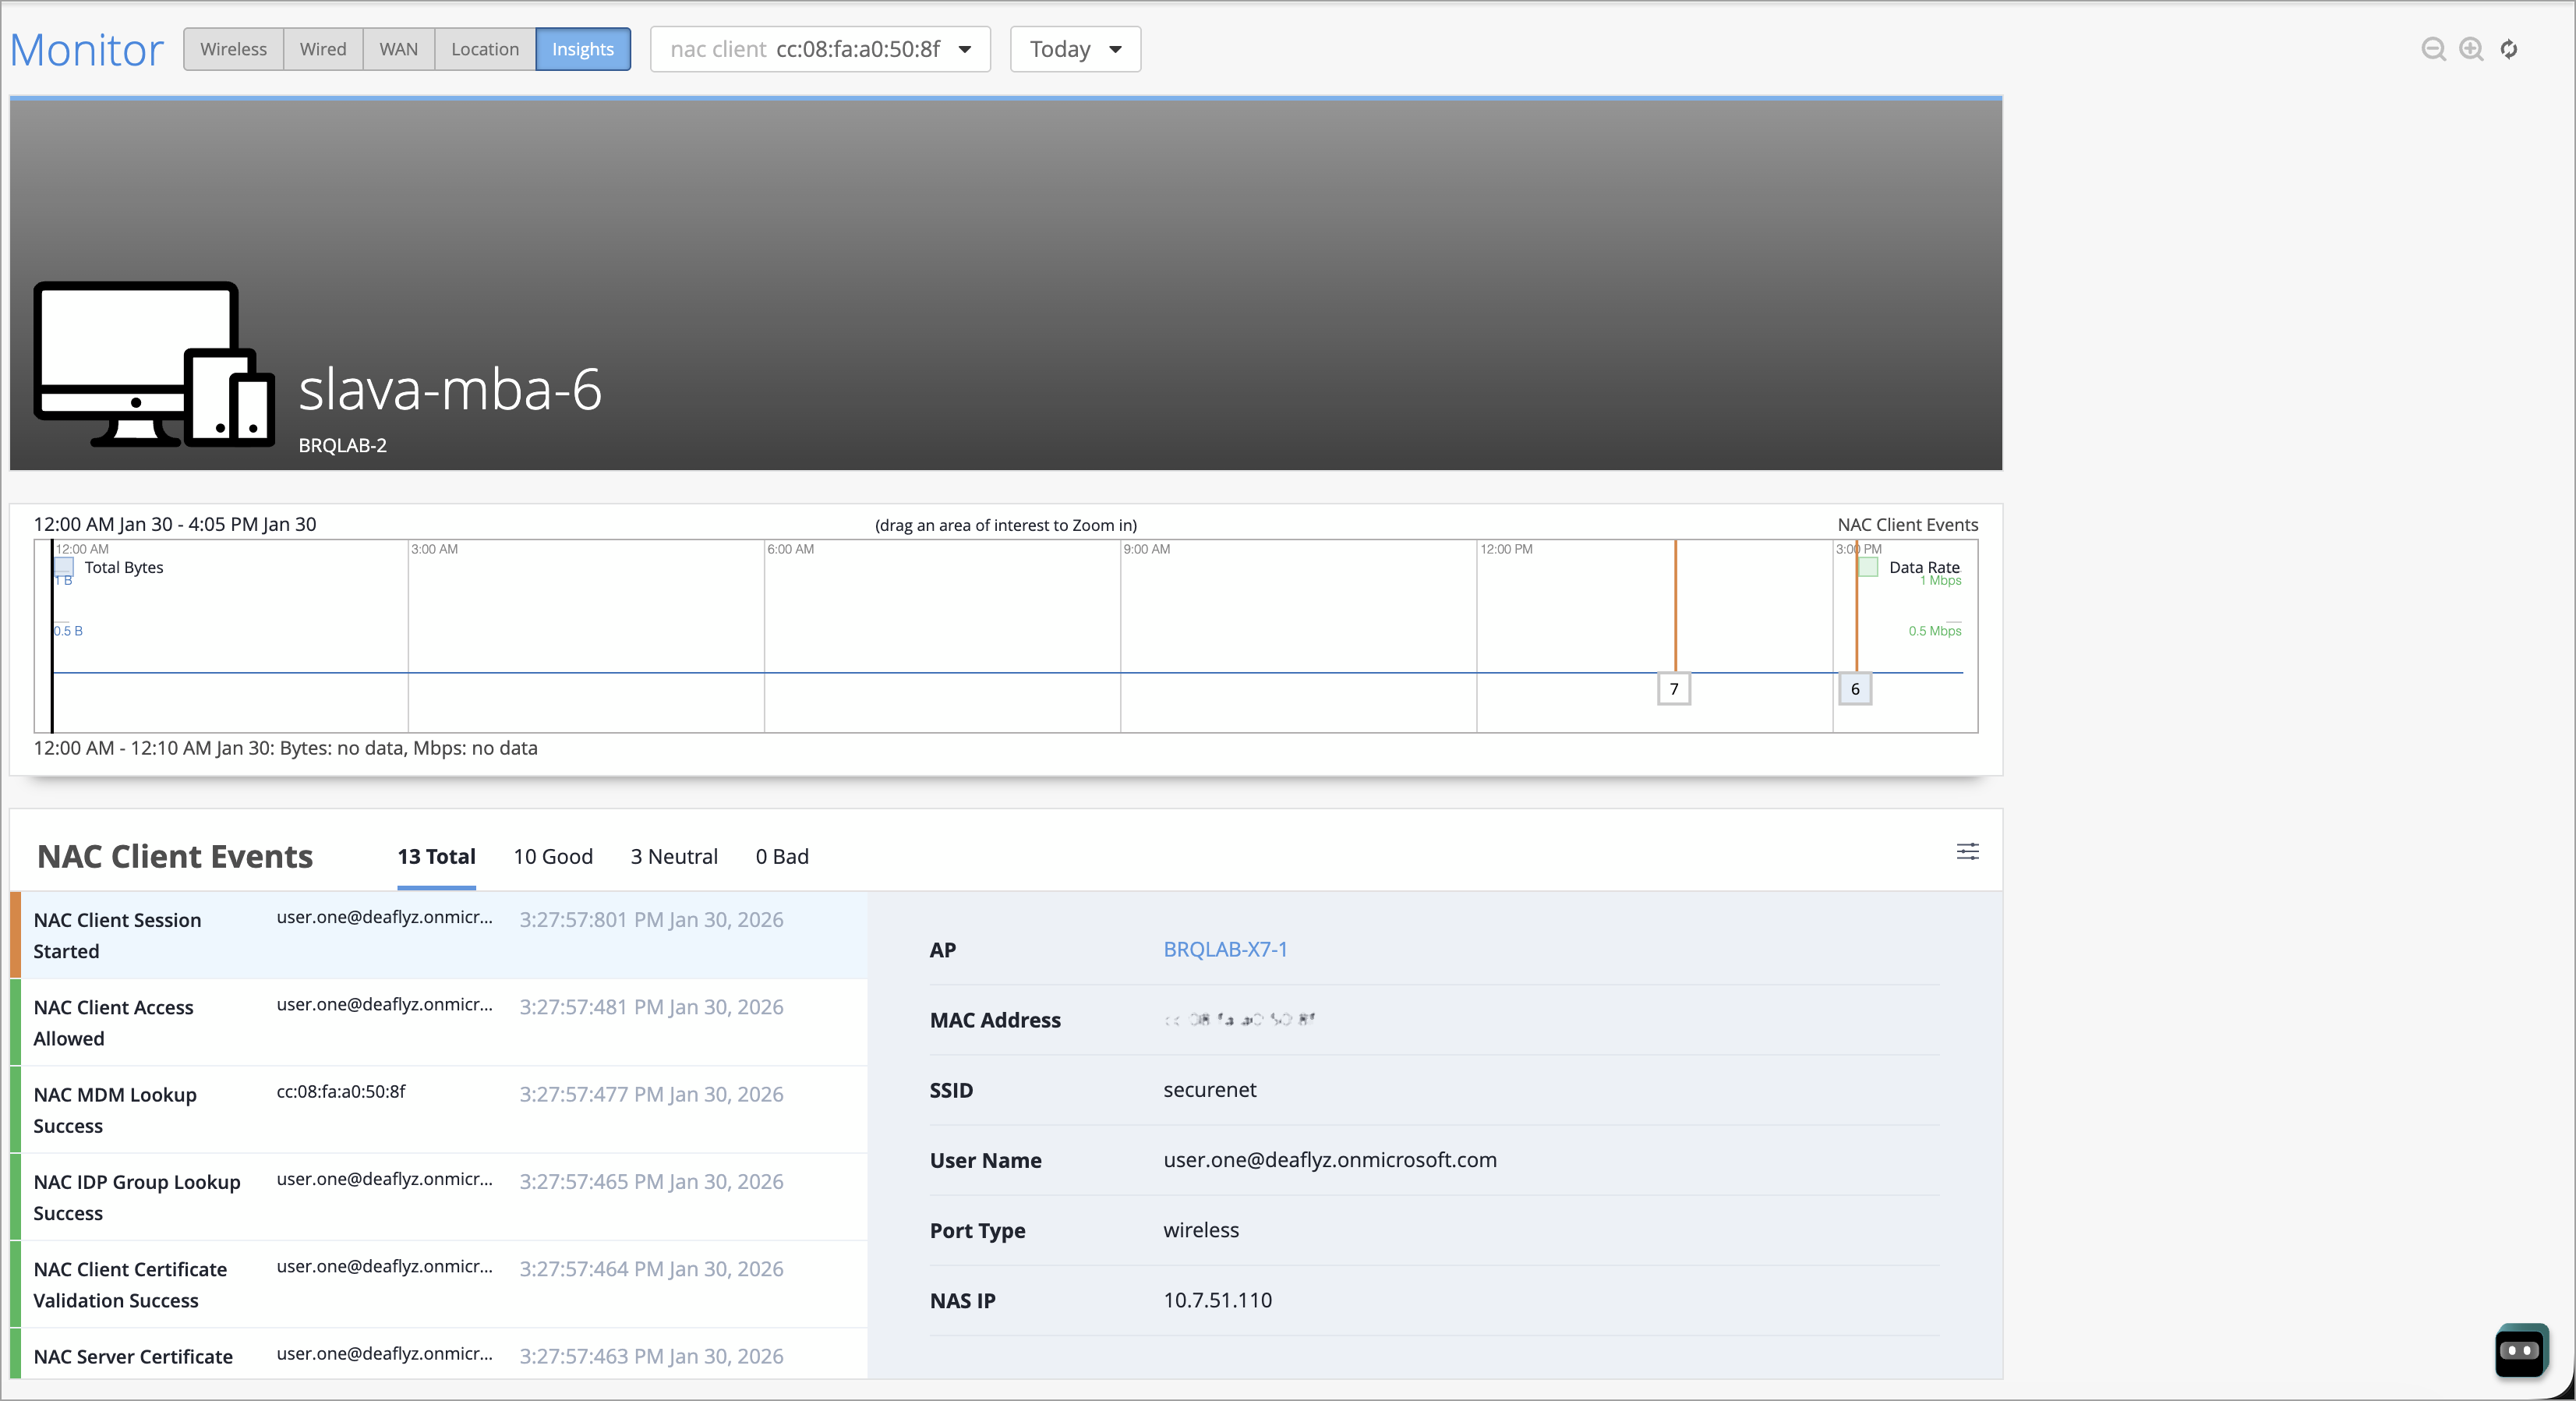
We are excited to introduce NAC Client Insights, which provides a quick overview of potential issues that affect the NAC clients' network experience. You can access this page by navigating to Monitor > Service Levels > Insights. Click the context menu at the top of the page, then click NAC Client on the left, and then select the client to view insights.
The page shows NAC Client Events with tabs: Total, Good, Neutral, and Bad. You can also click the Settings button at the upper-right corner to select the event types to include. The Current Values section at the end of the Insights page shows:
Properties—details such as User, MAC address, Auth Type, Client Type, and VLAN ID
Connection Status—details such as State, Client Type, and NAS Vendor
We have added several features to the Auth Policies page to make it easier for you to create, manage, and monitor your policies. You can see the new features by going to Organization > Access > Auth Policies.
Now you can:
Drag and drop labels onto your rule from the new Assign Labels window.
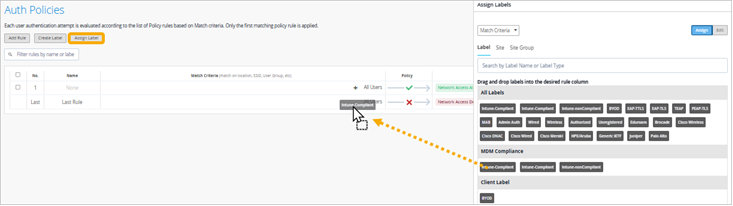
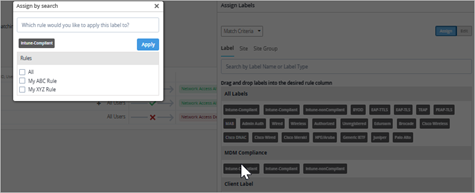
Batch-assign a label to multiple rules. In the new Assign Labels window, double-click a label, and then select the rules that you want to assign it to.
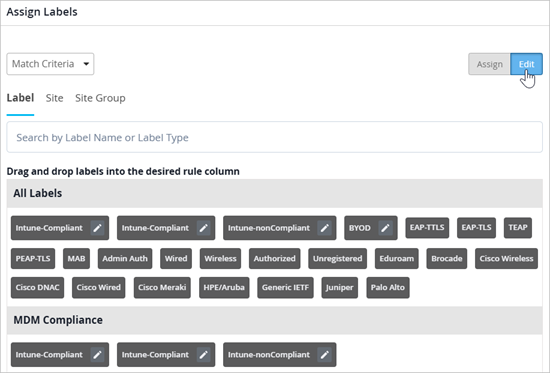
Edit labels quickly and easily. In the new Assign Labels window, click the Edit button, then click the pencil icon for the label to modify. You can change the label name and properties.
Assign policies. In addition to the match criteria as shown in the previous examples, you can change the selector to Policies, and then assign policies to your rules.

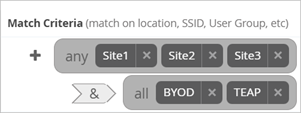
Interpret nested rules more easily. Visual cues indicate which labels are “match any” or “match all.”
View NAC events for your policies without navigating away from the Auth Policies page. Click a number in the Hit Count column to see NAC events for a particular rule, or click the new Show NAC Events button to see all events in an overlay window. Close the overlay window to see your rules again.
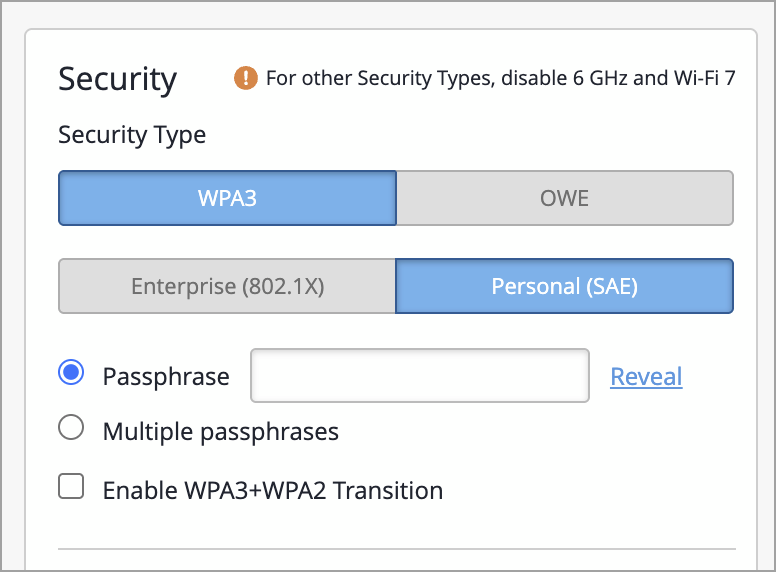
WPA3 is now the default security type when you create a new WLAN within Mist. There are no changes to the existing WLANs. WPA3 and OWE are mandatory with the use of Wi-Fi 6E and W-Fi 7, so it is time we aligned our default security settings with these requirements set by the Wi-Fi Alliance.
If you require additional security modes, such as WPA2 or Open, please disable both 6 GHz and Wi-Fi 7 on the WLAN.
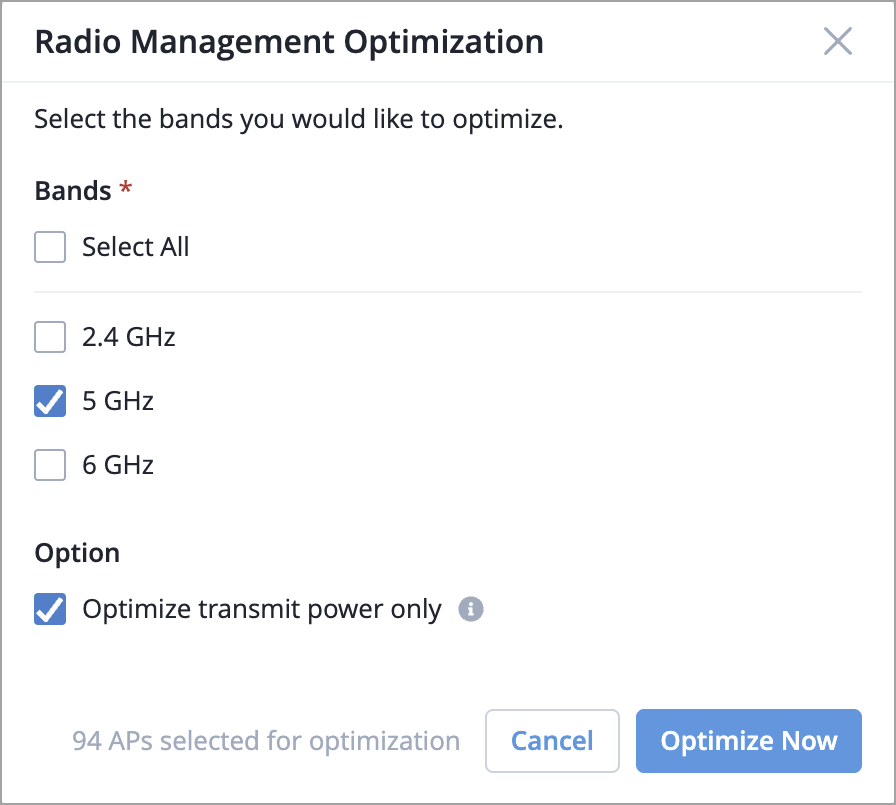
If you ever need to update RRM settings for a select set of APs in a site, you can now do that. For example, you might want to change transmit power or allowed channels in an RF template or device profile, and apply those changes to just a few APs before the next RRM cycle to minimize disruption.
To do that, go to the Access Points page, filter and select the APs you want, then click More and choose Optimize Radios. You can optimize by band and also choose to only optimize the transmit power.
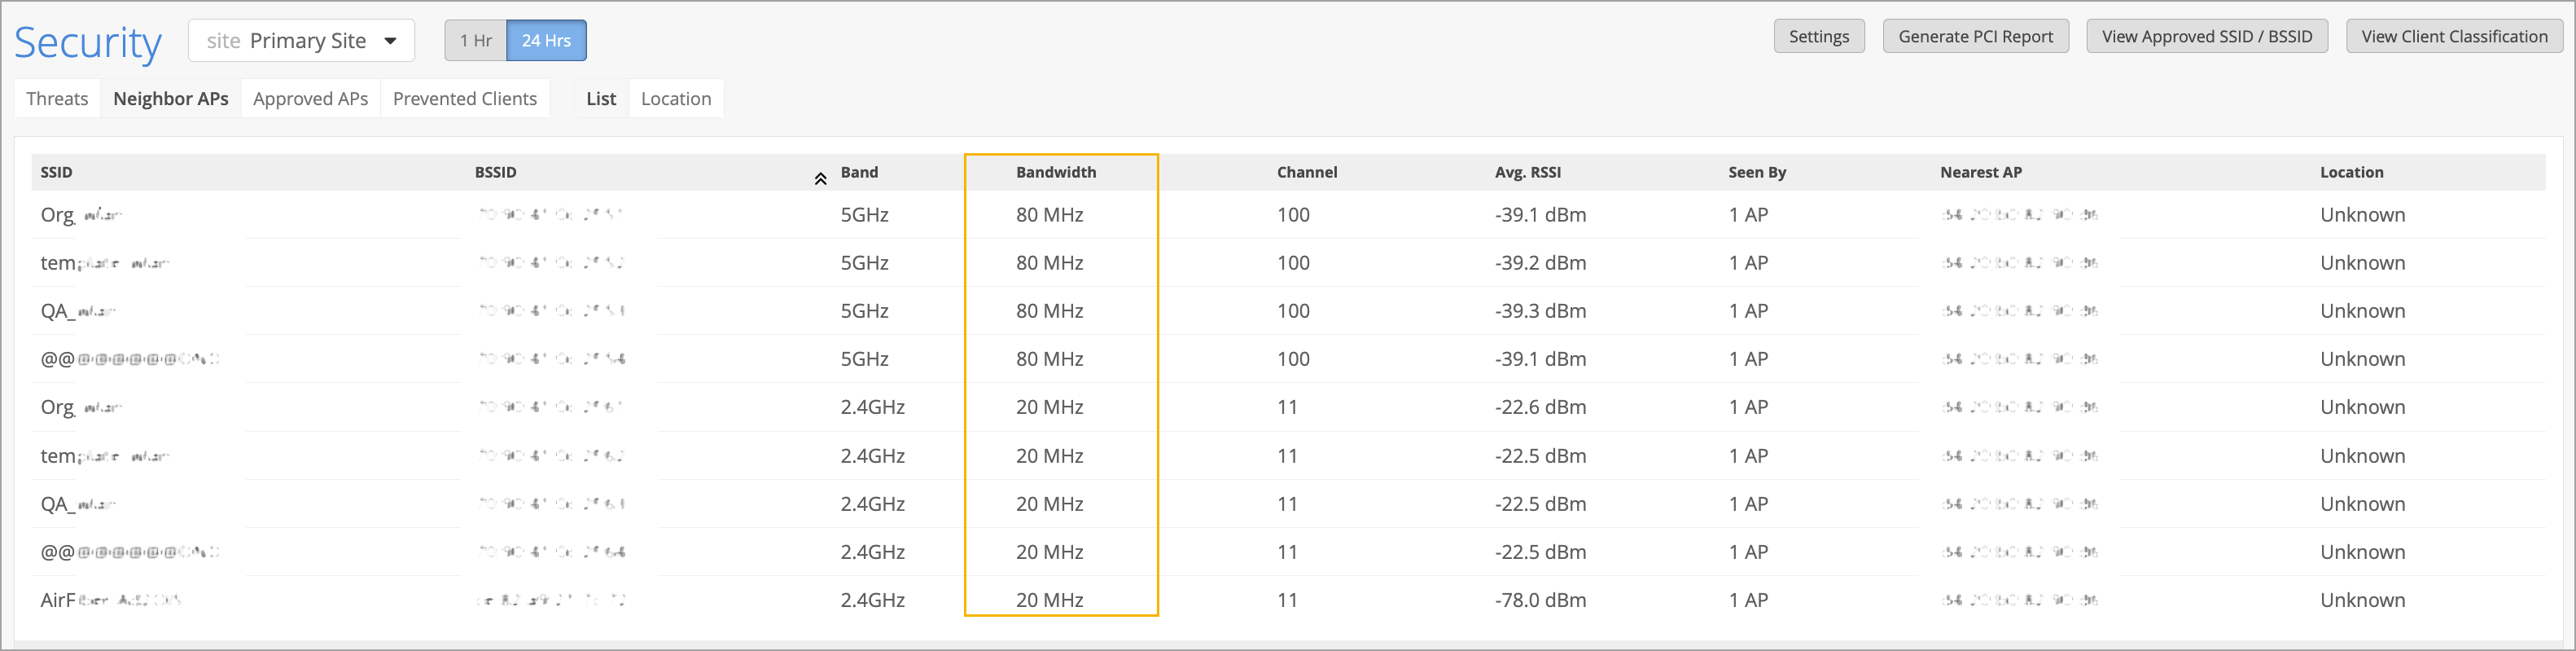
The security dashboard in Mist now displays the channel width (20/40/80/160/320 MHz) used by detected neighbor APs and threat APs. This information is collected by the Mist APs' dedicated scanning radios, which monitor nearby wireless devices. Channel width visibility helps to identify potential RF congestion or interference, as different channel widths impact how much spectrum an AP uses. You can view channel width for neighbor APs and threat APs in the Bandwidth column on the Site > Security page.
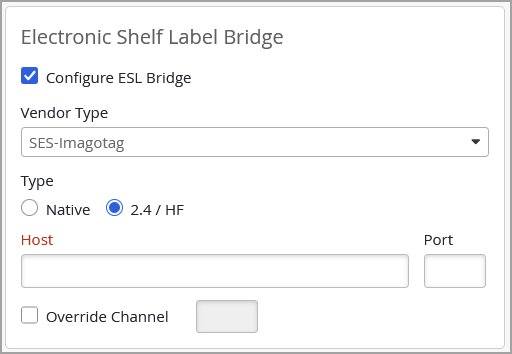
Support for configuring Electronic Shelf Label (ESL) bridges in Mist is now generally available. ESLs are small, battery‑powered e‑paper displays that present product and pricing information at the shelf edge, replacing traditional paper tags. They connect wirelessly to a central hub, enabling real‑time pricing updates and automated inventory workflows. Configuring an ESL bridge via Mist involves enabling the USB port on supported Access Points (APs) through the AP page or Device Profiles. This allows the AP to communicate with third‑party ESL vendor dongles, forming the link between the wireless network and the ESL management system. For more information, refer to Electronic Shelf Labels.
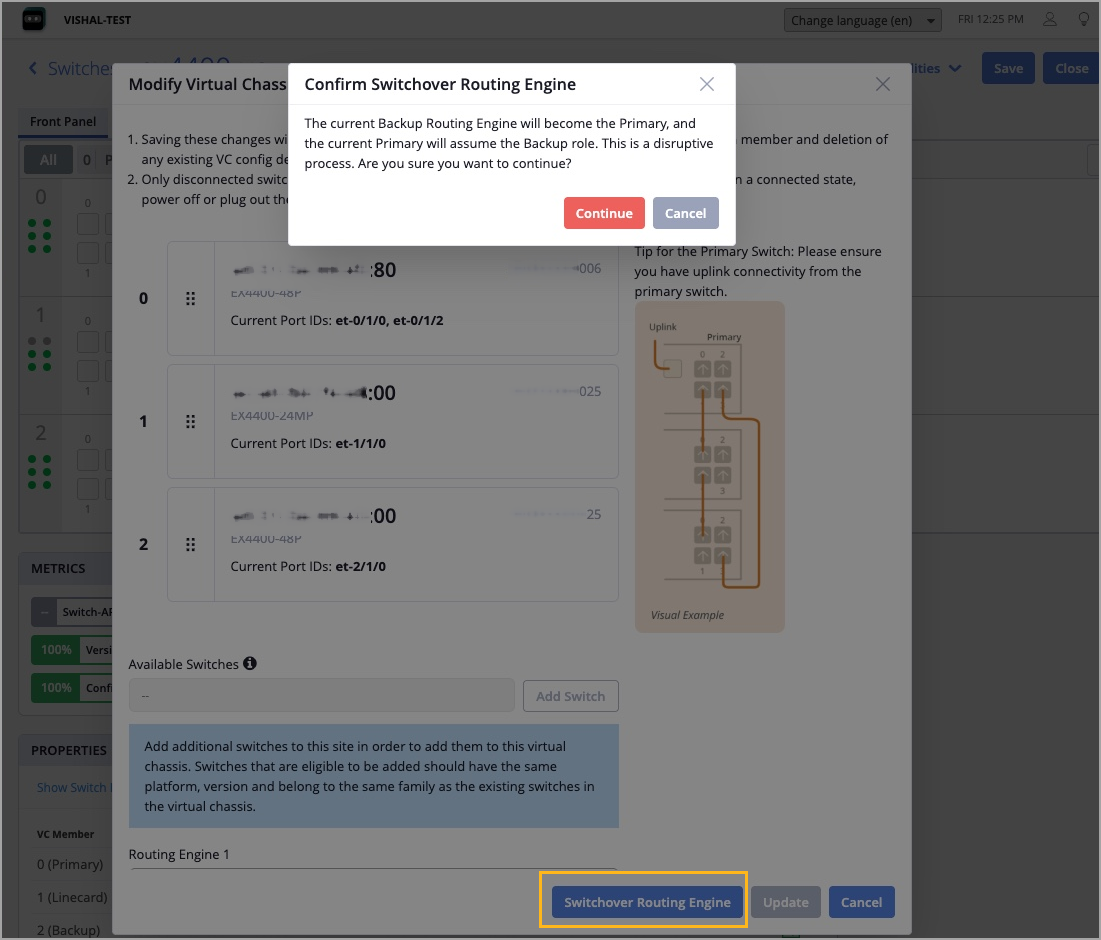
You can now manually initiate Routing Engine switchover in a Virtual Chassis.
In a Virtual Chassis, one member switch is assigned the primary role and hosts the primary Routing Engine. Another member switch is assigned the backup role and hosts the backup Routing Engine. Routing Engine switchover enables the system to transition control from the primary Routing Engine to the backup Routing Engine.
To perform Routing Engine switchover, use the Switchover Routing Engine option on the Modify Virtual Chassis window, which is accessible from the switch (Virtual Chassis) details page. This option is available only if the following conditions are met:
The Virtual Chassis is preprovisioned.
The Virtual Chassis has a primary and a backup member.
Note that the switchover briefly affects the operation of Virtual Chassis.
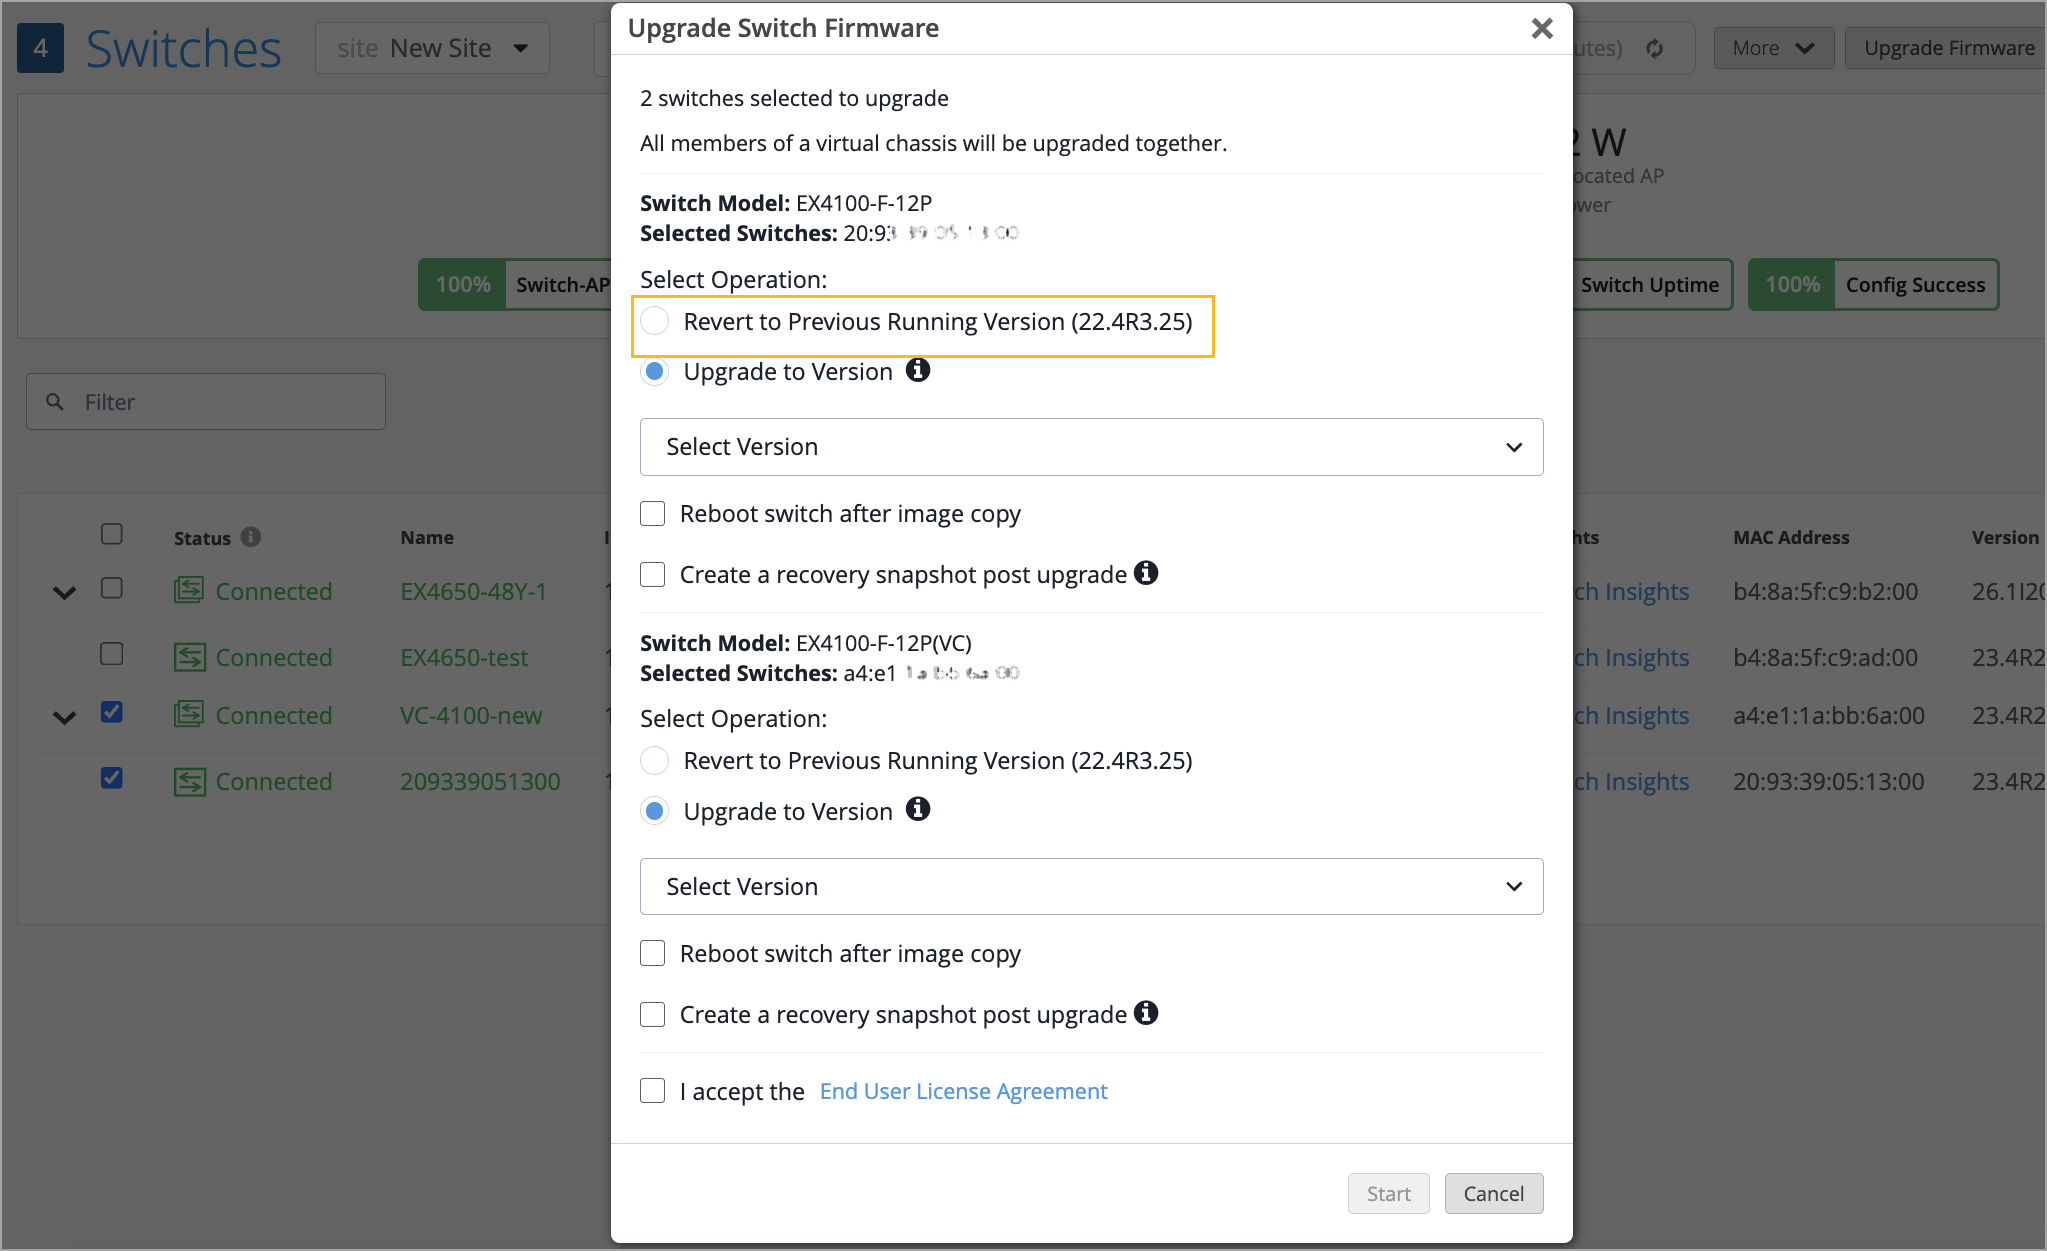
You can now roll back the Junos software on a standalone switch or Virtual Chassis device to the previous (backup) version stored on the device.
Only the following switches support the rollback operation: the EX4000 Series, EX4100 Series, and EX4400 Series switches.
Before initiating a rollback operation, ensure that the following prerequisites are met:
All devices selected for the rollback operation, whether standalone switches or members in a Virtual Chassis device, must support rollback.
Each device selected for the rollback operation must have a backup Junos version that matches the others.
Rollback is not allowed if the selected switch does not contain the previous running version as a package.
To perform a rollback, use the Revert to Previous Running Version option on the Upgrade Switch Firmware page, which is accessible from the Switches page (switch list) or the individual Switch Details page.
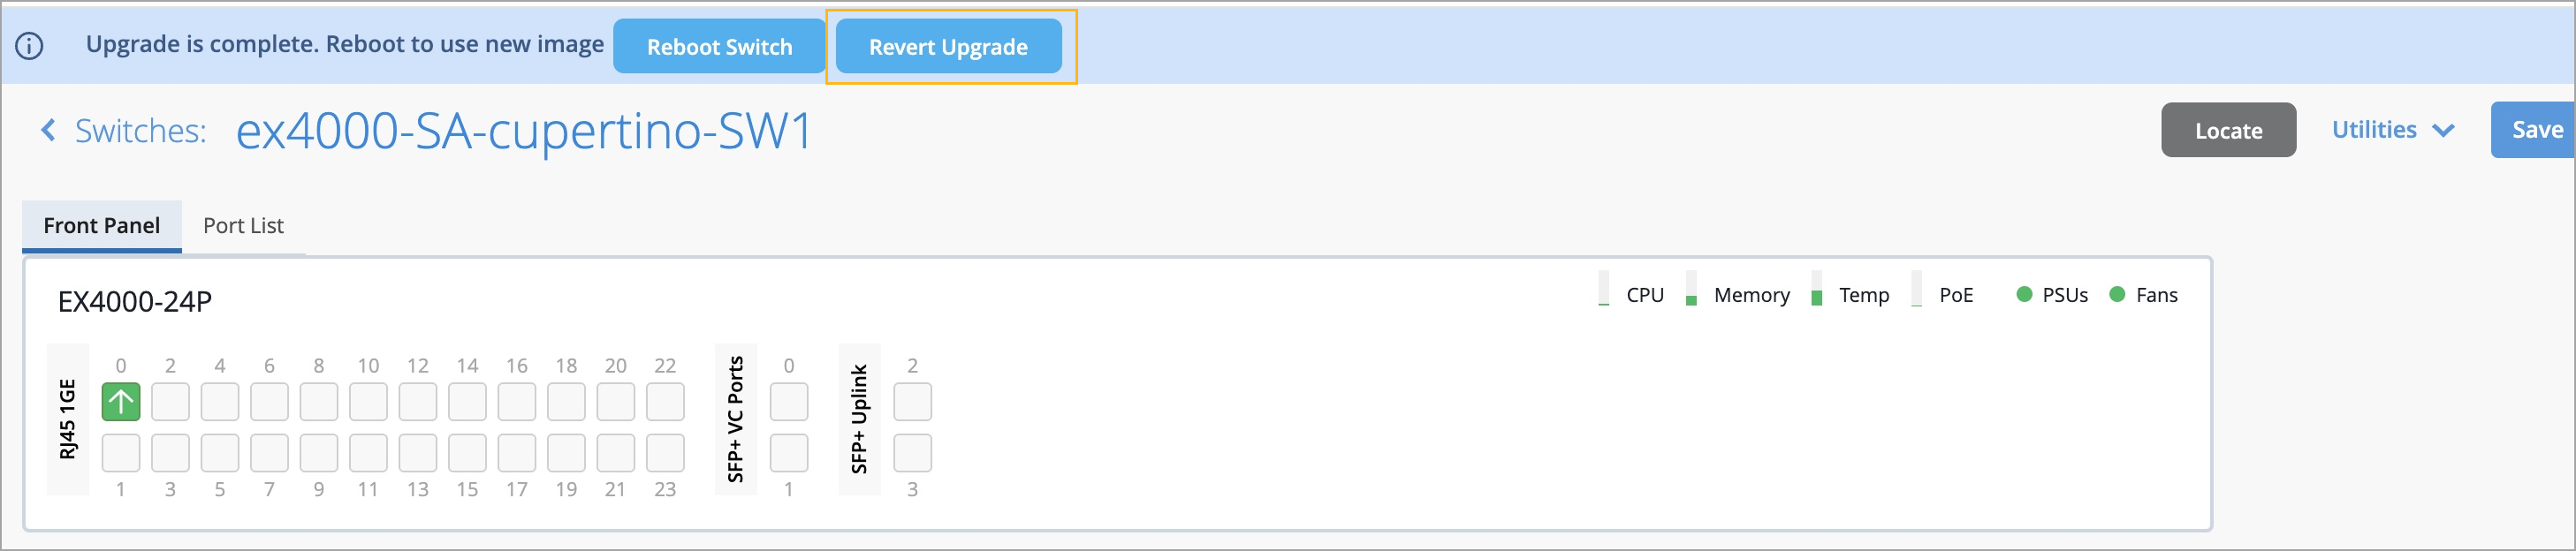
When you start a switch upgrade without selecting the reboot option, the new software image is stored on the switch in a pending state. To complete the upgrade, you must reboot the switch.
In this release, you can choose to revert the upgrade before rebooting the switch. The switch details page provides options to either reboot the switch or revert the upgrade. Note that the revert option is available only until the switch is rebooted. This feature is available only to the following switch models: EX2300 Series, EX3400 Series, EX4000 Series, EX4100 Series, and EX4400 Series.
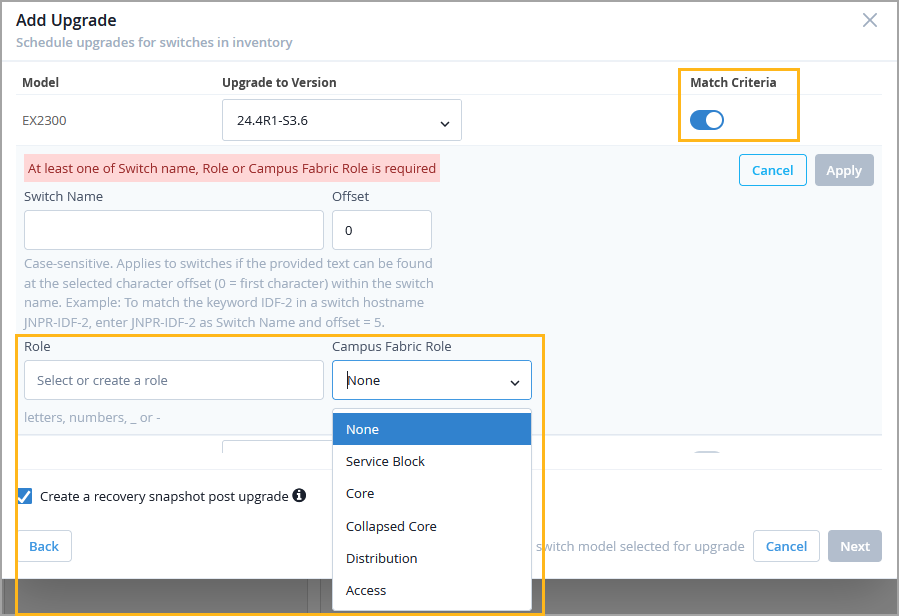
You can now use switch roles (both user-defined roles and campus fabric roles) as match criteria when defining a switch upgrade schedule at the organization or site level. If switch roles are used as match criteria, the upgrade schedule includes only the switches that have the specified roles assigned. Previously, the only additional match criterion available was switch name.
This enhancement provides greater control and granularity in selecting switches for upgrades.
To configure switch roles as match criteria, enable the Match Criteria option in the upgrade schedule. To access the upgrade schedule configuration, click Add Upgrade in the Firmware Upgrade section on either the Organization > Settings page or the Organization > Site Configuration > Site Name page. For more information, refer to Schedule and Automate Switch Upgrades.
To help you proactively manage network health and prevent disruptions, Juniper Mist has introduced new alerts for the following critical switch events:
Switch IP Conflict Detected—Triggered when two devices on the network share the same IP address, which can lead to connectivity issues and service interruptions.
Switch MAC Limit Exceeded—Triggered when the number of MAC addresses learned on a switch port has exceeded the configured limit. This event may indicate misconfigurations or potential security concerns.
You can view and manage these alerts on the Monitor > Alerts page in the Mist dashboard.
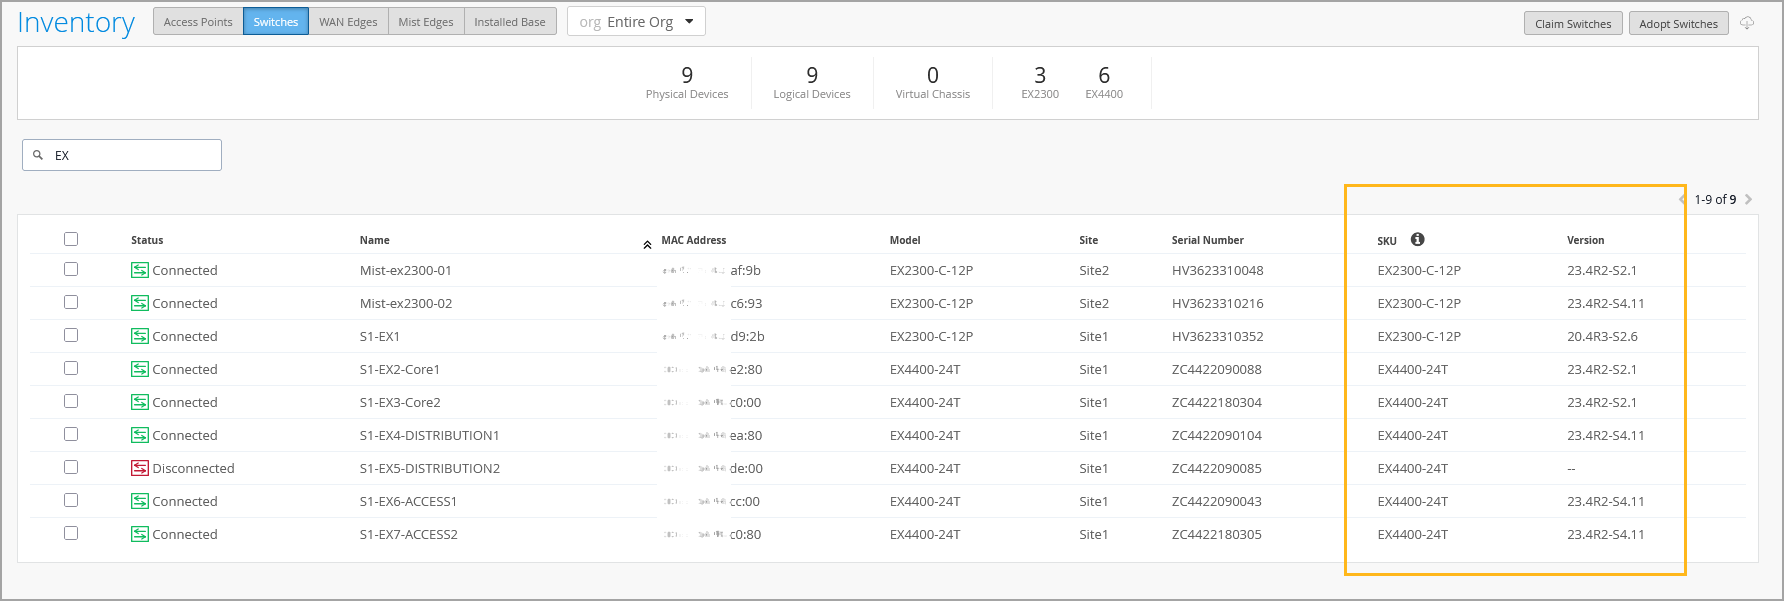
The switch Inventory page (Organization > Admin > Inventory > Switches) now displays the device firmware versions along with the SKU information. With this update, you can instantly view and compare firmware versions deployed on your switches across an organization. This feature is especially useful when managing the lifecycle of a wired network within the Mist platform, enabling better visibility into device update status and compliance.
You can also use firmware version and SKU as keywords to filter data on the Inventory page.
Note that SKU information will not be available for brownfield switches, which are onboarded to Mist through the Adopt workflow.
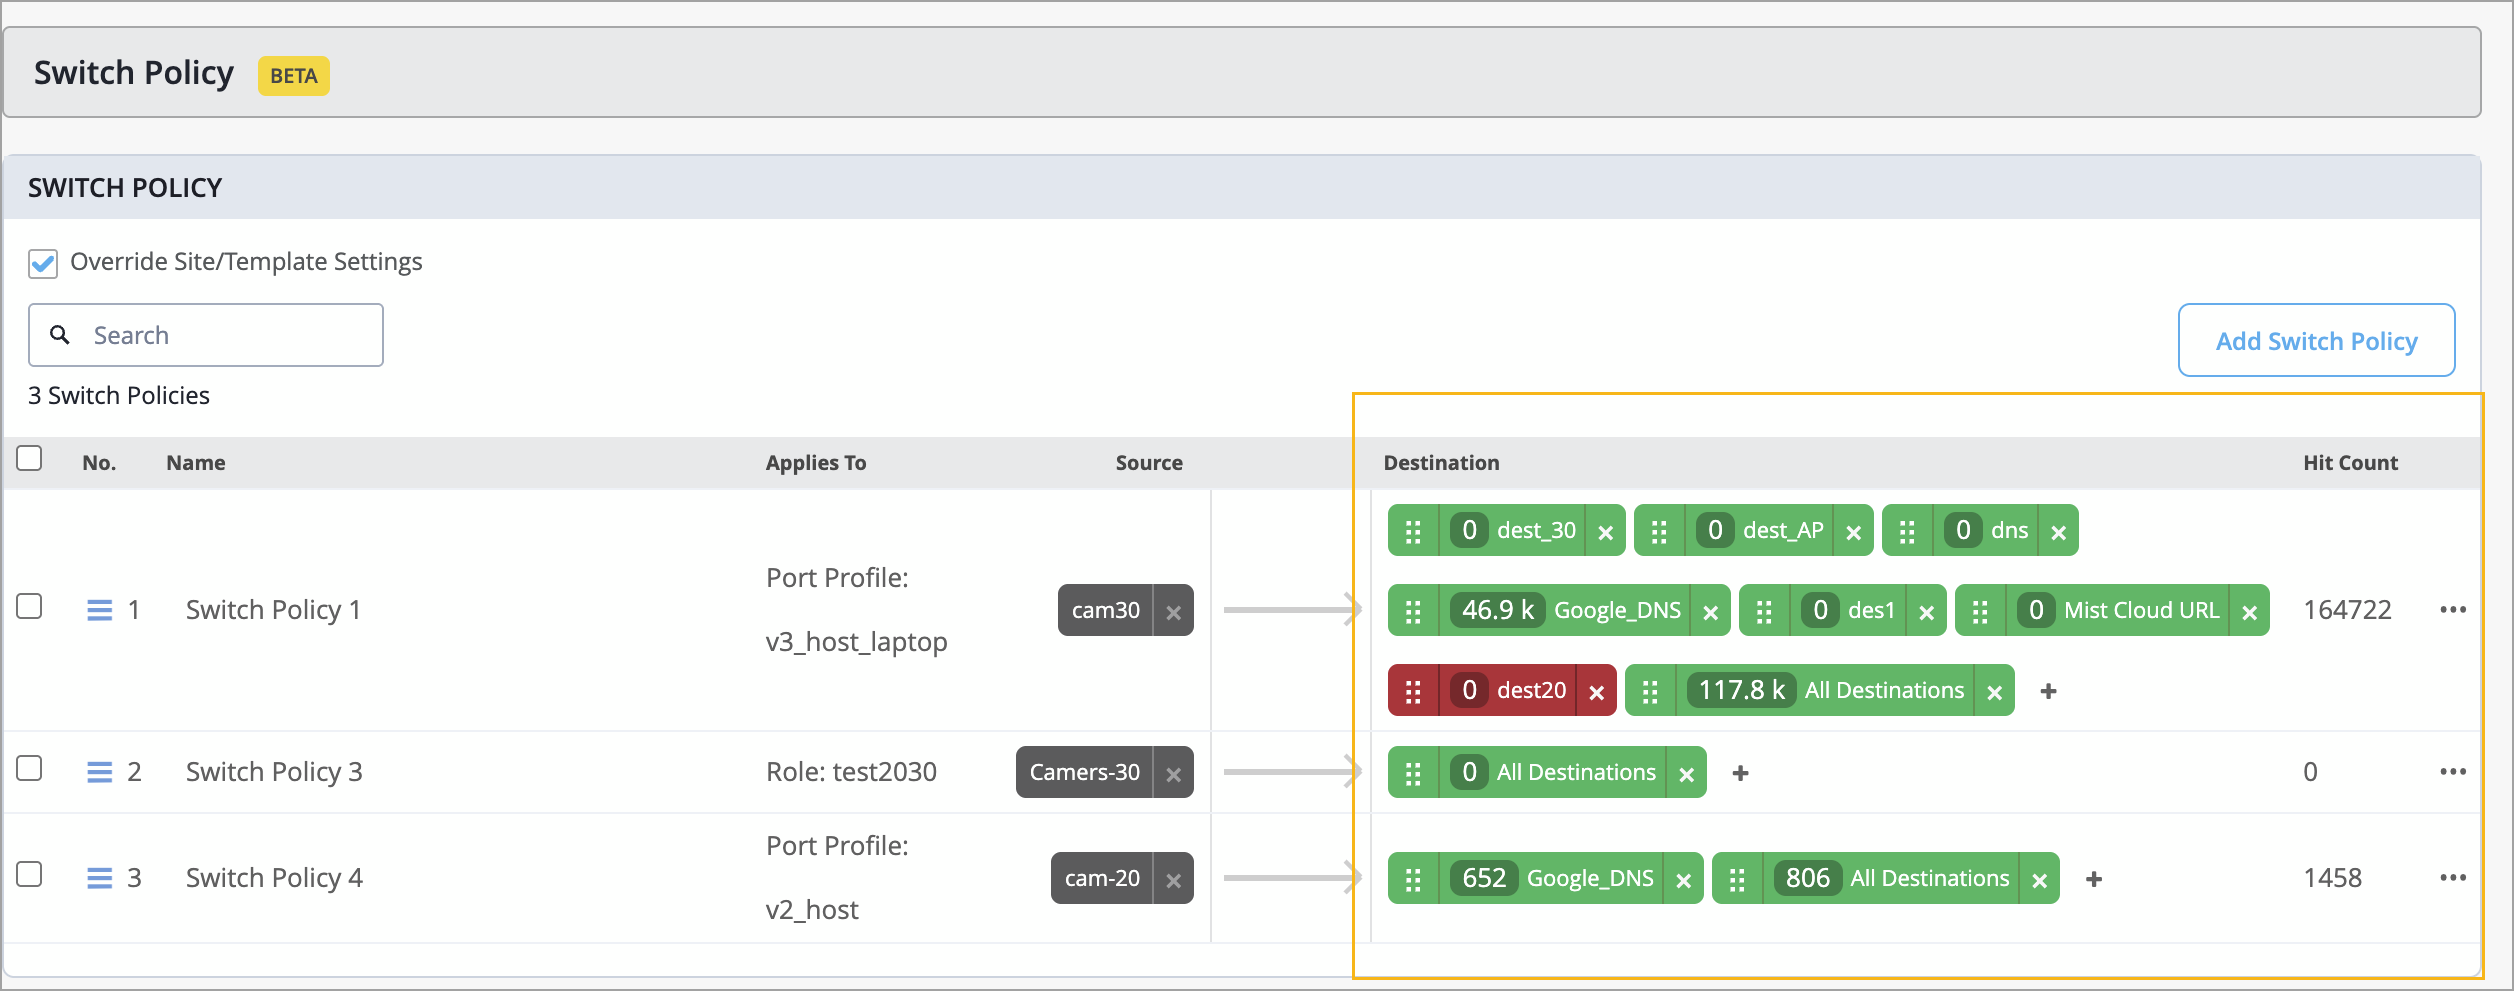
Juniper Mist now provides hit count information for switch policies at the switch level. A hit count represents the number of times a switch policy rule has been triggered (that is, matched by network traffic). This data is available in the Switch Policy section on the switch details page.
The information includes the following:
Overall hit count for a switch policy. This information is displayed in the Hit Count column.
Per-destination hit count for more granular insights. You can click each destination tag to view the hit count for that tag along with a policy trigger event time series.
This information is useful for tasks such as traffic analysis and troubleshooting.
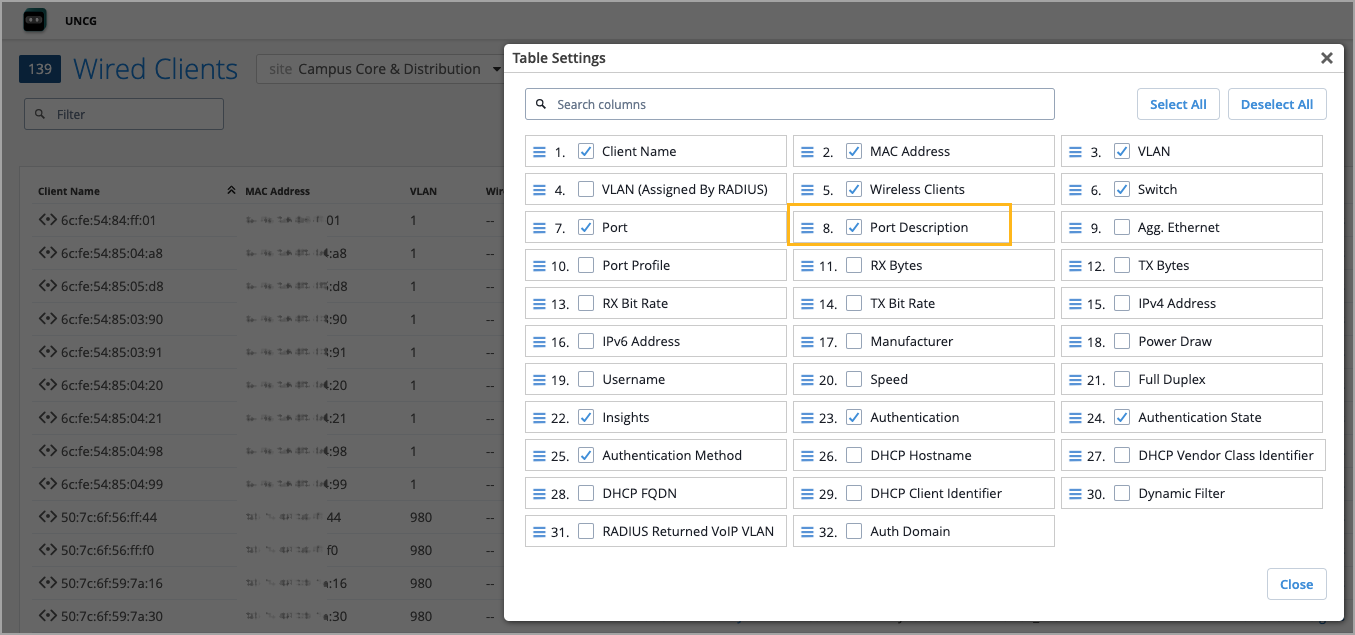
We have added a new Port Description column to the Wired Clients view (Clients > Wired Clients) within Mist. This enhancement provides quick visibility into the switch port to which clients are connected, helping network administrators gain insights into the network topology with minimal effort.
By default, the Port Description column is not visible in the Wired Clients list view. To include it, click the Table Settings button on the upper right of the page, select the check box corresponding to the Port Description field, and then click Close.
When a switch is disconnected from the Mist cloud and cannot reconnect, you can quickly find out the disconnection reason using the switch CLI and share the details with the Juniper support team.
To check the disconnection reason, run the following CLI command locally on the switch: op mist_debug.py cmd check-connectivity.
For example:
user@switch> op mist_debug.py cmd check-connectivity

Starting Cloud Connection Troubleshooting
Management routing-instance is not configured
Checking if Switch IP is configured...
Switch IPs configured: ['178.35.0.45']
----------------------------------------
Checking if Gateway is configured...
Default gateway is configured: 178.35.0.1
----------------------------------------
Checking if Gateway is reachable...
Default gateway is not reachable
Failed
Troubleshooting ended with trouble code: GATEWAY_UNREACHABLE
Note that this command should be used only when the switch is disconnected from the Mist cloud. It retrieves the reason for the current disconnection state. This command does not work if the switch has never connected to the Mist cloud.
Mist Campus Fabric now supports assigning distinct VLAN sets for ESI‑LAG connections between distribution and access switches across different pods. This enhancement allows you to create different port profiles for each pod, enabling greater flexibility in segmentation and design. You may reuse the same VLANs across multiple pods or define unique VLANs per pod depending on your requirements. Each port profile may include different or overlapping VLANs.
This capability is supported only in Campus Fabric Core–Distribution CRB and ERB topologies. VLAN assignments are configured through port profiles on the Distribution / Access Port Configuration tile on the Campus Fabric Configuration > Network Settings page.
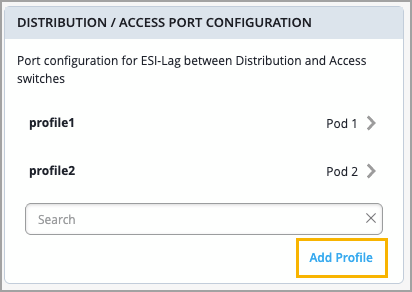
A pod is an existing Mist feature designed for improved scalability and simplified management. Access and distribution devices are grouped into pods, which often represent physical locations such as buildings.
To simplify switch monitoring, Mist has added a new Digital Optical Monitoring chart for fiber-optic switch ports. The chart displays five port properties, and you can filter the chart by clicking the respective buttons. Each of the five properties has a minimum, maximum, and average value.
The five properties are:
Rx Power
Tx Power
Voltage
Current
Temperature
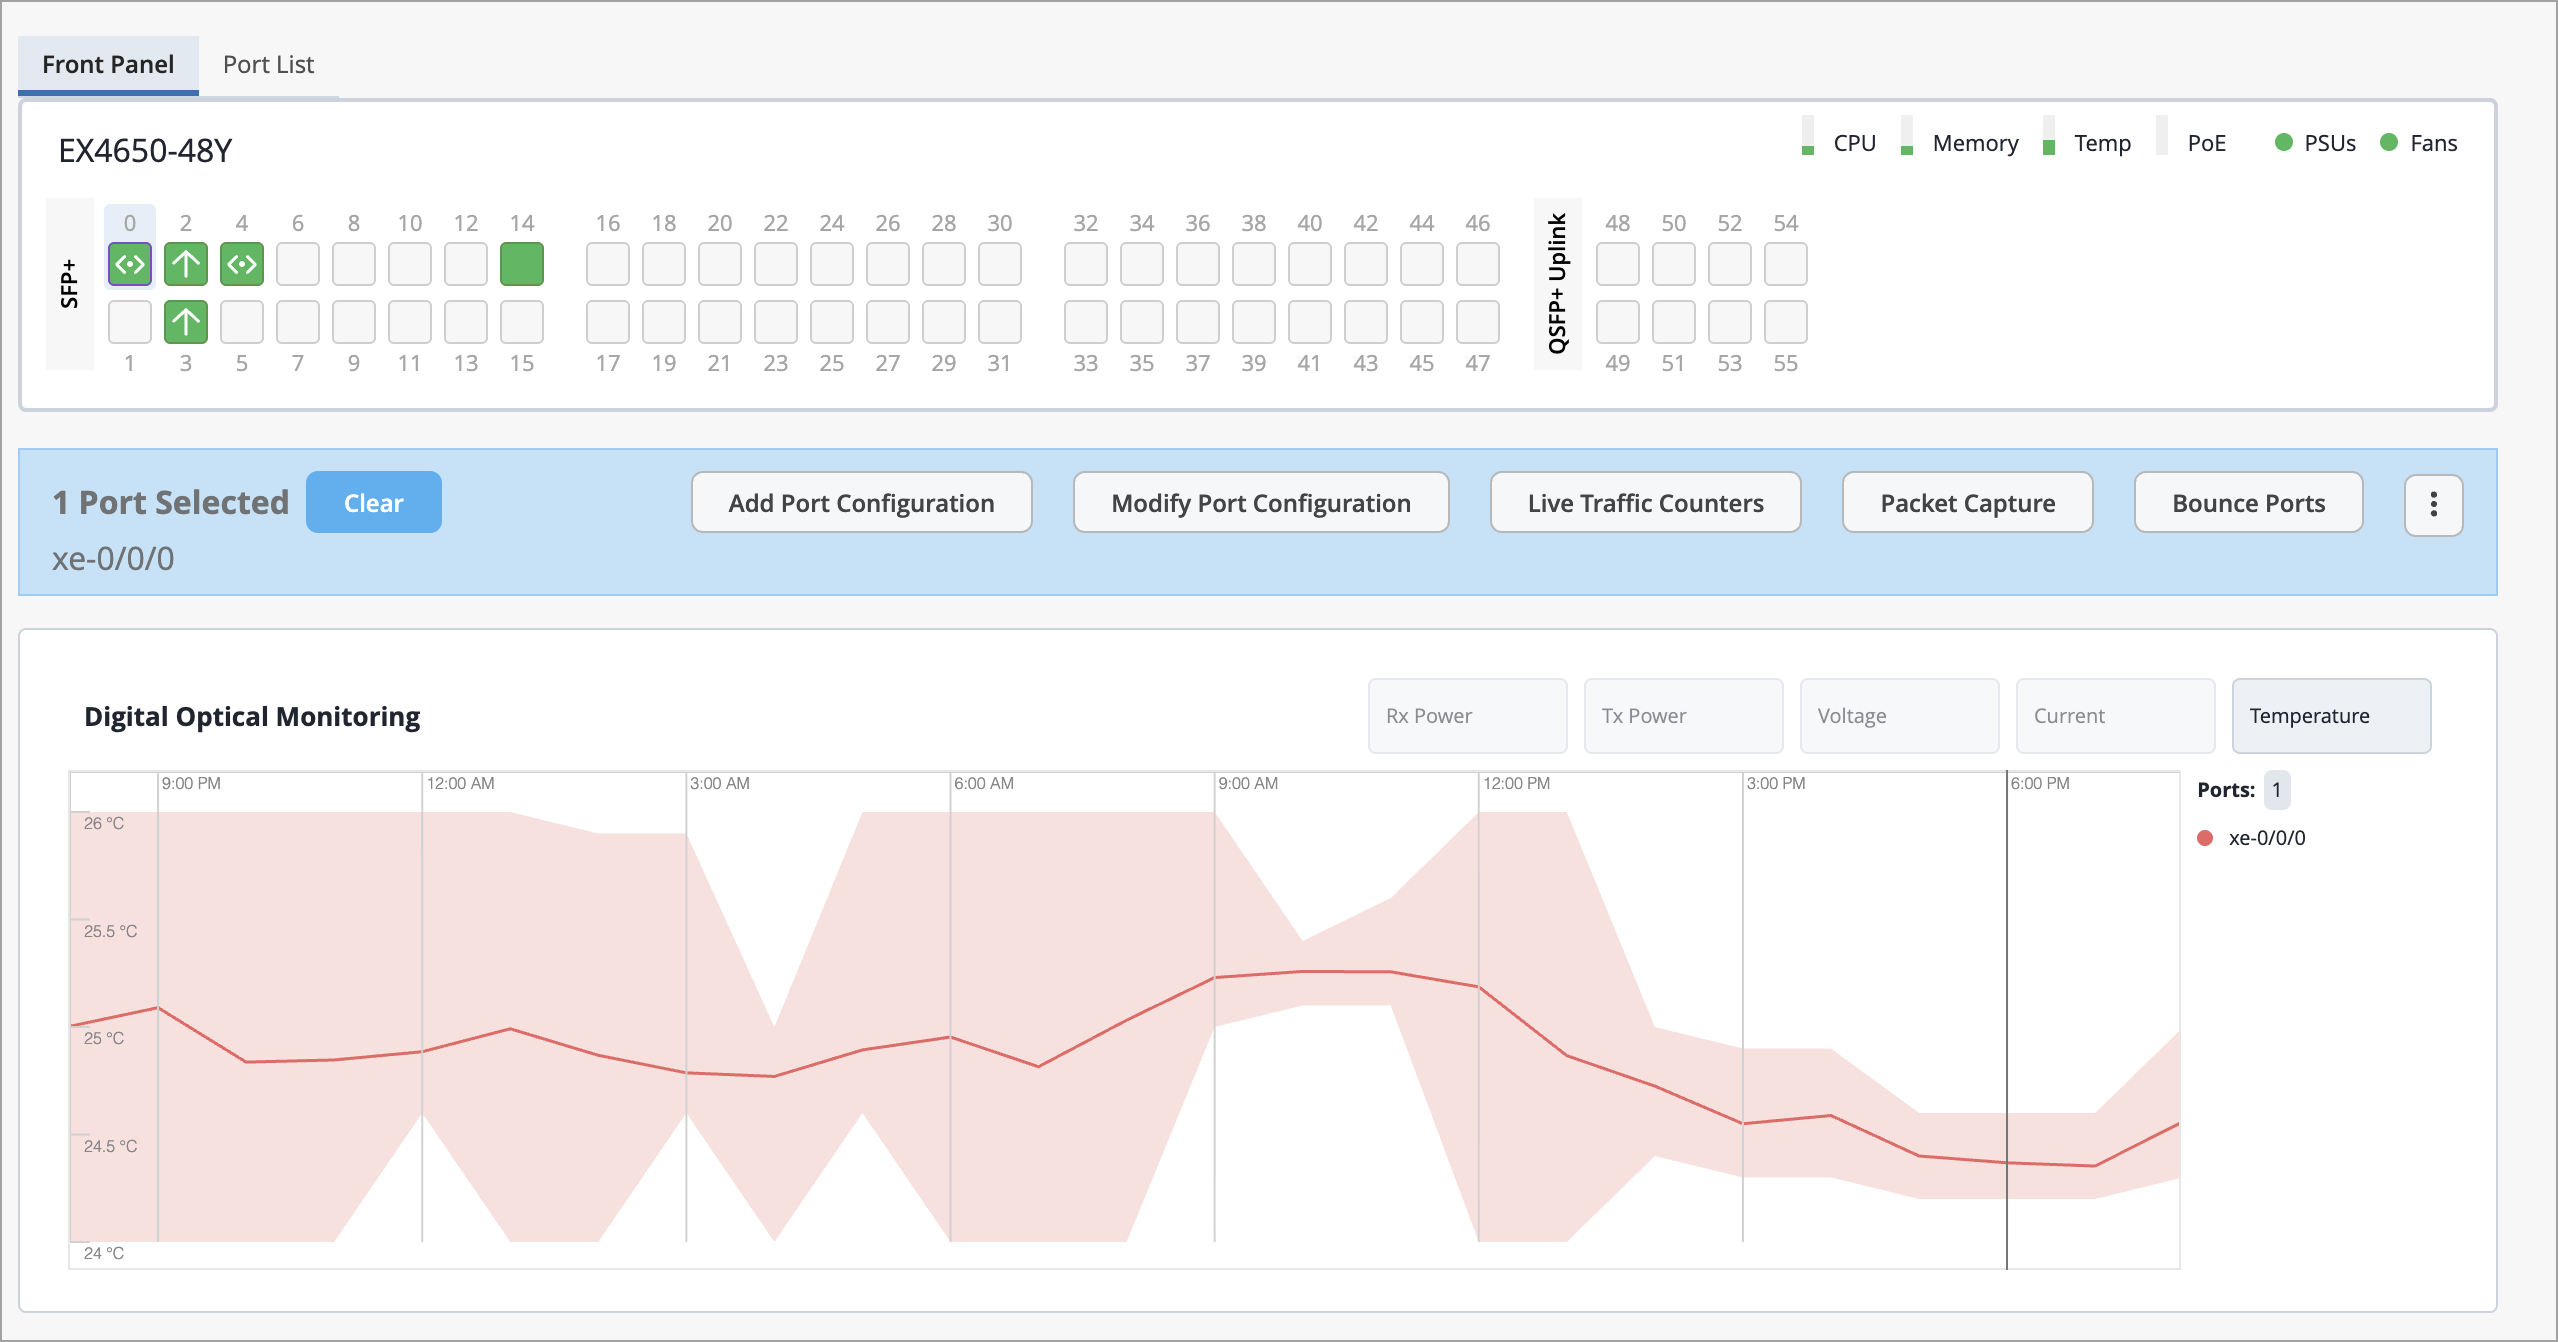
You can find this chart on the Switch Details page by clicking Switches from the left menu of the Mist portal, then select the switch to open the Switch Details page. From there, select the port(s) from the Front Panel and see the chart just below.
You can also navigate to Switch Insights from the Properties section of the Switch Details page, then scroll down to Switch Charts.
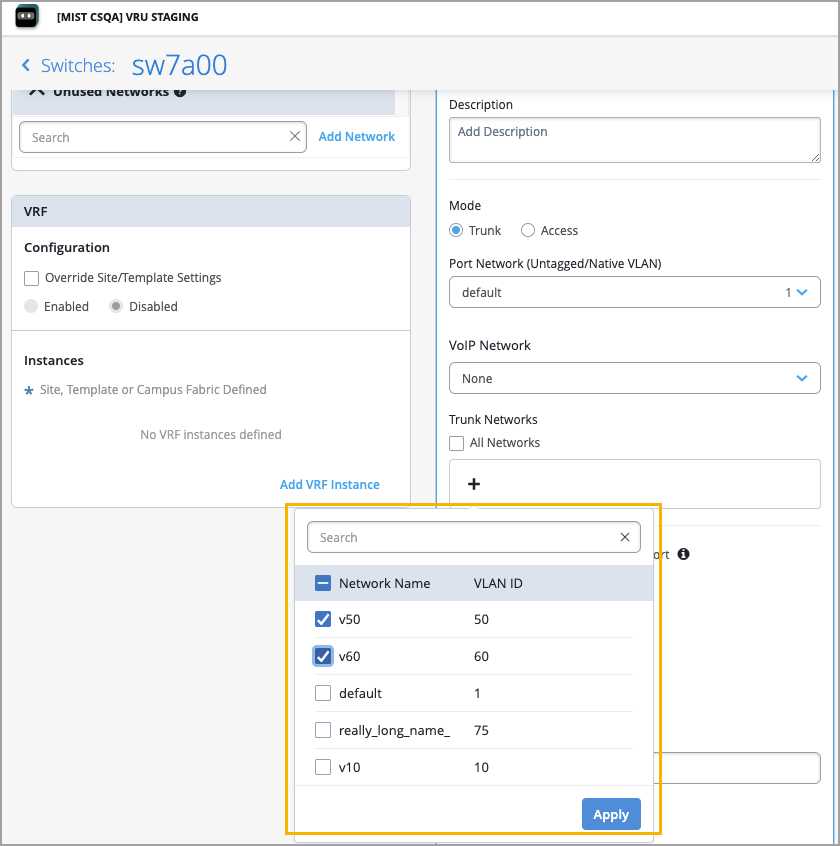
We have improved the option to multi-select networks in various Wired Assurance configuration pages, including:
DHCP Snooping in switch configuration
Port profiles in switch and campus fabric configuration (applies to trunk networks)
VRF in switch and campus fabric configuration
Previously, to include multiple networks, you had to select and apply the networks one by one. The new enhancement allows you to select multiple networks from a list view and apply the selection at one click, making configuration faster and more efficient.
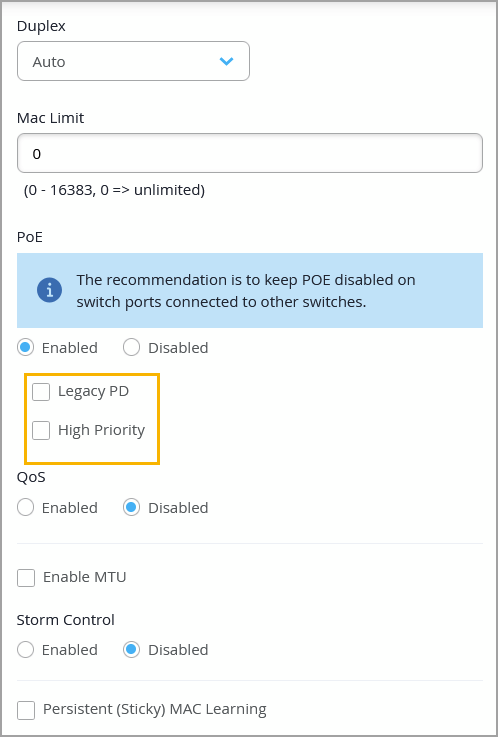
We have introduced the following enhancements to PoE configuration in Mist:
Legacy PD (or legacy powered device)—Starting in Junos OS Release 24.2R2, 24.4R1, and 23.4R2-S4, legacy powered devices (pre-802.3AF standard) are not detected for PoE by default in EX4400-24MP, EX4400-48MP, EX4400-48MXP, EX4400-48XP, EX4400-24P, and EX4400-48P switch models. To ensure that the legacy devices receive power, you need to enable the Legacy PD option on the PoE-enabled switch port via the associated port profile.
High Priority—This option designates a PoE-enabled interface as high priority for power allocation. You can configure this via port profiles. In scenarios where PoE demand exceeds the available power budget, the switch will maintain power on high-priority interfaces until all low-priority interfaces have been powered down.
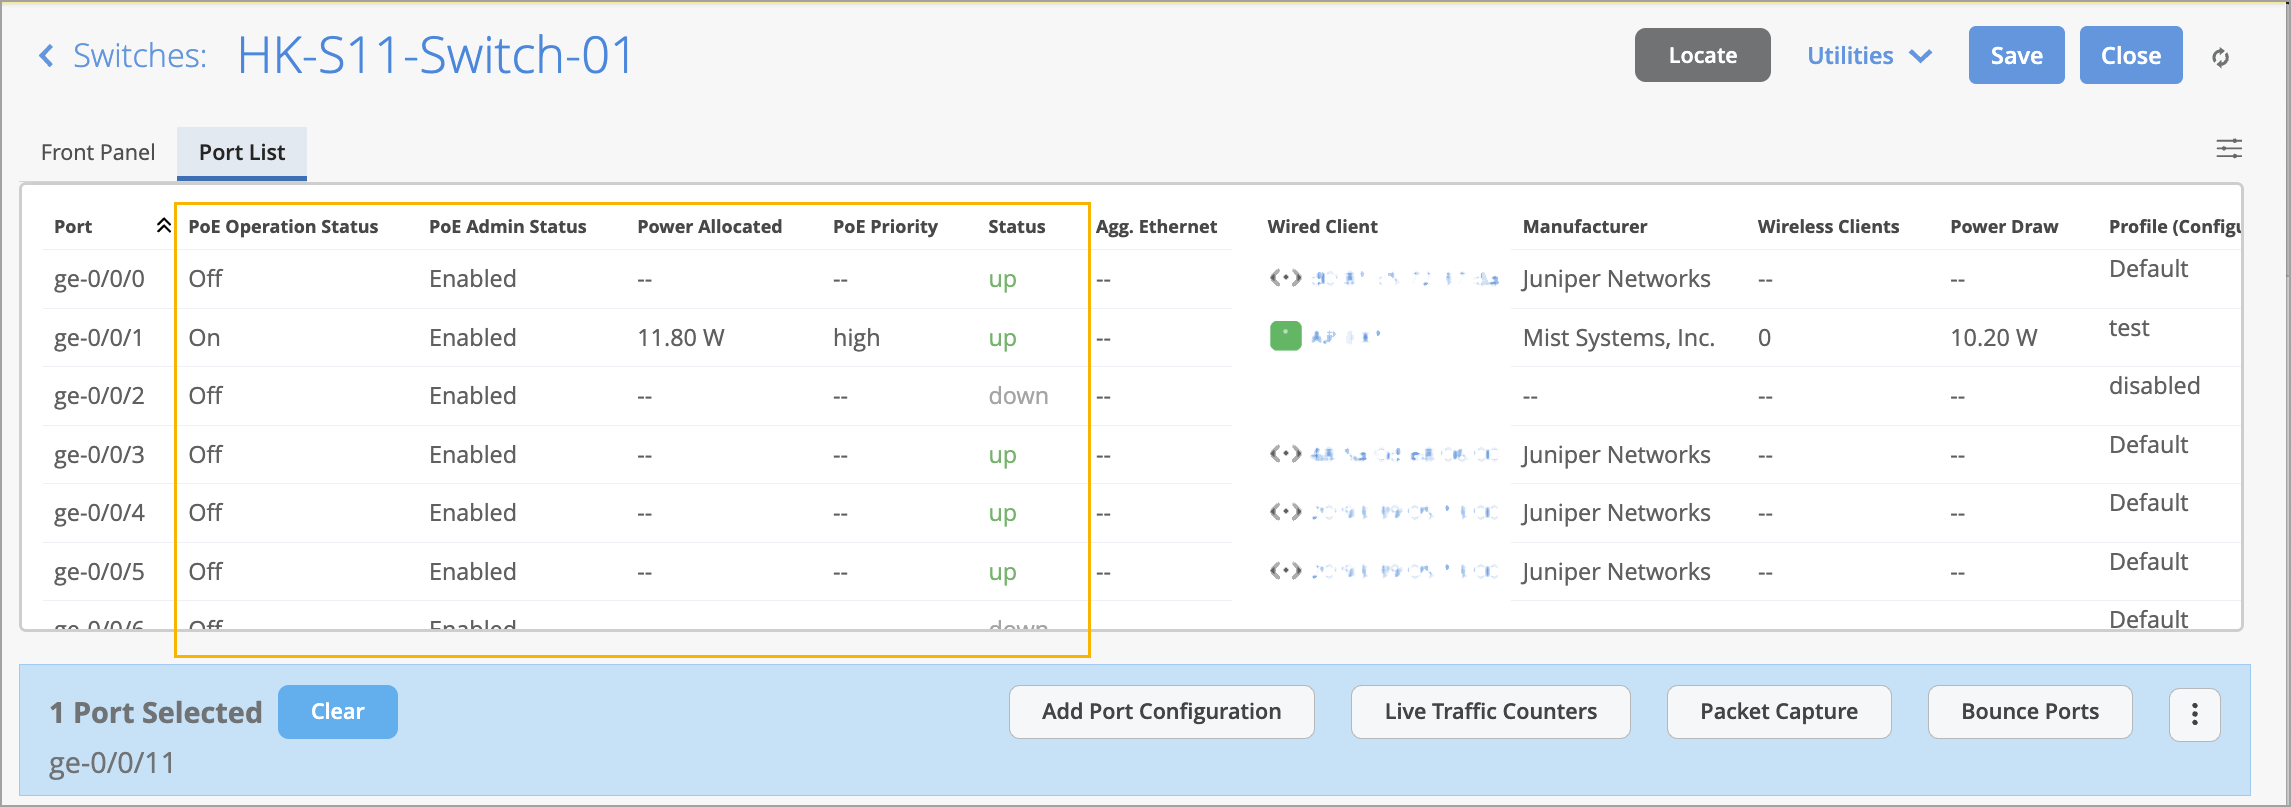
You can view PoE status information across multiple locations in Mist, including Switch Details (port hover view, port list, and port statistics tile), Wired Clients page, and Switch Insights (Switch Events).
The following key details are available on these pages:
PoE Operation Status—Shows if the connected powered device is receiving power from the PoE-enabled port.
PoE Admin Status—Indicates whether PoE is administratively enabled in the associated port profile.
Power Allocated—Displays the allocated power in watts (W).
PoE Priority—Indicates whether the PoE priority is set to high.
PoE Status—Shows the supported PoE standard (example: 802.3bt) when you hover over the PoE indicator on the right of the Front Panel section on the Switch Details page.
Reserved Power—This is the amount of power from the PoE power budget to be used in the case of a spike in PoE power consumption. This is displayed when you hover over the PoE indicator on the right of the Front Panel section on the Switch Details page.
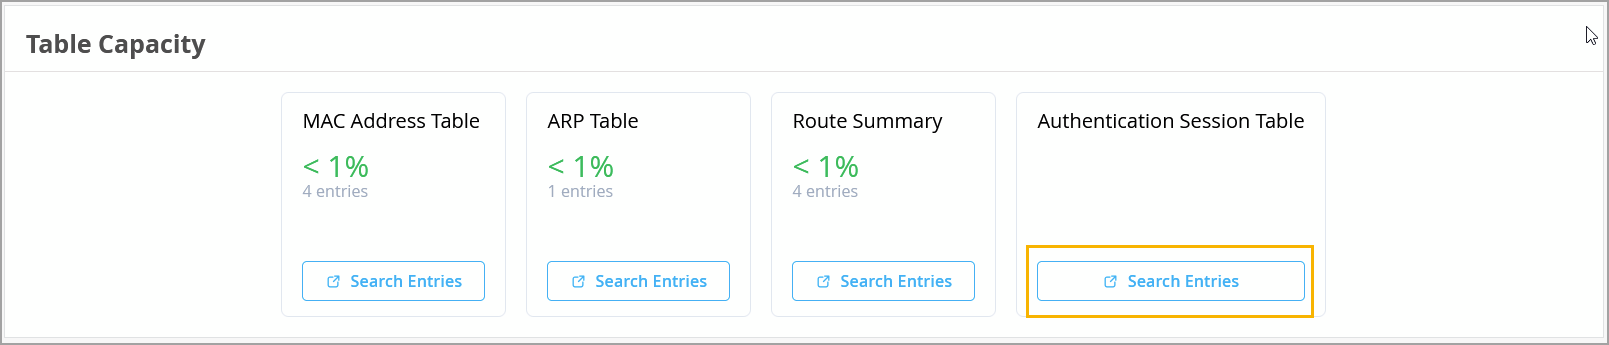
As an admin user, you now have quicker and more intuitive access to authentication information via Switch Insights. The new Authentication Session Table card located under Table Capacity in Switch Insights provides 802.1X (Dot1x) session details for either all switch ports or specific ports that you choose. This enhancement significantly improves operational visibility and streamlines troubleshooting workflows.
To view 802.1X (Dot1x) session details for switch ports, click Search Entries in the Authentication Session Table card. In the Search Entries window that appears, select the ports you want to inspect and then click Search to display the corresponding authentication session information.
You can now configure alerts for switch port loop events in Mist. This feature ensures that you are immediately notified when a loop occurs (such as when someone connects an endpoint incorrectly), helping you take quick corrective action.
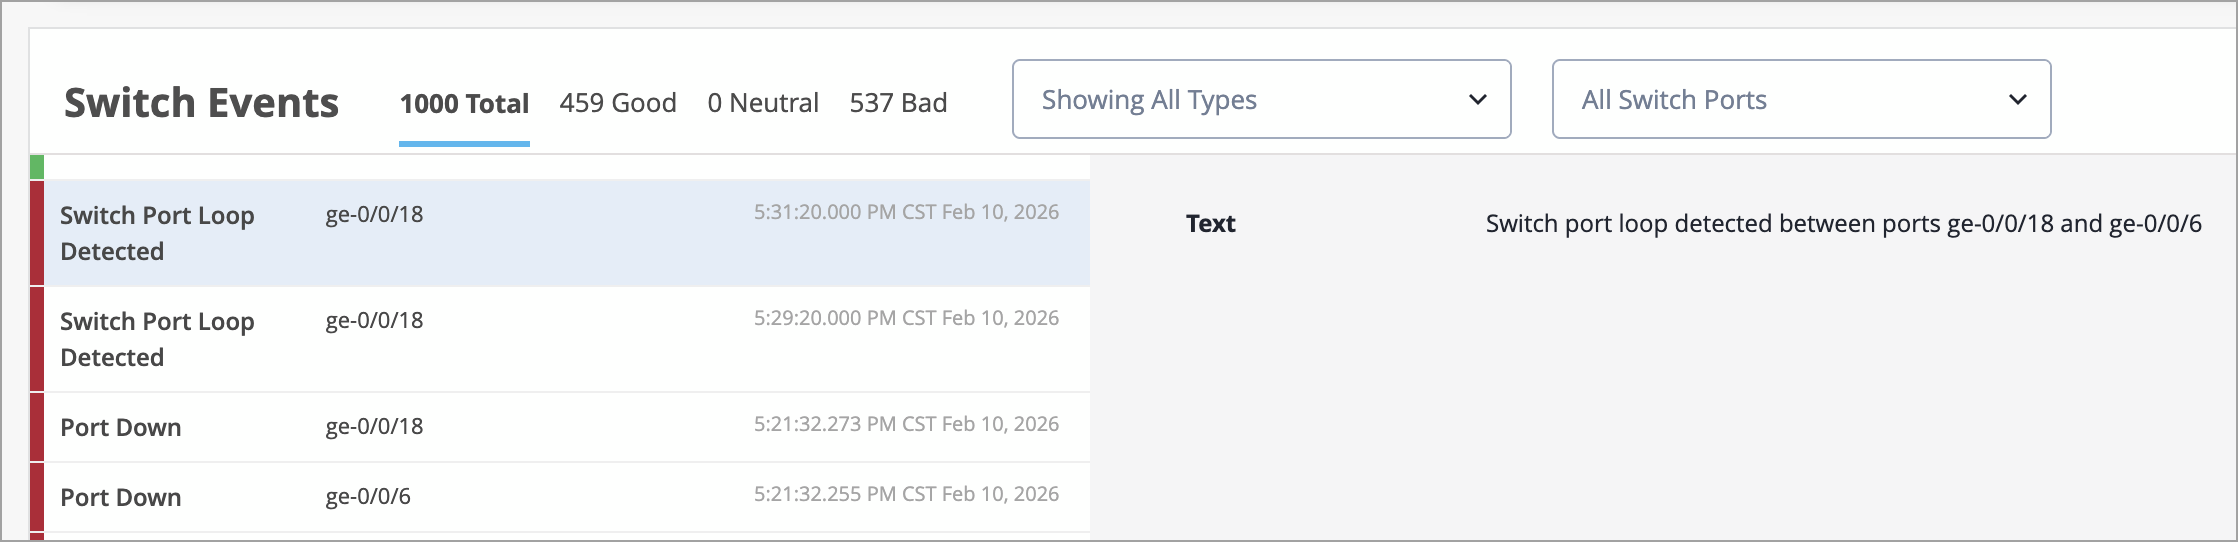
In addition, loop events are now searchable in Marvis, making root cause analysis faster and easier.
You can configure the alerts from the Monitor > Alerts page.
This enhancement reduces time and effort required to identify and resolve port loop events.
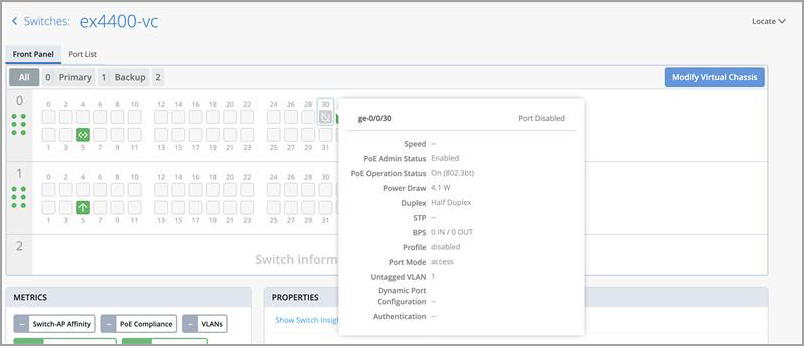
If a user administratively disables a switch port, the Front Panel section in the Switch Details displays that port with a greyed-out icon, indicating that it is disabled. This makes it easier to visually confirm which ports are disabled, improving the troubleshooting experience.
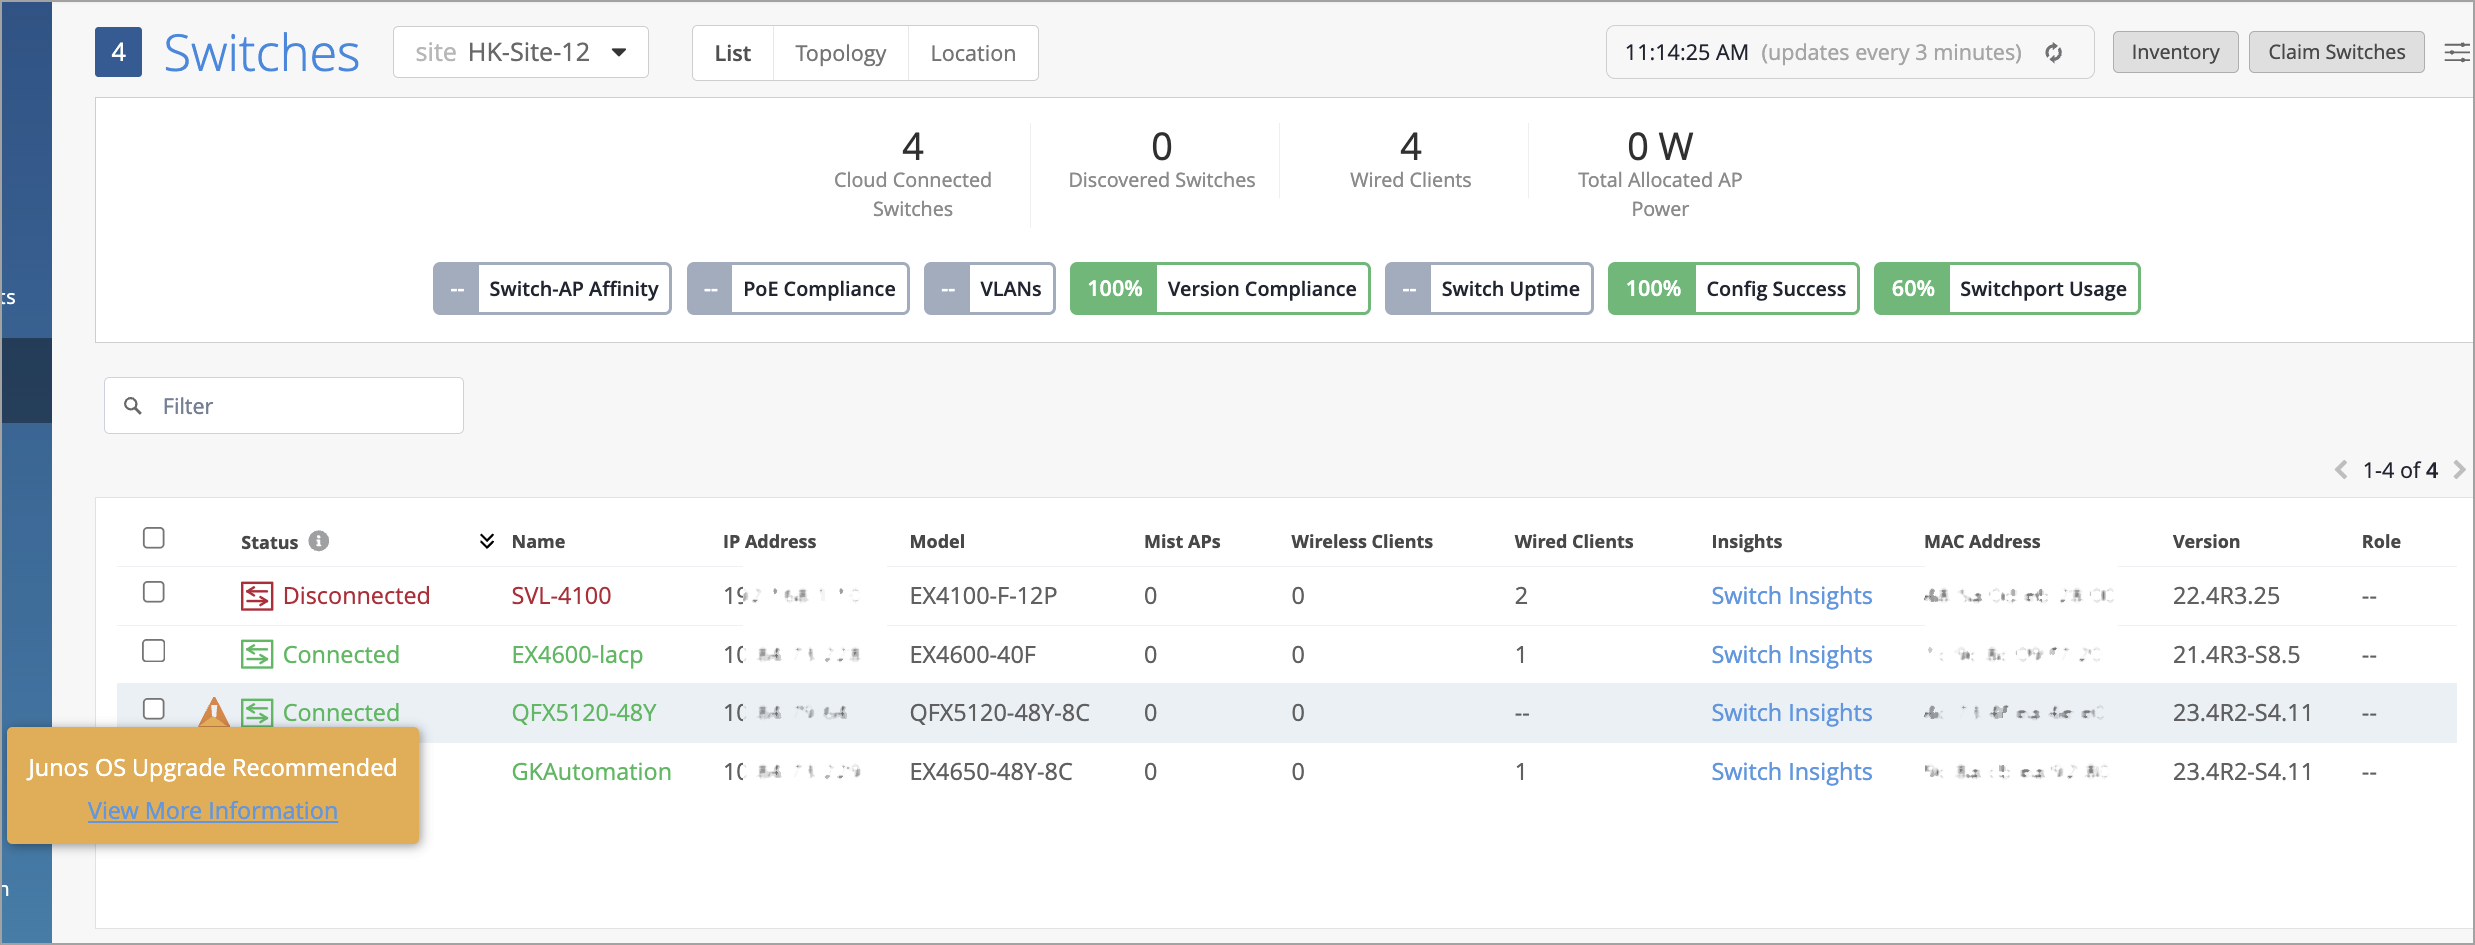
For EX4650 and QFX5120 switches that have the JMA (Junos Mist Agent) package installed and are running Junos OS version 23.4R2-S4, we recommend upgrading to Junos OS 23.4R2-S6.
This upgrade is important because, if a switch running Junos version 23.4R2-S4 with a JMA package reboots for any reason, the JMA service fails to start after the switch comes back online. This results in the switch losing connectivity to cloud. To know more about this issue, refer to PR1882472.
To help identify affected devices, the Switch List and Switch Details pages now display a warning for EX4650 and QFX5120 switches on Junos 23.4R2-S4 running a JMA package, indicating that an upgrade to Junos version 23.4R2-S6 is recommended.
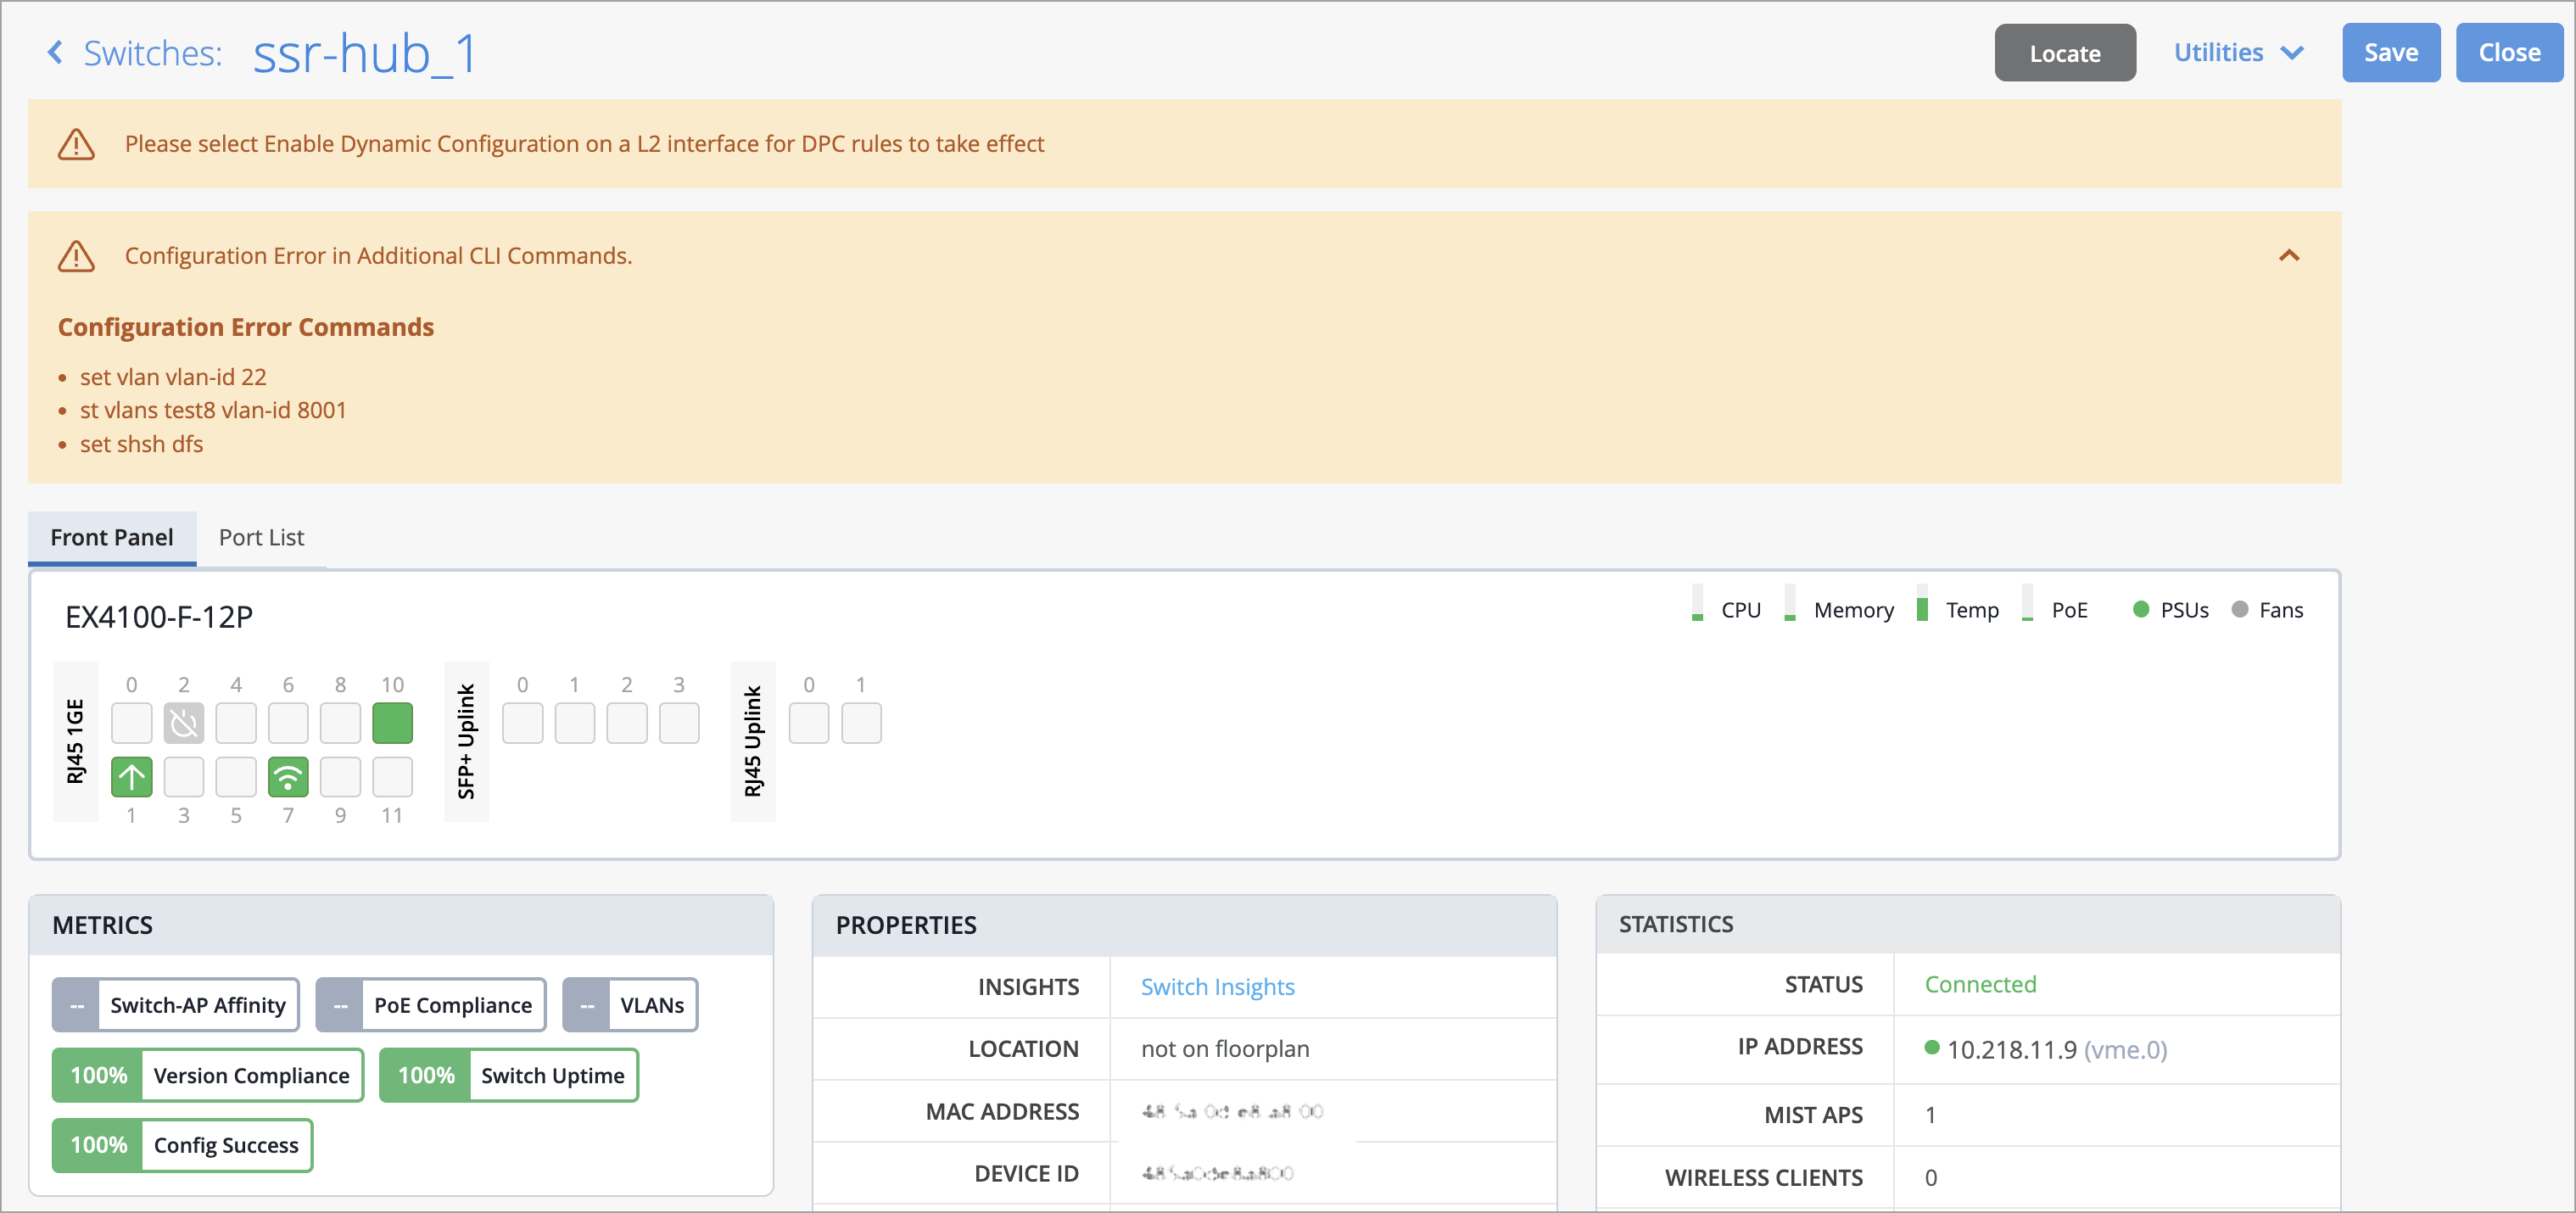
When switch configurations entered through Additional CLI Commands contain errors, a warning now appears directly on the switch details page (Switches > Switch Name). This enhancement gives administrators immediate visibility into configuration issues and simplifies troubleshooting. Previously, configuration errors were only recorded as events on the Switch Insights page, which meant users might not notice them unless they specifically navigated to that page.
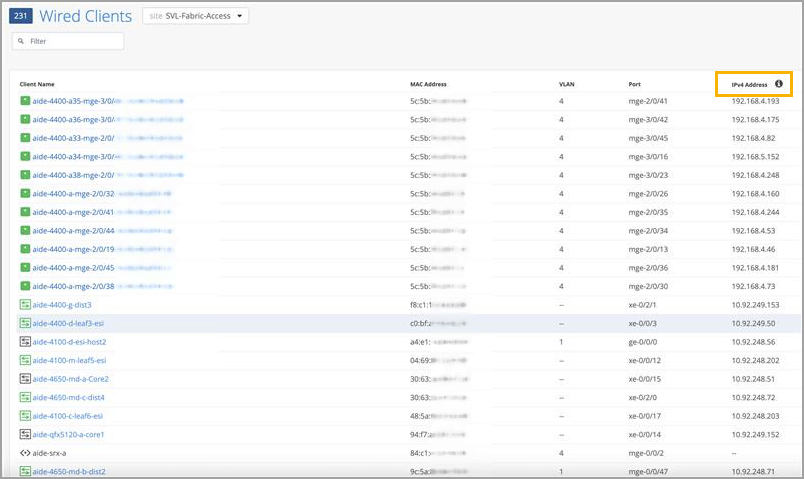
Mist now automatically enables the global MAC‑IP snooping feature (set protocols l2-learning global-mac-ip-snooping) on EX4000, EX4100, EX4400, EX4650, and QFX5120 switches running Junos OS 25.2R1 or later. This feature allows the switch to learn MAC‑to‑IP bindings for connected clients in VLANs where DHCP snooping is not enabled. To view MAC‑IP information in Mist, go to the Front Panel section on the Switch Details page, then hover over the switch port connected to the client. Mist also displays each client’s IP address and associated switch interface on the Wired Clients page for switches that have the JMA (Junos Mist Agent) package installed and are running Junos OS 25.2R1 or later.
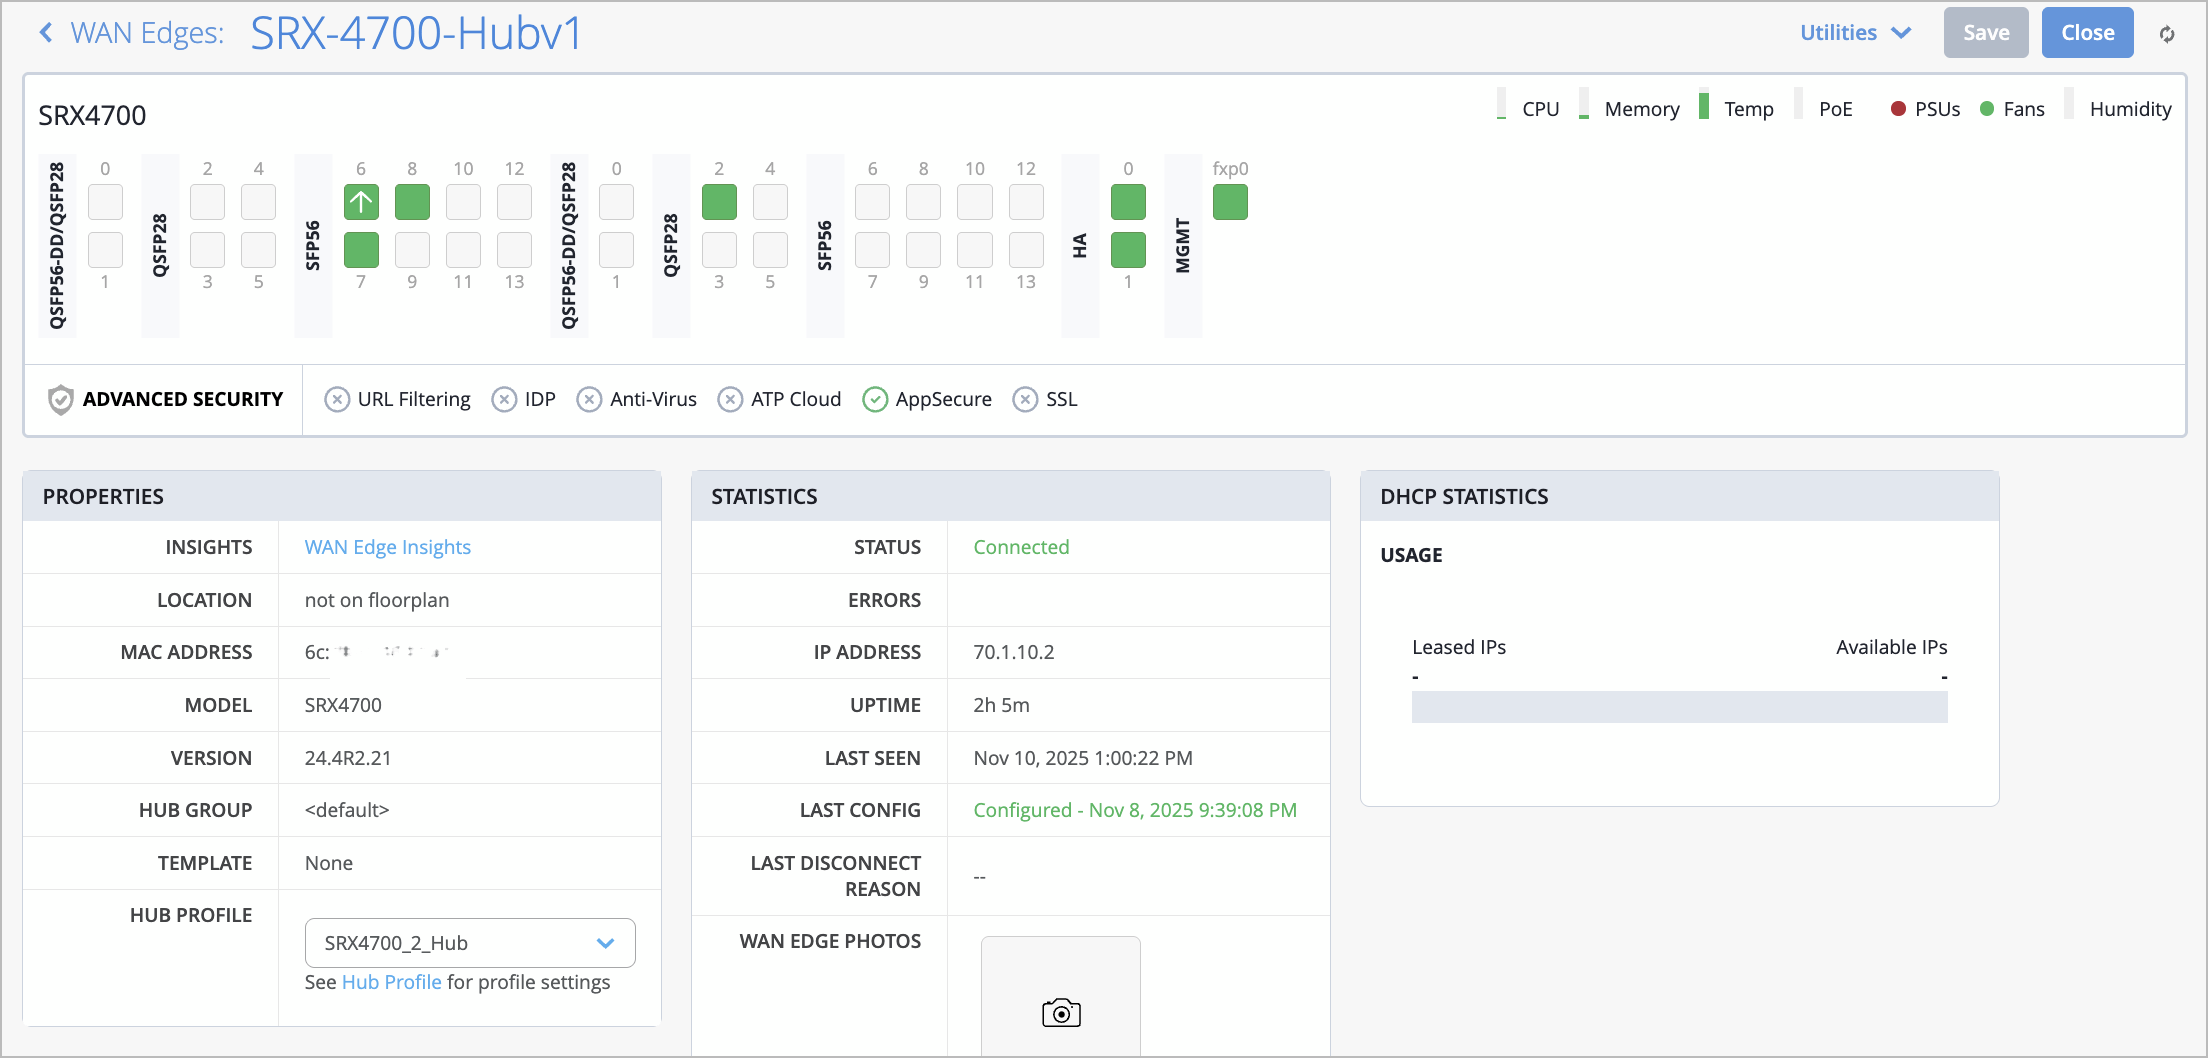
Juniper Mist WAN Assurance now supports the SRX4700 as a WAN Edge device.
WAN Assurance simplifies all aspects of WAN Edge device management that include device onboarding, configuration at scale, and monitoring and troubleshooting. With WAN Assurance, you can monitor your WAN in real time and gain full visibility into its health and performance. You can see how your WAN Edge devices are doing, check out service level expectations (SLE) metrics, and even get insights into the end user experiences, among other things.
Juniper Mist WAN Assurance now supports the SSR400 router as a WAN Edge device at the branch. This router supports various networking components such as SD-WAN, Wireless, and Wired capabilities. It provides centralized control via Mist WAN assurance to simplify day 0, day 1, and day 2 operations for secure SD-WAN. Unlike traditional branch rollouts that require multiple hardware components and manual provisioning, the SSR400 provides provisioning via the Mist cloud to accelerate setup.
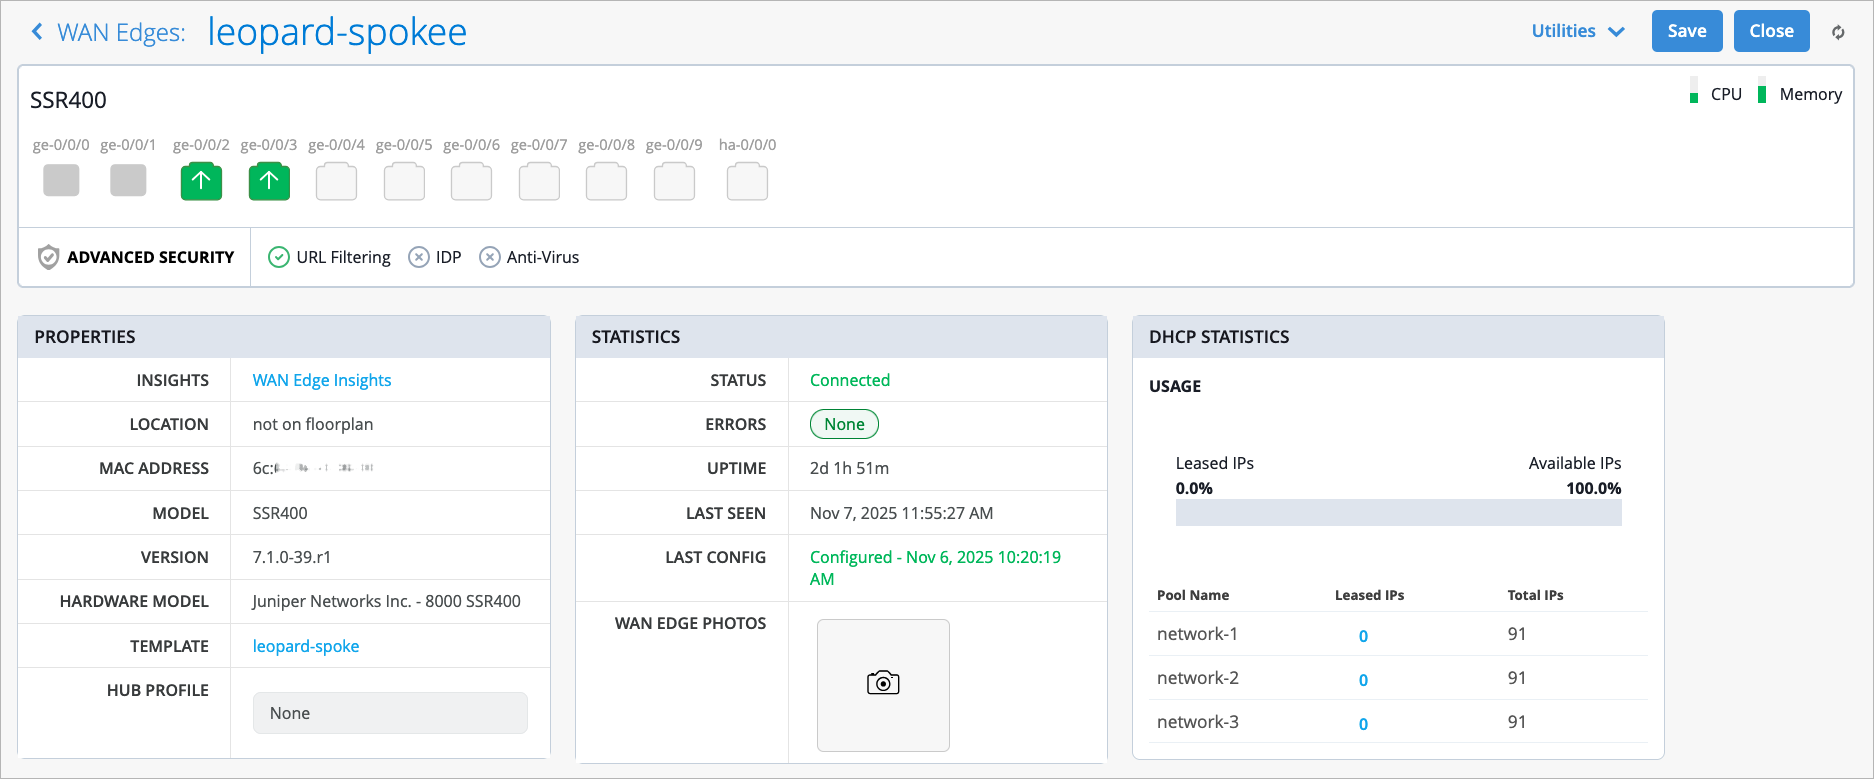
For more information, refer to SSR400 Line of Routers Datasheet.
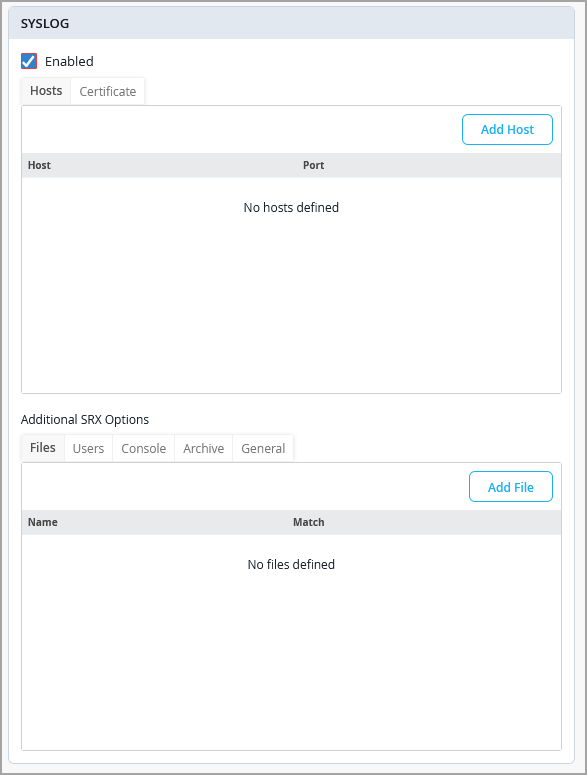
Mist now supports system log (syslog) configuration for WAN Edge devices. You can configure syslog from the WAN Edge details page (device-level configuration) and from the WAN Edge template (organization-level configuration).
Junos OS generates syslog messages to record events occurring on the device. The events could include routine operations, failures and error conditions, and emergency or critical conditions. You can seamlessly integrate the syslog data with third-party security platforms for centralized aggregation and analysis.
For WAN Edge devices, the syslog configuration includes the following capabilities:
Support for configuring multiple syslog servers.
Per-application policy logging control.
Ability to send syslog traffic using device-out policies, ensuring alignment with existing traffic steering configurations.
For SSR devices, only syslog hosts (external servers) and certificate authorities can be configured.
For SRX devices, additional parameters can be configured, including:
A named file in the local file system to store syslog messages matching specified criteria.
Specific users to receive syslog messages.
Types of log messages to capture.
Parameters for archiving system logs.
General settings such as time format, routing instance, and network interface.
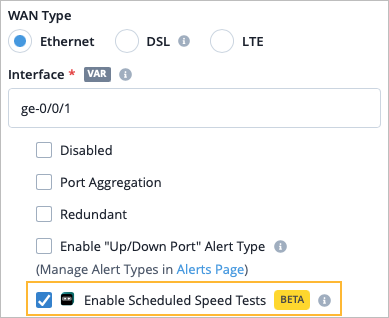
You can enable Marvis self-driving speed tests to run on the selected WAN interfaces automatically during low activity times. You can enable this in the WAN interface configuration at the WAN Edge template-level or the device-level. For Ethernet interfaces, the Enable Scheduled Speed Tests checkbox is selected by default.
In addition to your base WAN Assurance subscription, you need a Marvis for WAN subscription for each device you want to run Marvis self-driving speed tests on.
Marvis self-driving speed tests are available on the following platforms:
SRX1500, SRX1600, SRX2300, SRX4100, SRX4200, SRX4300, SRX4600, and SRX4700.
SSR120, SSR130, SSR1200, SSR1300, SSR1400, and SSR1500.
To ensure test accuracy, it is recommended that tests be run on hardware circuits 1Gbps and below.
NOTE: For any devices with built-in LTE interfaces, the Enable WAN Speed Test checkbox is unchecked by default. It is not recommended for devices with built in LTE to enable automatic WAN speed tests, as it can result in costliness if you pay for bandwidth usage through a service provider. However, if you have LTE interfaces connected to your Ethernet interfaces, such as on your Cradlepoint devices, you will need to deselect the Enable Scheduled Speed Tests checkbox from the Ethernet interface configuration.
If you enable the speed test at the device or template-level, you must also select the checkbox at the Org level by navigating to Organization > Settings > WAN Speed Test Scheduler. First, select the Enable radio button, then select the Enable Automatic Speed Test checkbox.
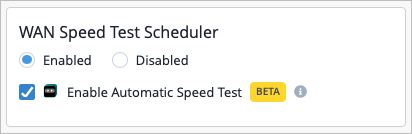
NOTE: Starting in January 2026, the checkbox at the organization level will be enabled by default for all organizations. Therefore, if you do not want to use the automatic speed test, it is recommended that you deselect this checkbox at the template-level or device-level now, as that configuration will override the org-level setting.
You can view the Speed Test results from the WAN Edge page or by navigating to Marvis > Marvis Minis and selecting WAN Speed Test from the drop-down menu at the top of the page.
If you have enabled speed tests, the results are incorporated into the Bandwidth Headroom classifier for the WAN Edge Bandwidth SLE. In this case, the headroom threshold is based on maximum usage statistics from the past two weeks, plus the results of the speed tests, if available.
To view the WAN Edge Bandwidth SLE, select Monitor > Service Levels, and then click the WAN button.
NOTE: To enable the scheduled speed tests, do the following tasks.
In the WAN settings for the WAN Edge template, hub profile, or WAN Edge device, enable scheduled speed tests.
In your organization settings, use the WAN Speed Test Scheduler to enable automatic speed tests and to set the schedule.
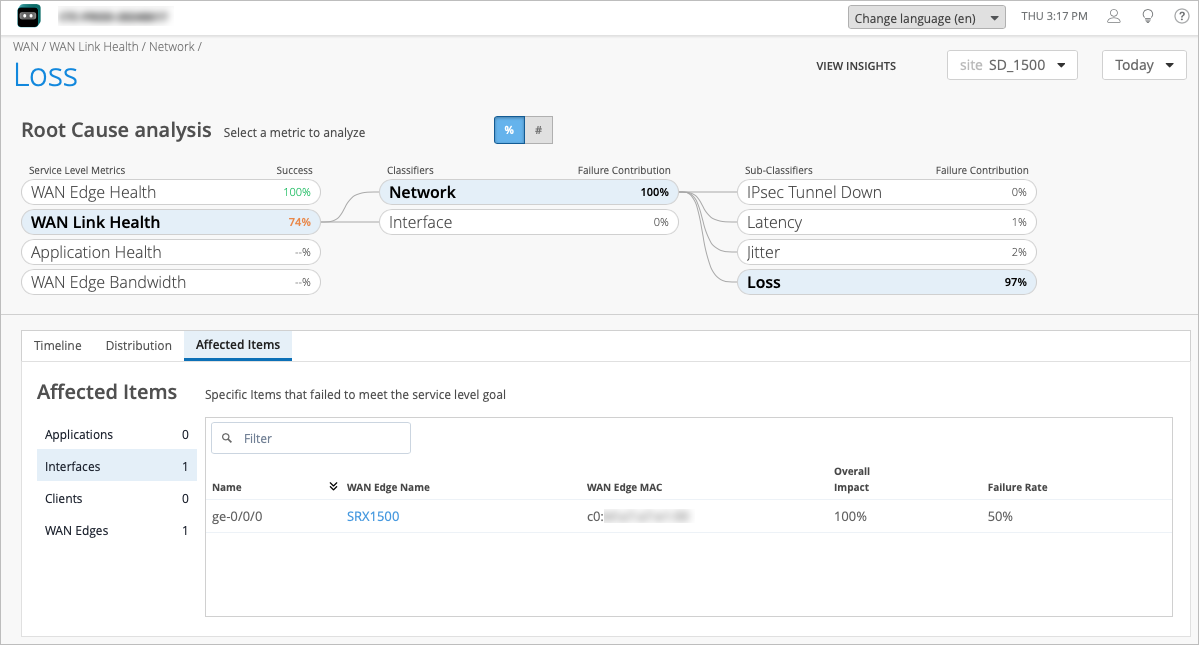
The Network classifier, which previously included Latency, IPSec Tunnel Down, and Jitter sub-classifiers, now also includes Loss. This sub-classifier is triggered when the WAN link loses packets.
The Interface classifier, which previously included Congestion, Cable Issues, and VPN sub-classifiers, now also includes two new sub-classifiers:
Port Down
Negotiation Incomplete (SRX Only)
To view the WAN Link Health SLE for your organization, go to Monitor > Service Levels, and then click the WAN button.
In this release we introduce support on WAN Edge devices for IPv6 in Mist. This includes WAN and LAN interface addresses, Application Policies that use IPv6 applications, and both NTP and DNS network addresses. You can use the Mist dashboard to configure the overlay, or the Mist API. On the WAN Edge Insights page, statistics are available for selected IPv6 events and properties. Note that you still need to connect to the Mist cloud via IPv4 on the WAN.
For more information, see: https://www.juniper.net/documentation/us/en/software/mist/mist-wan/topics/topic-map/general-wan-edge-config.html#concept_ycx_snk_fgc.
When onboarding standalone SRX WAN Edge devices to a site in your Mist cloud organization, you can have Mist automatically upgrade the Junos OS to a specified release.
Click Organization | Admin > Settings and then scroll down to the Firmware Upgrade tile.
Select the WAN Edge tab and then Enable Auto Upgrade. The WAN Edge Auto Upgrade Settings screen appears, as shown below.
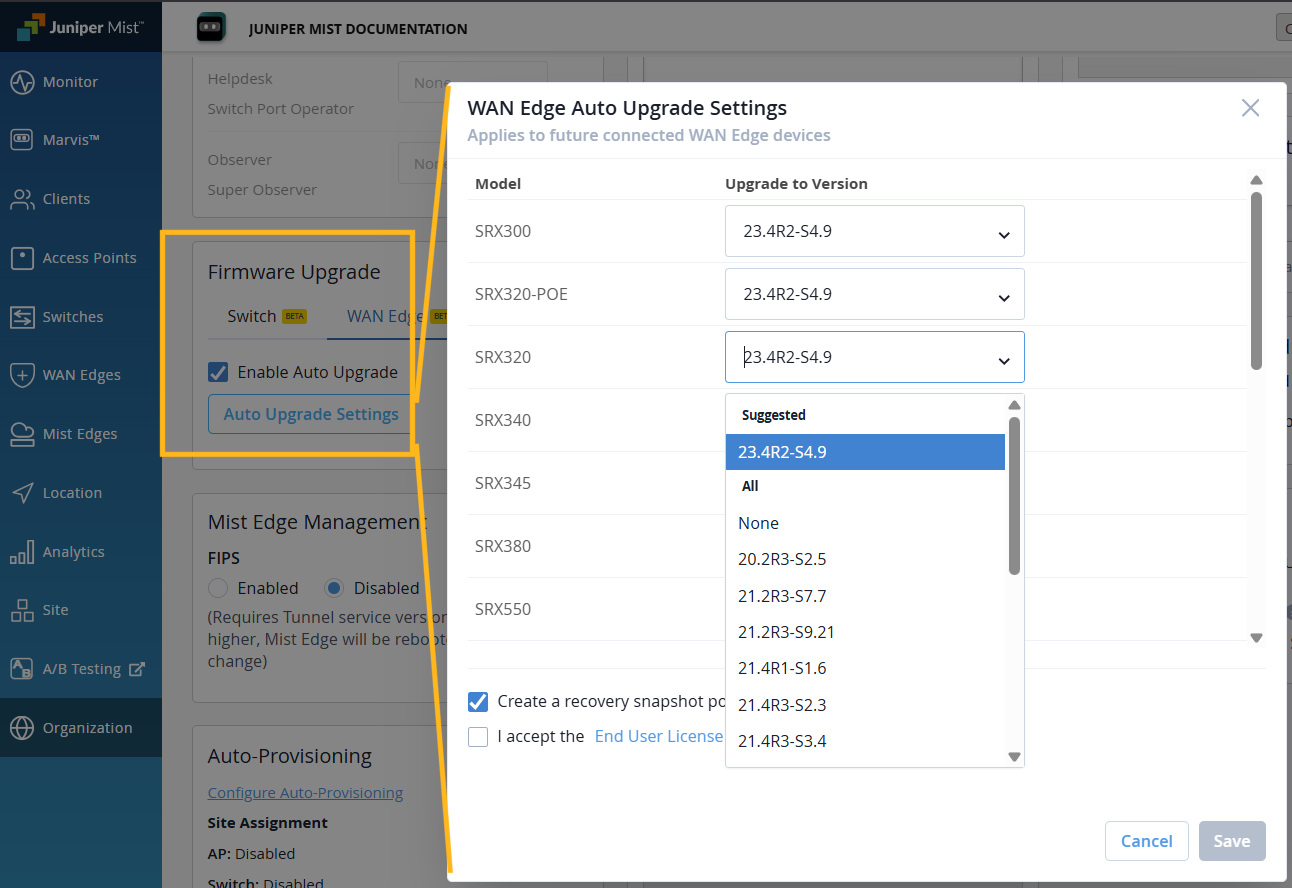
From the list of all SRX models, select those that you have in your WAN Edge inventory, and specify the Junos version you want the device to run.
Read and accept the End User License, and then click Save to apply your settings.
Although it is optional, we recommend that you also create a recovery snapshot of the upgraded system.
Once the SRX is added to a site and connected to the cloud, Mist will trigger the Junos upgrade to the specified version. Only devices in the WAN Edge inventory are eligible for upgrades during onboarding. In other words, if the SRX already belongs to a site or is already online and managed by Mist, it will not trigger an upgrade even if it is a matching SRX model.
We are excited to introduce secure conductor onboarding support for Session Smart Routers (SSR). This enhancement allows customers to onboard SSR devices to a Session Smart Conductor securely and automatically using Mist as the control point.
The secure conductor onboarding relies on an endorsement key (EK) associated with each router, a secure onboarding token generated by the conductor, and a WebSocket‑based secure channel over ports 930 and 933.
The onboarding steps include the following at a high level:
Onboard the SSR device to Mist using the Adopt workflow.
From Mist, obtain an endorsement key (a device ID token) for the SSR via the API: PUT /api/v1/orgs/<org_id>/ssr/export_idtokens. Be sure to include the router’s MAC address in the request.
On the conductor, configure the router details (such as the router ID and the endorsement key), and generate a secure onboarding token which will later be configured in Mist.
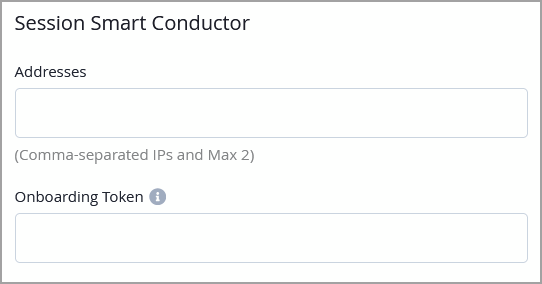
In the Mist portal, configure the conductor’s public IP address and the onboarding token in the Session Smart Conductor section under WAN Edges in the site configuration.
Assign the SSR to the site which you configured in the previous step. This triggers the secure onboarding workflow between router and Conductor.
Note: This feature is supported only on SSR 4xx‑series hardware and on virtual appliances that provide TPM 2.0 support, such as AWS and Azure instances with vTPM enabled.
To verify the onboarding status, use these commands on the conductor:
show secure-conductor-onboarding <router>
show assets <router>
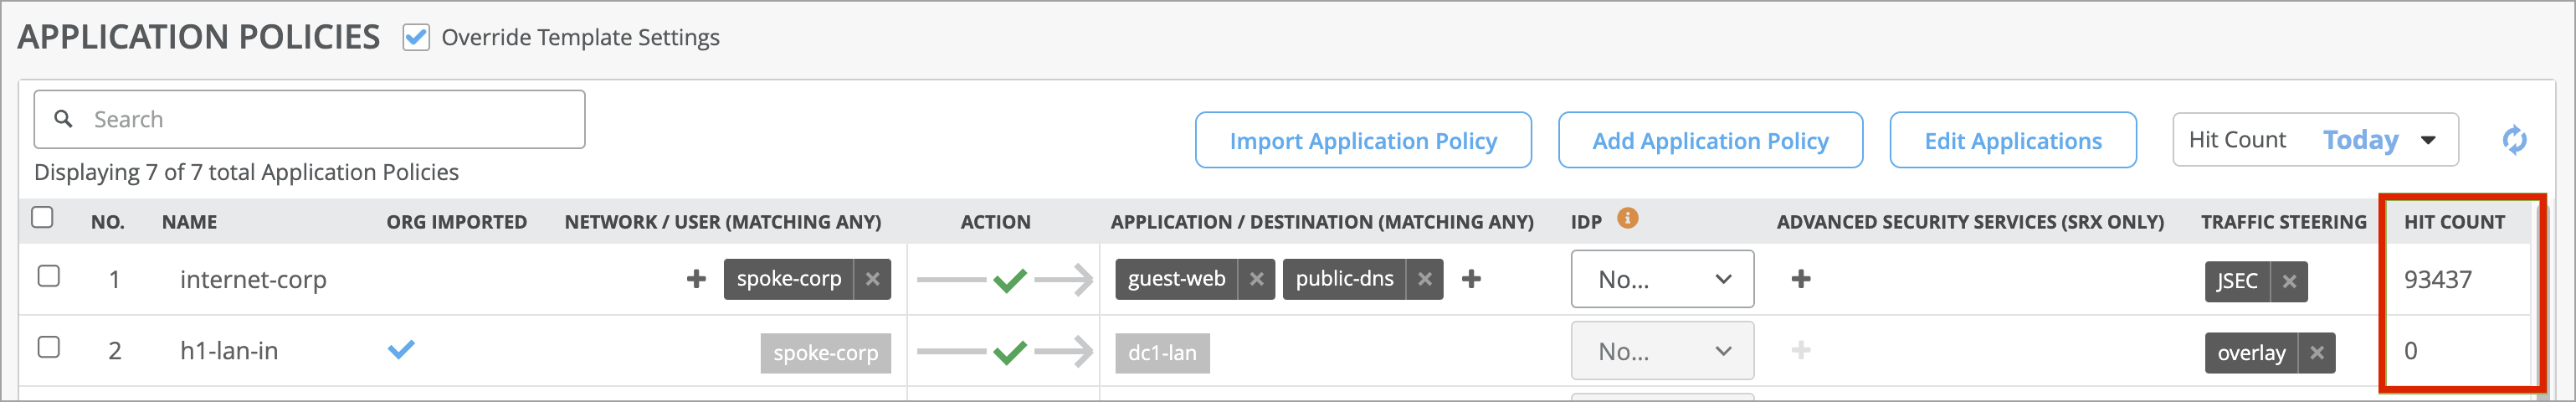
The Application Policy section on the WAN Edge device page now displays the policy hit count for SSR devices. The hit count is available only for the SSR devices running software version 7.x.x and later. The hit count indicates the number of times an application policy rule has been triggered (matched) by traffic. This feature is already available for SRX Series firewalls.
Mist now supports alert dampening for the following WAN Edge events:
WAN Edge Offline
WAN Edge BGP Neighbor Down
VPN Peer Down
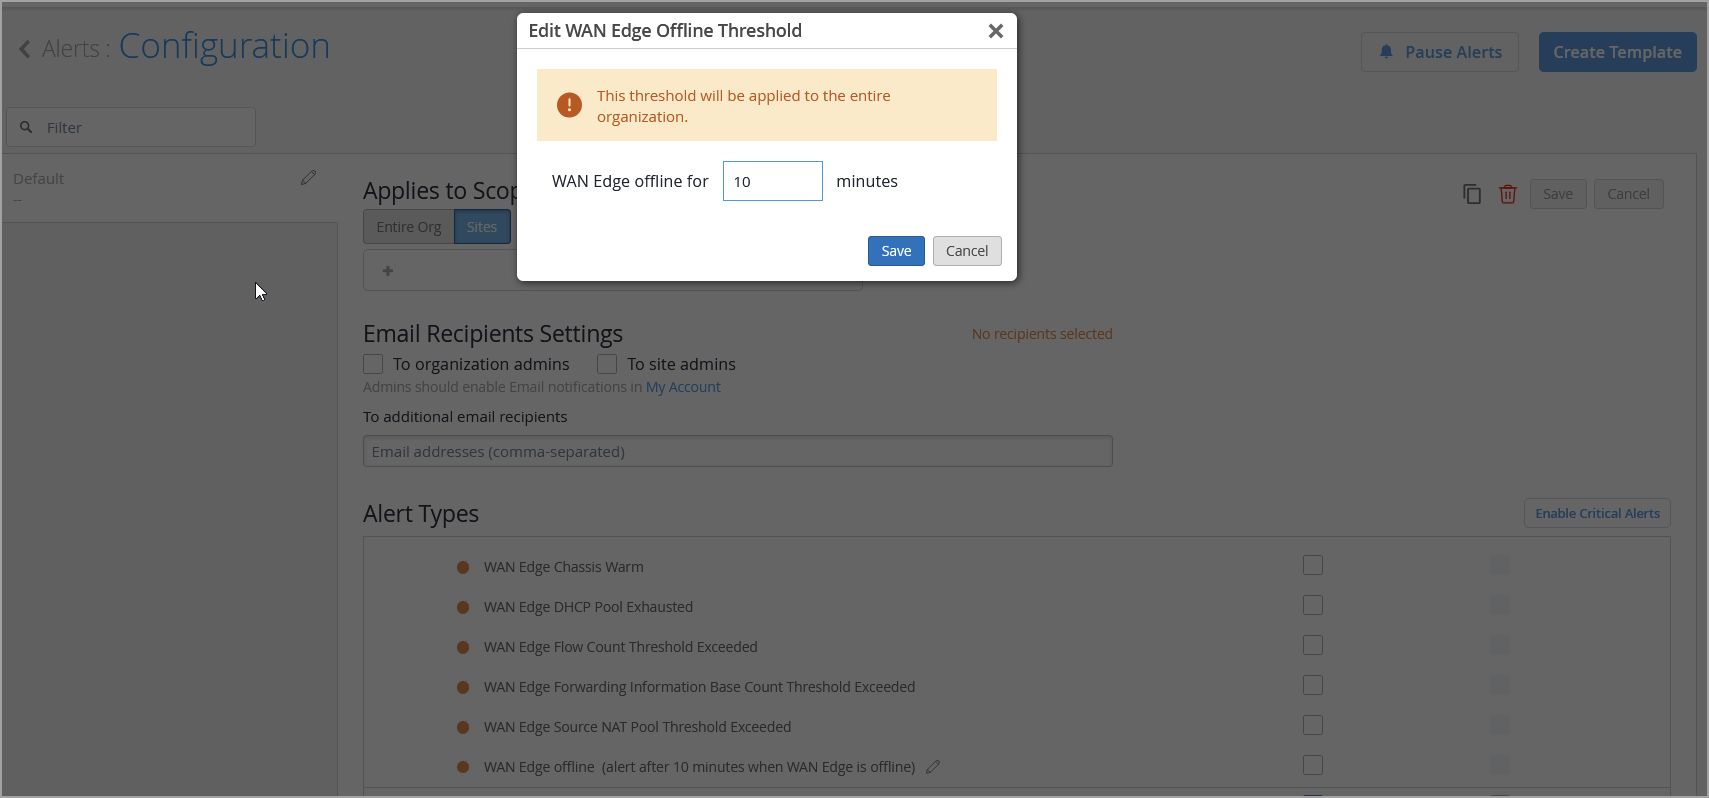
You can enable alert dampening by configuring a time‑based threshold (in minutes) that determines when a DOWN alert should be triggered. If the device recovers before the threshold expires, the DOWN event is automatically suppressed.
To configure alert dampening:
Go to Monitor > Alerts > Alerts Configuration.
Click the pencil icon next to the alert name. This icon is available only for those events that support alert dampening.
Configure the thresholds and any additional settings, then save the configuration.
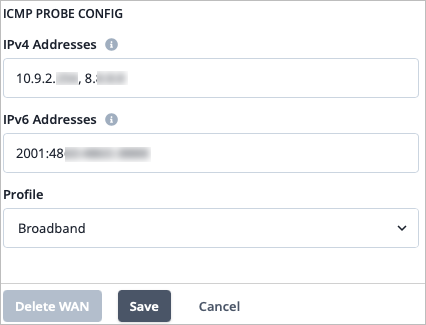
You can now configure real-time performance monitoring (RPM) probes for the IPv4 and IPv6 underlays on your WAN Edge devices for the purpose of monitoring WAN link health. Mist has added an ICMP Probe Config section within the WAN configuration, where you can configure custom IPv4 and IPv6 probes and their associated profiles. This allows you to enter the IP address of any device that you want to ping for WAN link health. You can enter multiple IP addresses separated by a comma.
We previously introduced a new Sub-Classifier of Loss for the WAN Link Health SLE. You can view the Loss for your customized probes in the WAN Link Health SLE for your organization by navigating to Monitor > Service Levels, and then click the WAN button. The Network classifier contains sub-classifiers, such as Loss, which is triggered when the WAN link loses packets. You can click on the Loss sub-classifier to see more detailed information, such as the interface that the loss is occurring on.
For easier monitoring and troubleshooting of Mist Edge devices, we have introduced new Mist Edge alerts that will keep you informed about critical system events.
Here are the Mist Edge events which will now trigger alerts:
Mist Edge Upgrade completed
Mist Edge Upgrade failed
Mist Edge Restarted
Primary RADIUS server unresponsive
Configuration apply failed (Mist Edge misconfigured)
You can view these alerts on the Monitor > Alerts page on the Mist portal.
For enhanced visibility into RADIUS server behavior in the context of Mist Edges, we have added the following two events to Mist Edge Insights:
Primary Radius Server unresponsive—Triggered when the designated primary RADIUS server fails to respond.
Primary Radius Server changed—Triggered when the system switches to the next RADIUS server on the list.

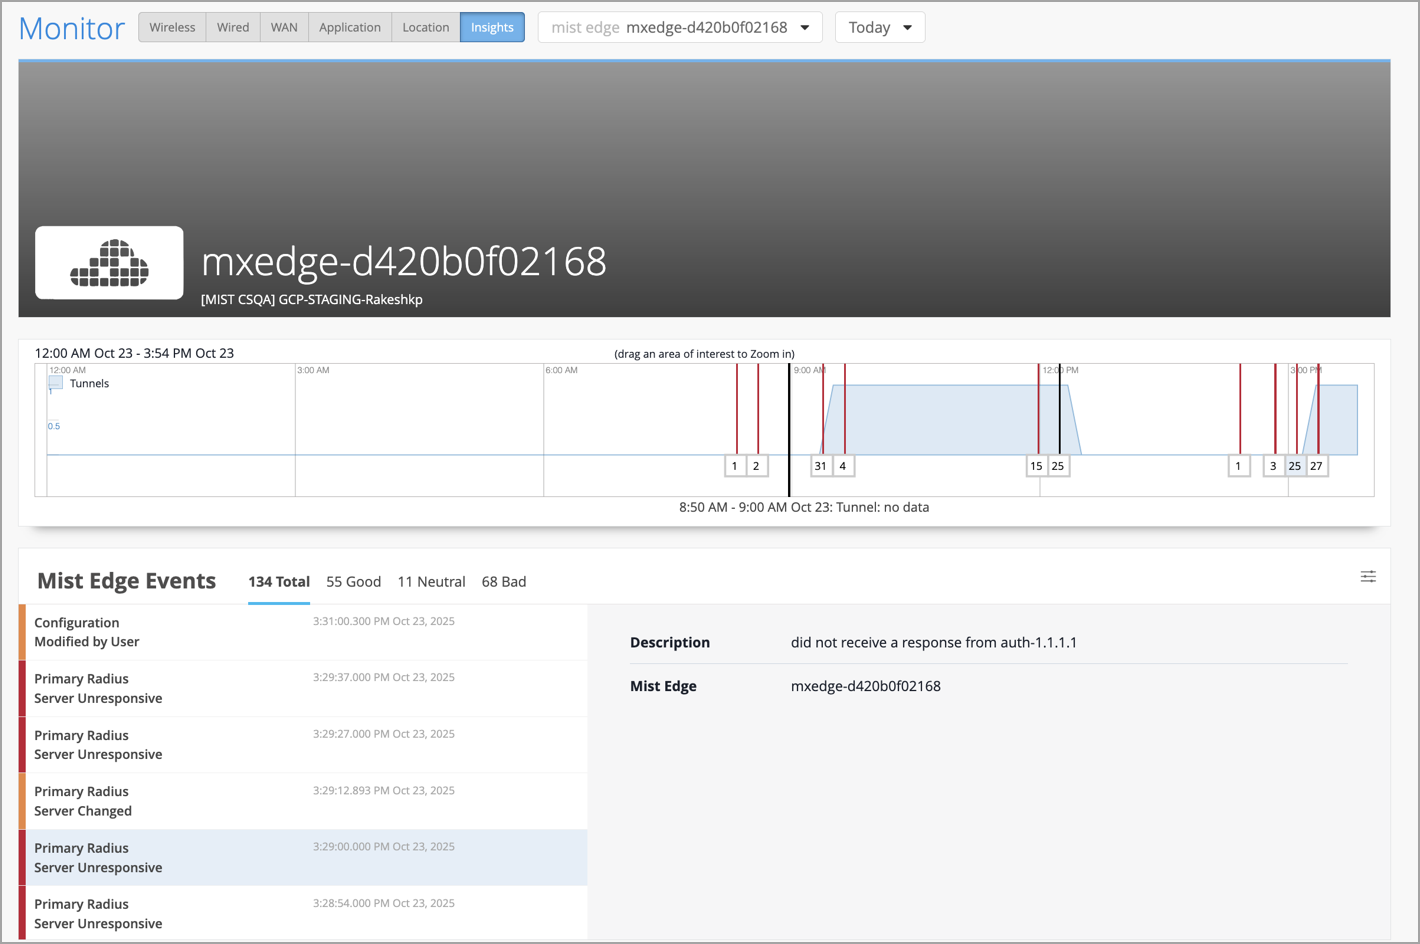
These enhancements enable network administrators to detect and resolve authentication-related issues faster.
We have enhanced the WebSocket capabilities of Juniper Mist to support real-time telemetry for Mist Edge devices. This enhancement will provide our customers access to detailed telemetry data that includes:
mxagent-stats: CPU usage, memory stats, IP configuration, service status, and system uptime.
tunterm-stats: Tunnel statistics, port metrics, VLAN activity, and LLDP details.
These updates enable customers to monitor Mist Edge performance and health more effectively in real time.
The JSI Support Insights page has been removed and its content has been re-organized as follows:
The hardware and software EoX milestones, along with additional enhancements, are moved into Organization > Admin > Inventory > Installed Base view. The Installed Base view now provides you a unified view of the Juniper assets linked to your organization, hardware and software lifecycle milestones, and contract status of your assets. See also: View Juniper Support Insights (JSI) for Your Installed Base. See also: View Juniper Support Insights (JSI) for Your Installed Base.
In upcoming releases, the remaining Support Insights content, such as contract information, SIRT advisories (security vulnerabilities), and PBN (bug notifications) will be further reorganized to dedicated sections under Organization.
Juniper Mist Location Services now supports automatic generation of geofence or Inclusion Zone for floor plan boundaries. This feature prevents tracked entities from appearing outside the building due to XY-coordinate estimation errors.
With automatic inclusion zone support on the floor plan image perimeter, when you upload a new floorplan to the Mist Location Live View, the system automatically detects the building outline and creates an Inclusion Zone—a virtual boundary that ensures location estimates stay within the building. Existing floorplans are not impacted. For existing deployments, you can use the Re-run Geo-Fence option to refresh zone boundaries without a full site reconfiguration.
Geofencing helps you ensure that a user is within your facility or coverage area before offering them service. This feature supports tracking the following entities:
Connected Wi-Fi Clients
Named Assets
SDK Clients
BLE (Bluetooth)
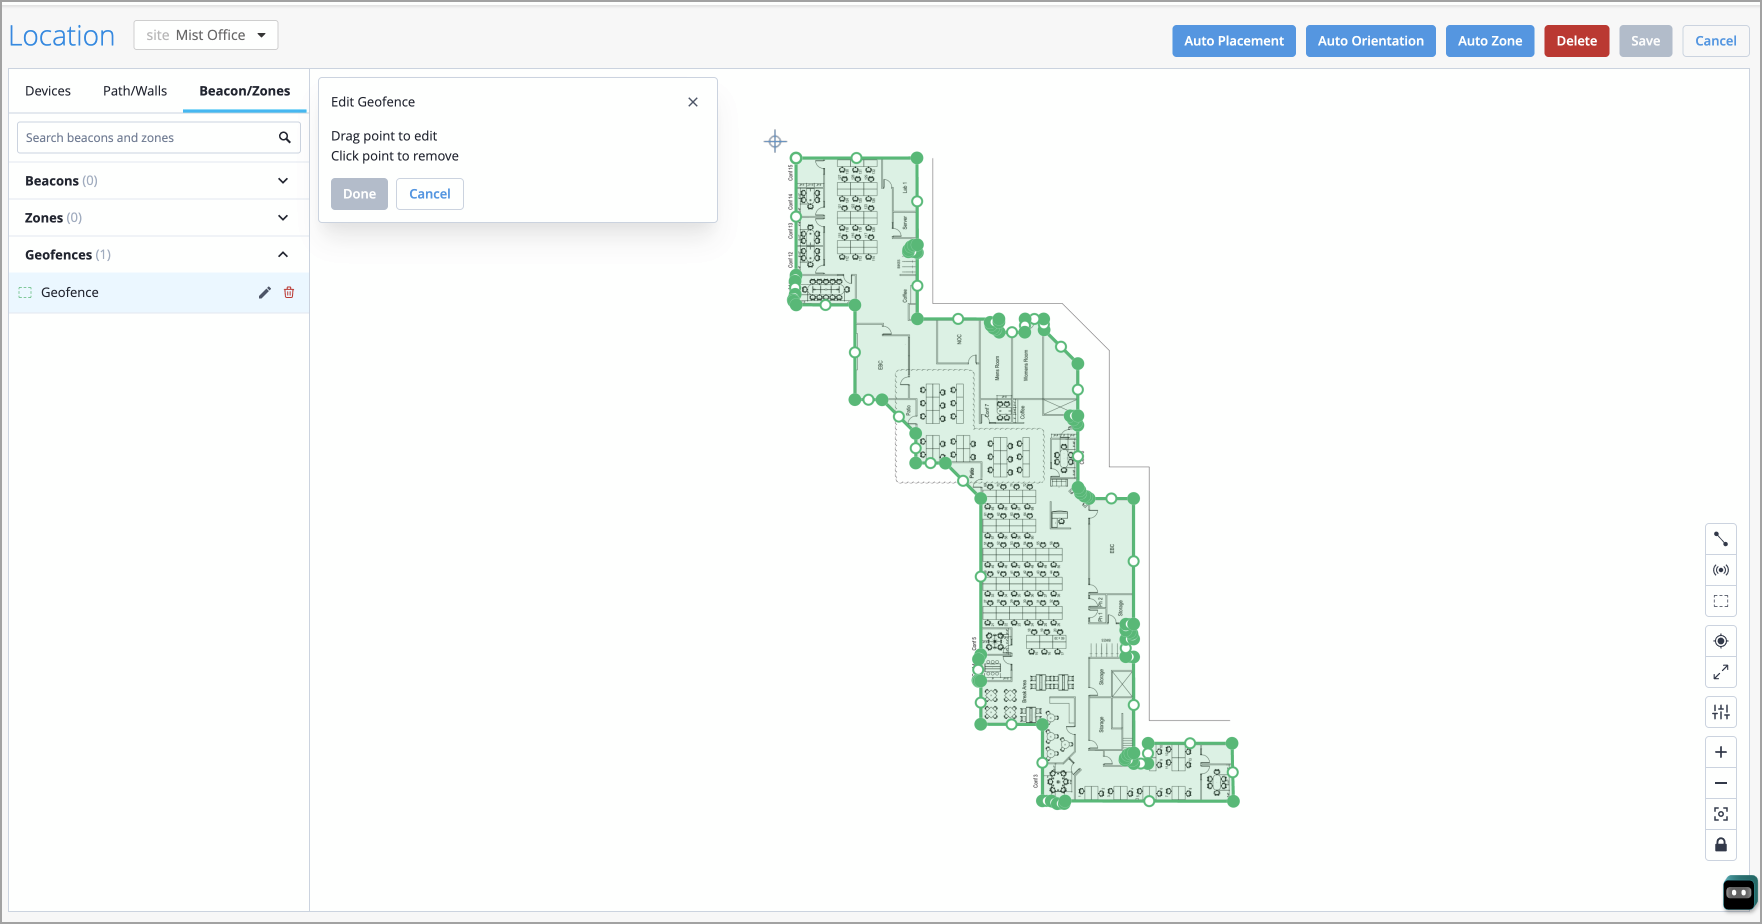
It is important to note that you do not need to save your inclusion zones, as any Geo-fencing you or the system generate will be automatically saved. However, any edits made to the Geofence after the fact must be saved.
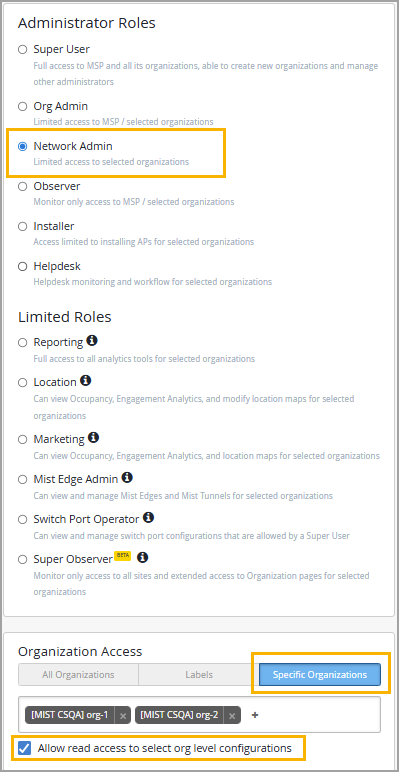
We have added support for the Network Admin role with specific organization scope to the Mist Managed Service Provider (MSP) portal. This role provides write access to all site-level pages for the selected organizations and optional read-only access to organization-level pages. Support for assigning access at the following scopes is not currently available: All Organizations and Labels.
The new role is available for selection when you invite new admin users. When you invite a user with Network Admin role, you can select one or more organizations to grant the user write access to the site-level pages within the selected organization. Optionally, you can select the Allow read access to select org level configurations check box to grant the user read access to certain organization-level pages.
Currently, the following API requests return an unpaginated, full list of inventory devices.
GET /api/v1/orgs/:org_id/inventory
GET /api/v1/sites/:site_id/stats/devices
Starting in early 2026, these API requests will fetch paginated responses to limit the size of the response. By default, the API response will fetch the first 100 entries in the list. You can modify the number of entries in the response (range: 1 to 1000) by using the query parameter 'limit'.
Currently, if you query this API directly when you have more than 100 devices in your organization inventory, we recommend that you update the scripts to handle the paginated responses.
For more information, see Pagination.
To enhance security and align with industry best practices, we will deprecate Basic Authentication for all use cases—including admin logins and scripts—effective September 2026. Before September 2026, all integrations must transition to token-based authentication to ensure uninterrupted access and support.
Why we are making this change
Basic authentication poses several security risks:
No multi-factor authentication (MFA) support
Credentials transmitted with every request (even over HTTPS)
No scope limitations
Vulnerable to credential theft and reuse
Industry security organizations (OWASP, NIST, CIS) strongly recommend token-based authentication as a more secure alternative.
Required actions
Before September 2026, do the following:
Update all applications and integrations to use token-based authentication.
Remove basic authentication from your implementations.
Migration resources
Documentation: Mist API Tokens
Support: Contact us at support@mist.com for assistance
The following API endpoints will be deprecated in an upcoming release:
:site_id/sle/:scope/:scope_id/metric/:metric/summary
:site_id/sle/:scope/:scope_id/metric/:metric/classifier/:classifier/summary
To replace these, we will be introducing the following new endpoints:
:site_id/sle/:scope/:scope_id/metric/:metric/summary-trend
:site_id/sle/:scope/:scope_id/metric/:metric/classifier/:classifier/summary-trend
managed and disable_auto_config attributes deprecatedTo simplify device management in the Mist API, we have deprecated the following two attributes in the device configuration object (/api/v1/sites/{site_id}/devices/{device_id}), effective January 2026:
managed—Previously used for adopted switches to indicate if they were managed by Mist (default: false). Setting this to true enabled Mist management for adopted switches.
disable_auto_config—Previously used to disable the default behavior of cloud-ready switches being managed by Mist. Setting this to true meant the device would not be managed by Mist.
We have also merged these two attributes into mist_configured, as shown below:
mist_configured: true—Configures the device to be managed by Mist.
mist_configured: false—Means that Mist does not manage the device.
During the transition, the GET /api/v1/sites/{site_id}/devices/{device_id} object will return mist_configured: true/false along with managed (for adopted devices) and disable_auto_config (for claimed devices) for backward compatibility.
Please update your integrations to use mist_configured going forward.