ON THIS PAGE
Multinode High Availability Monitoring Options
Monitoring Types
A high availability failure detection monitors both system, software, and hardware for internal failures. The system can also monitor network connectivity problems or link connectivity using interface monitoring, BFD path monitoring and IP monitoring to detect reachability of targets further away.
Table 1 provides details on different monitoring types used in Multinode High Availability.
| Montitoring Type | What is Does | Detection Type | Scope |
|---|---|---|---|
| BFD Monitoring | Monitors reachability to the next hop by examining the link layer along with the actual link. |
|
|
| IP monitoring |
Monitors the connectivity to hosts or services located beyond directly connected interfaces or next-hops. |
|
|
| Interface monitoring |
Examines whether the link layer is operational or not. |
Link failures |
|
In Multinode High Availability, when monitoring detects a connectivity failure to a host or service, it marks the affected path as down/unavailable, and marks the corresponding Service Route Groups (SRGs) at the impacted node as Ineligible. The affected SRGs will transition in a stateful manner to the other node without causing any disruption to traffic.
To prevent any traffic from being lost, Multinode High Availability takes following precautions:
- Layer 3 mode—Routes will be redrawn so that the traffic is redirected correctly
- Default gateway or hybrid mode—The new active node for the SRG sends a GARP (Gratuitous ARP) to the connected switch to ensure the re-routing of traffic
Multinode High Availability Failure Scenarios
The following sections describe possible failure scenarios: how a failure is detected, what recovery action to take, and if applicable, the impact on the system caused by the failure.Node Failure
Hardware Failure
- Cause—A failed hardware component or an environmental issue such as a power failure.
-
Detection— In Multinode High Availability
- Affected device/node not accessible
- SRG1 status changes to
INELIGIBLEon the node with hardware failure.
-
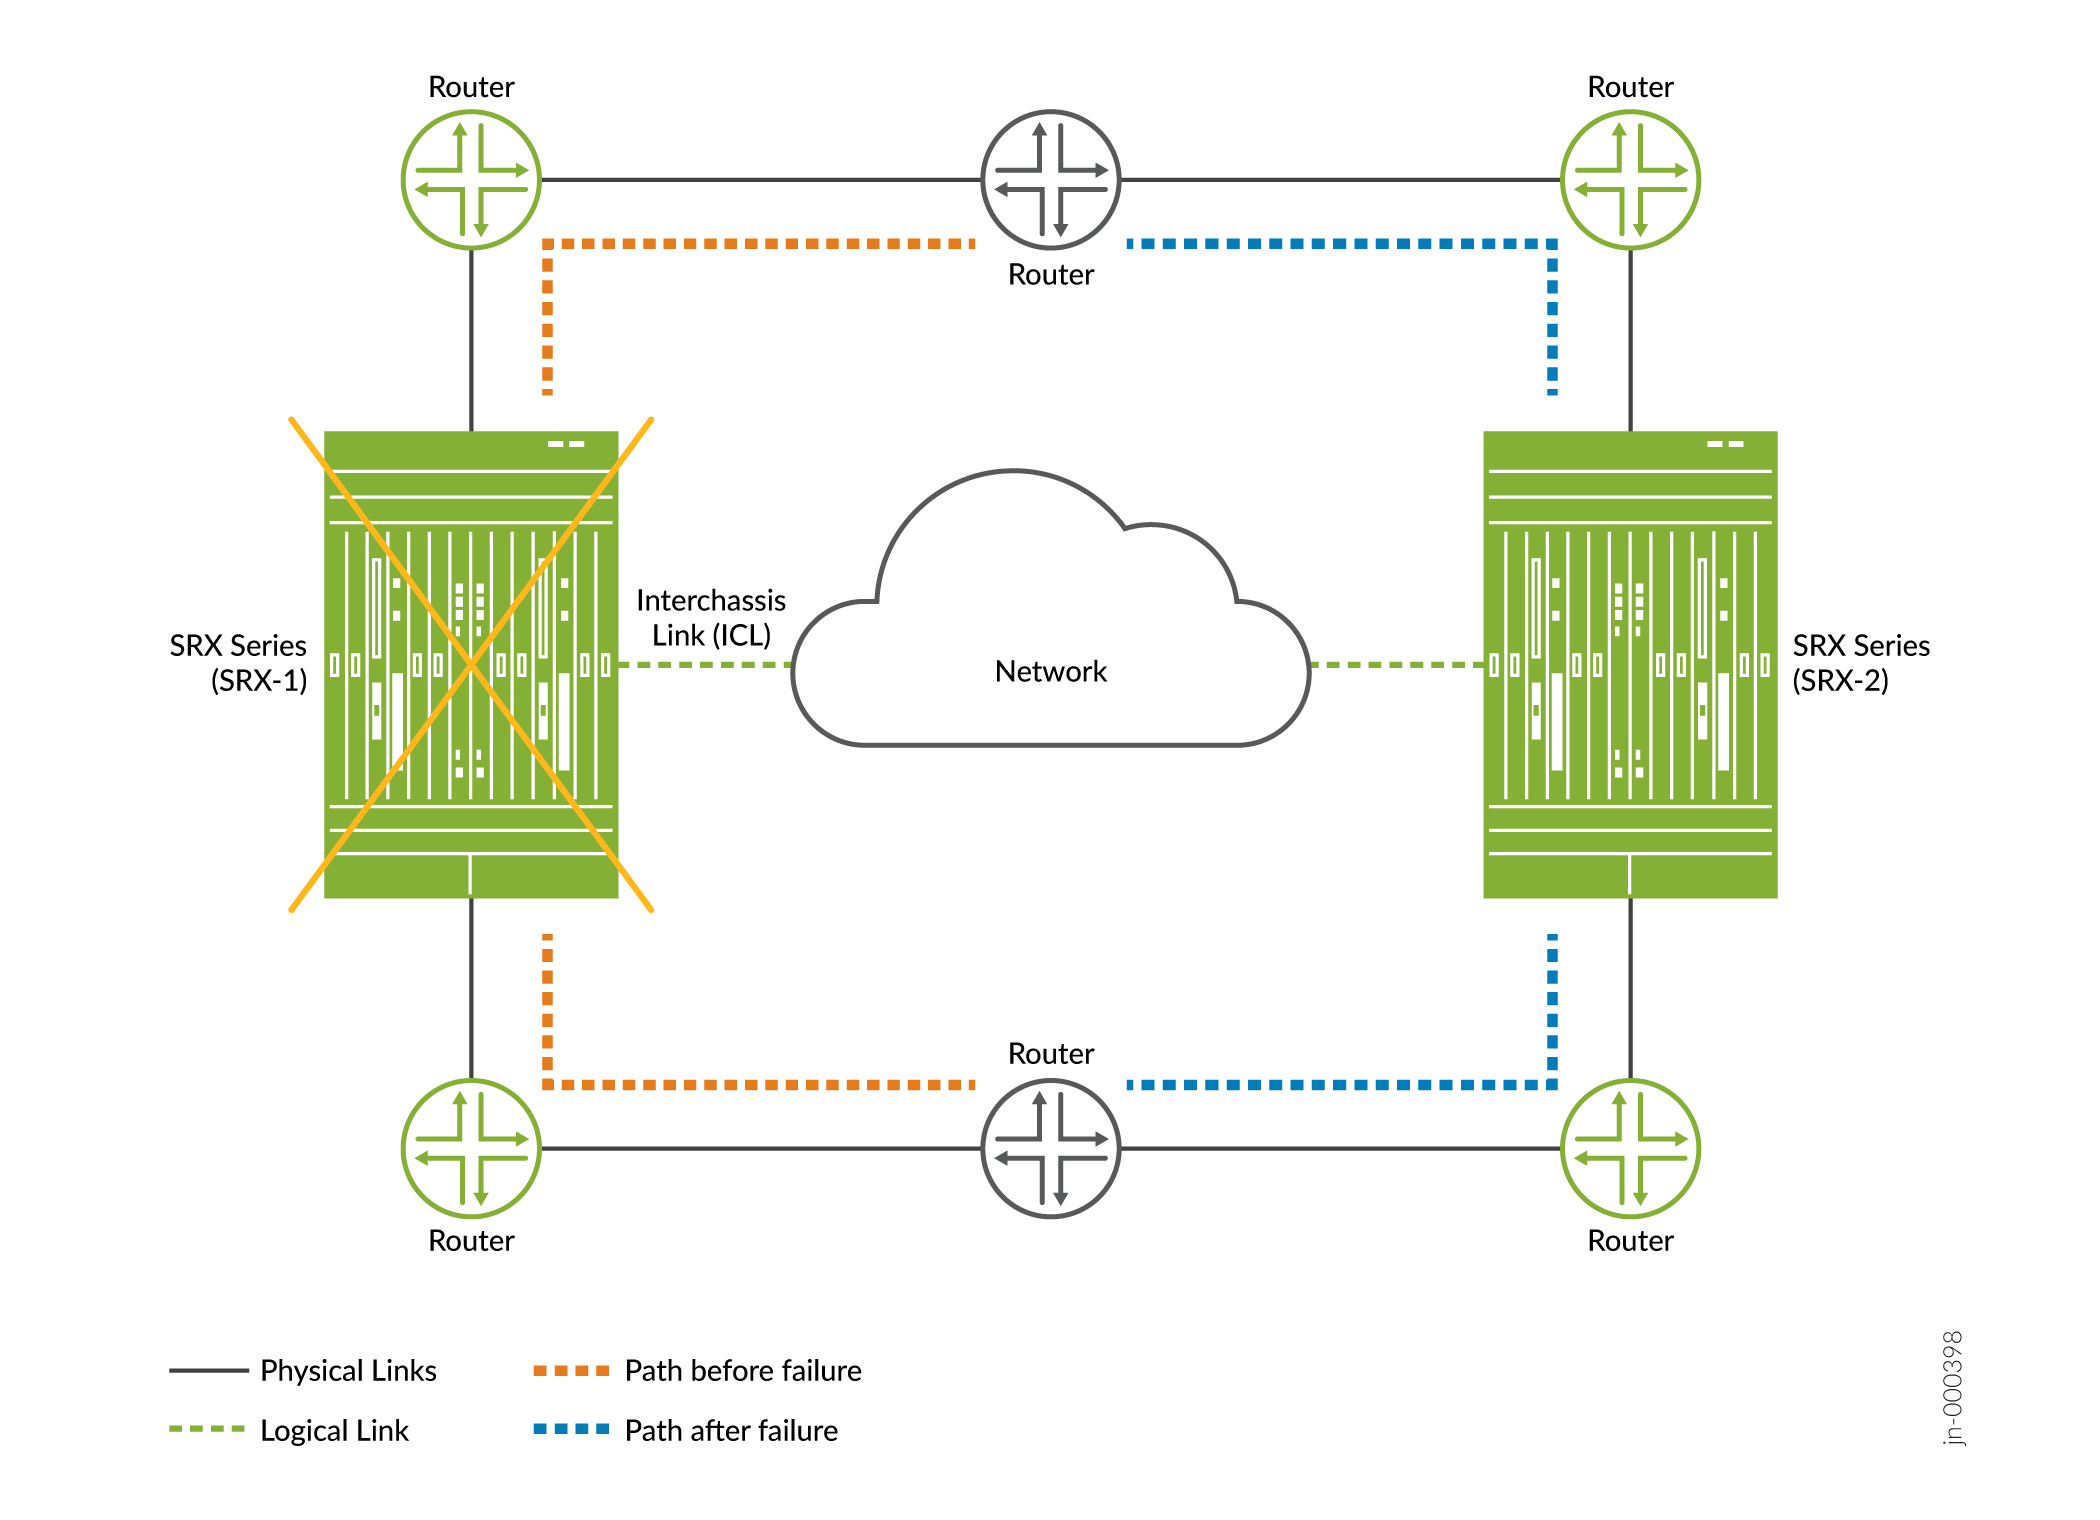
Impact —Traffic will failover to the other node (if healthy) as
shown in Figure 1. . Figure 1: Hardware Failure in Multinode High Availability
- Recovery—Recovery of failure takes place when you clear chassis hardware failure (ex: replace or repair the failed hardware component.
- Results—Check status using the following commands:
System/Software Failure
- Cause—A failure in software process or service or issues with operating system.
-
Detection— In Multinode High Availability
- Affected device/node not accessible
- Changes system state to
INELIGIBLEon the affected node with system/software failure.
-
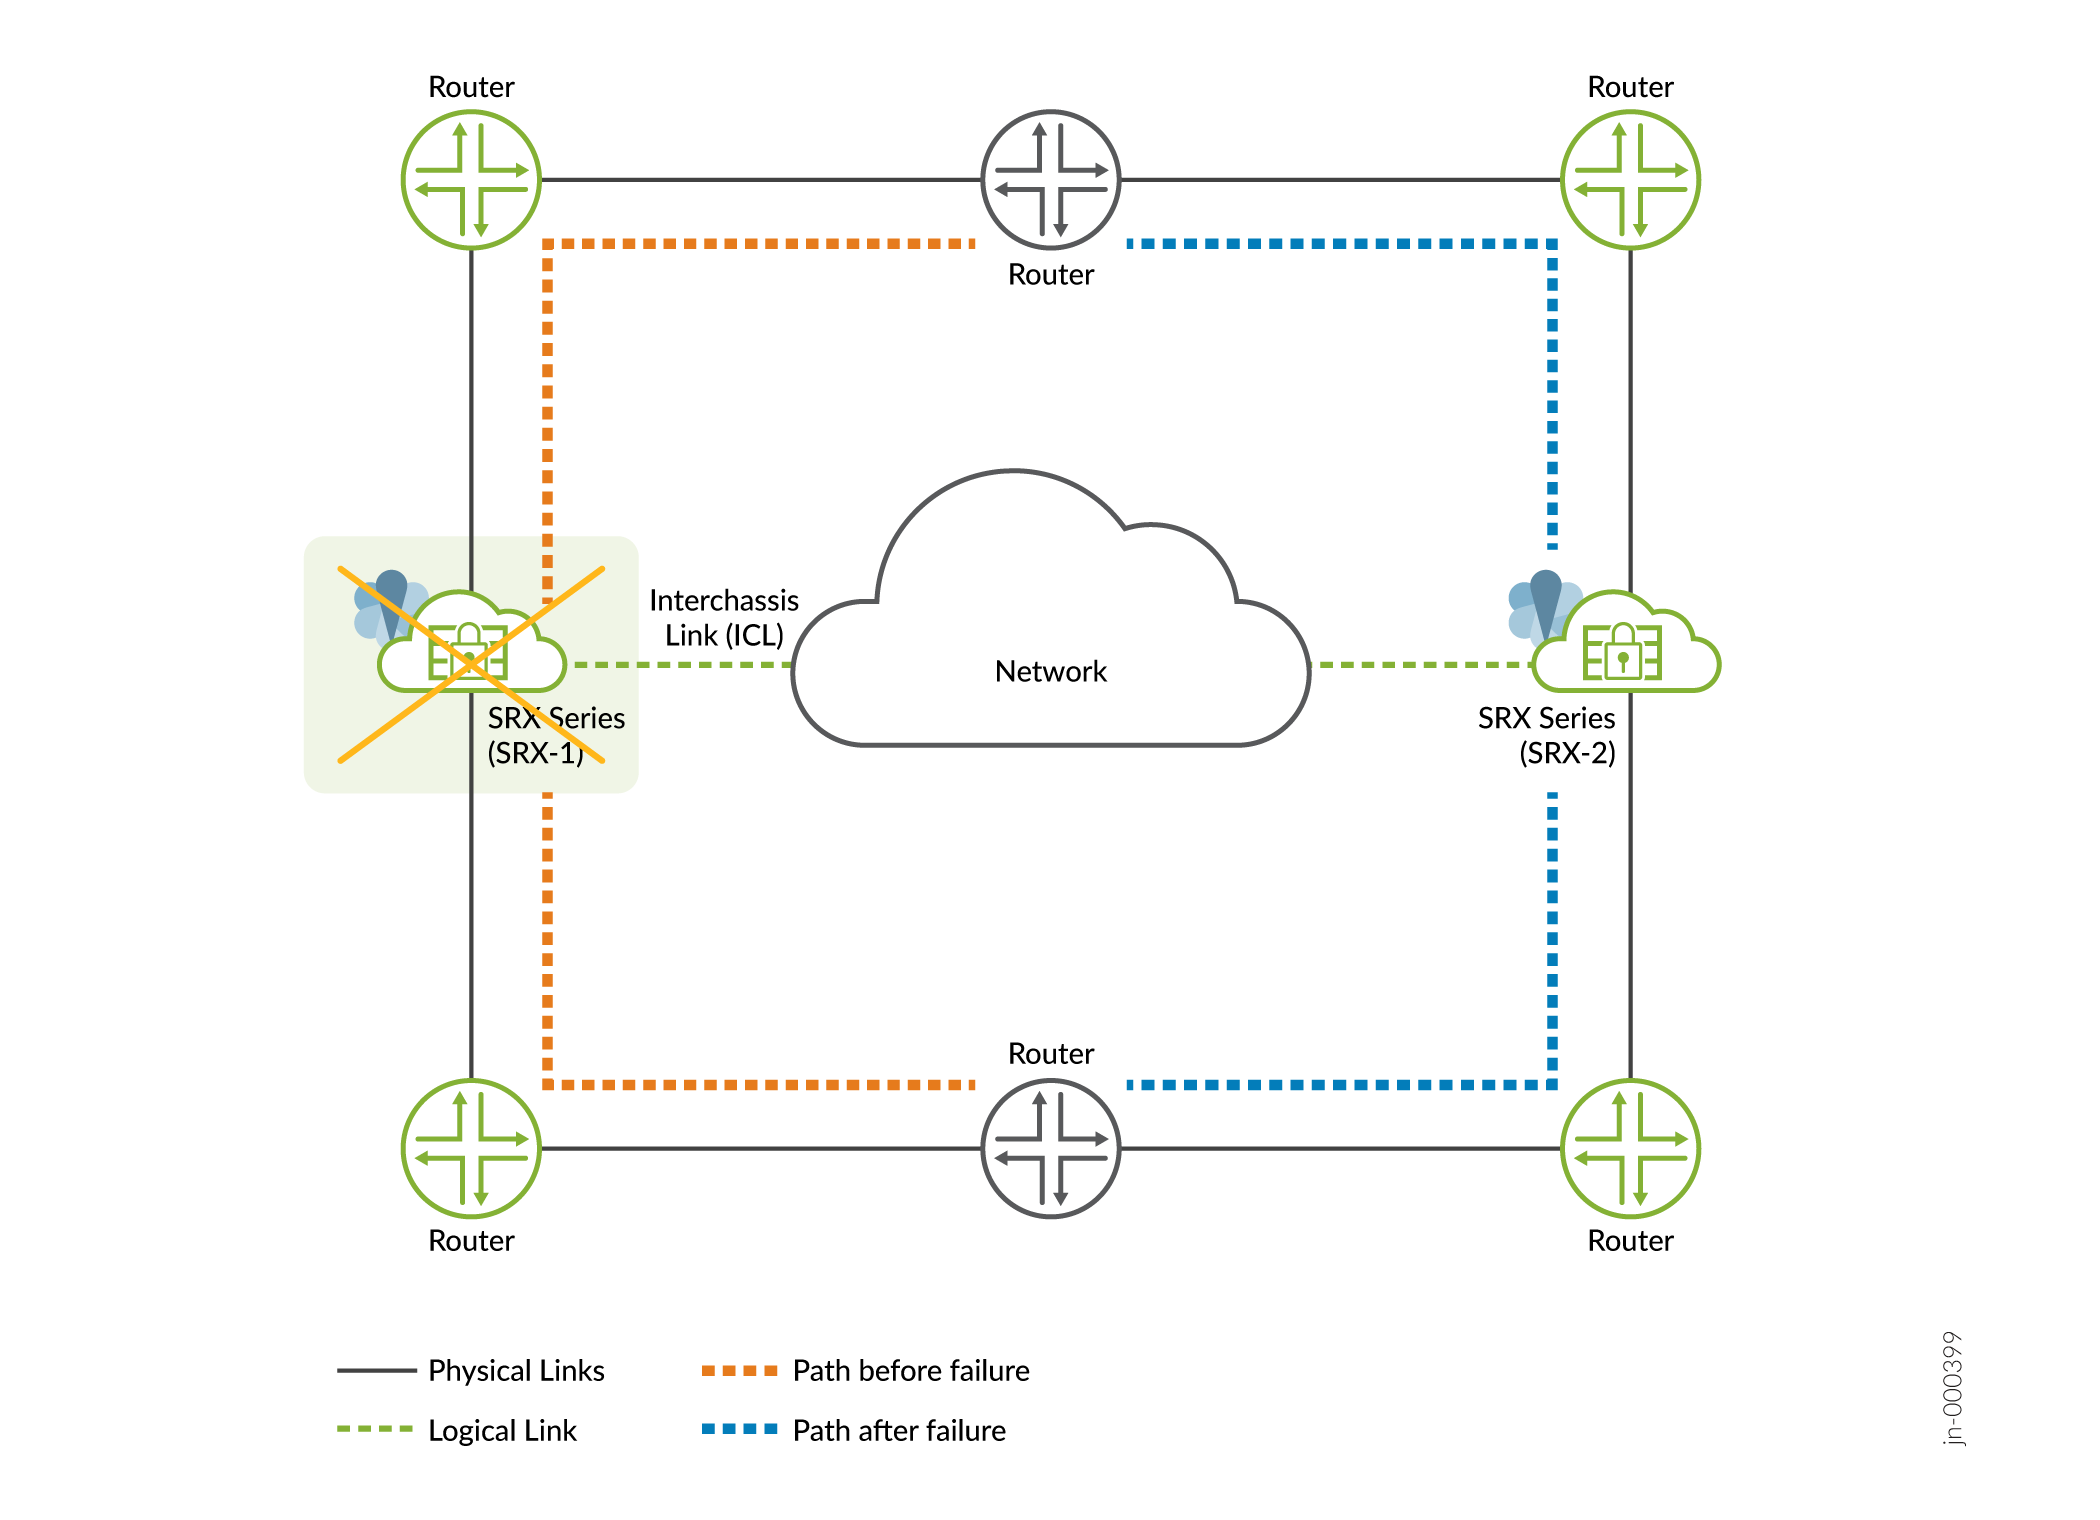
Impact —Traffic will failover to the other node if healthy as
shown in Figure 2
Figure 2: Software Failure in Multinode High Availability
- Recovery—Automatically and gracefully recovers from the outage once the issue is addressed. The backup node that has taken the active role, continues to remain active. The formerly active node remains as the backup node.
- Results—Check status using the show chassis high-availability information detail command.
Network/Connectivity Failure
Physical Interfaces (Link) Failure
- Cause—A failure in interfaces could be due to network equipment outages, or disruption with physical cable or inconsistent configurations.
-
Detection— In Multinode High Availability
- Affected device/node is not accessible.
- SRG1 status changes to
INELIGIBLEon the affected node with network or connectivity failure (if the interface-monitor is configured). Path connectivity could also be detected with BFD or IP-monitoring and trigger an event based on configured action.
-
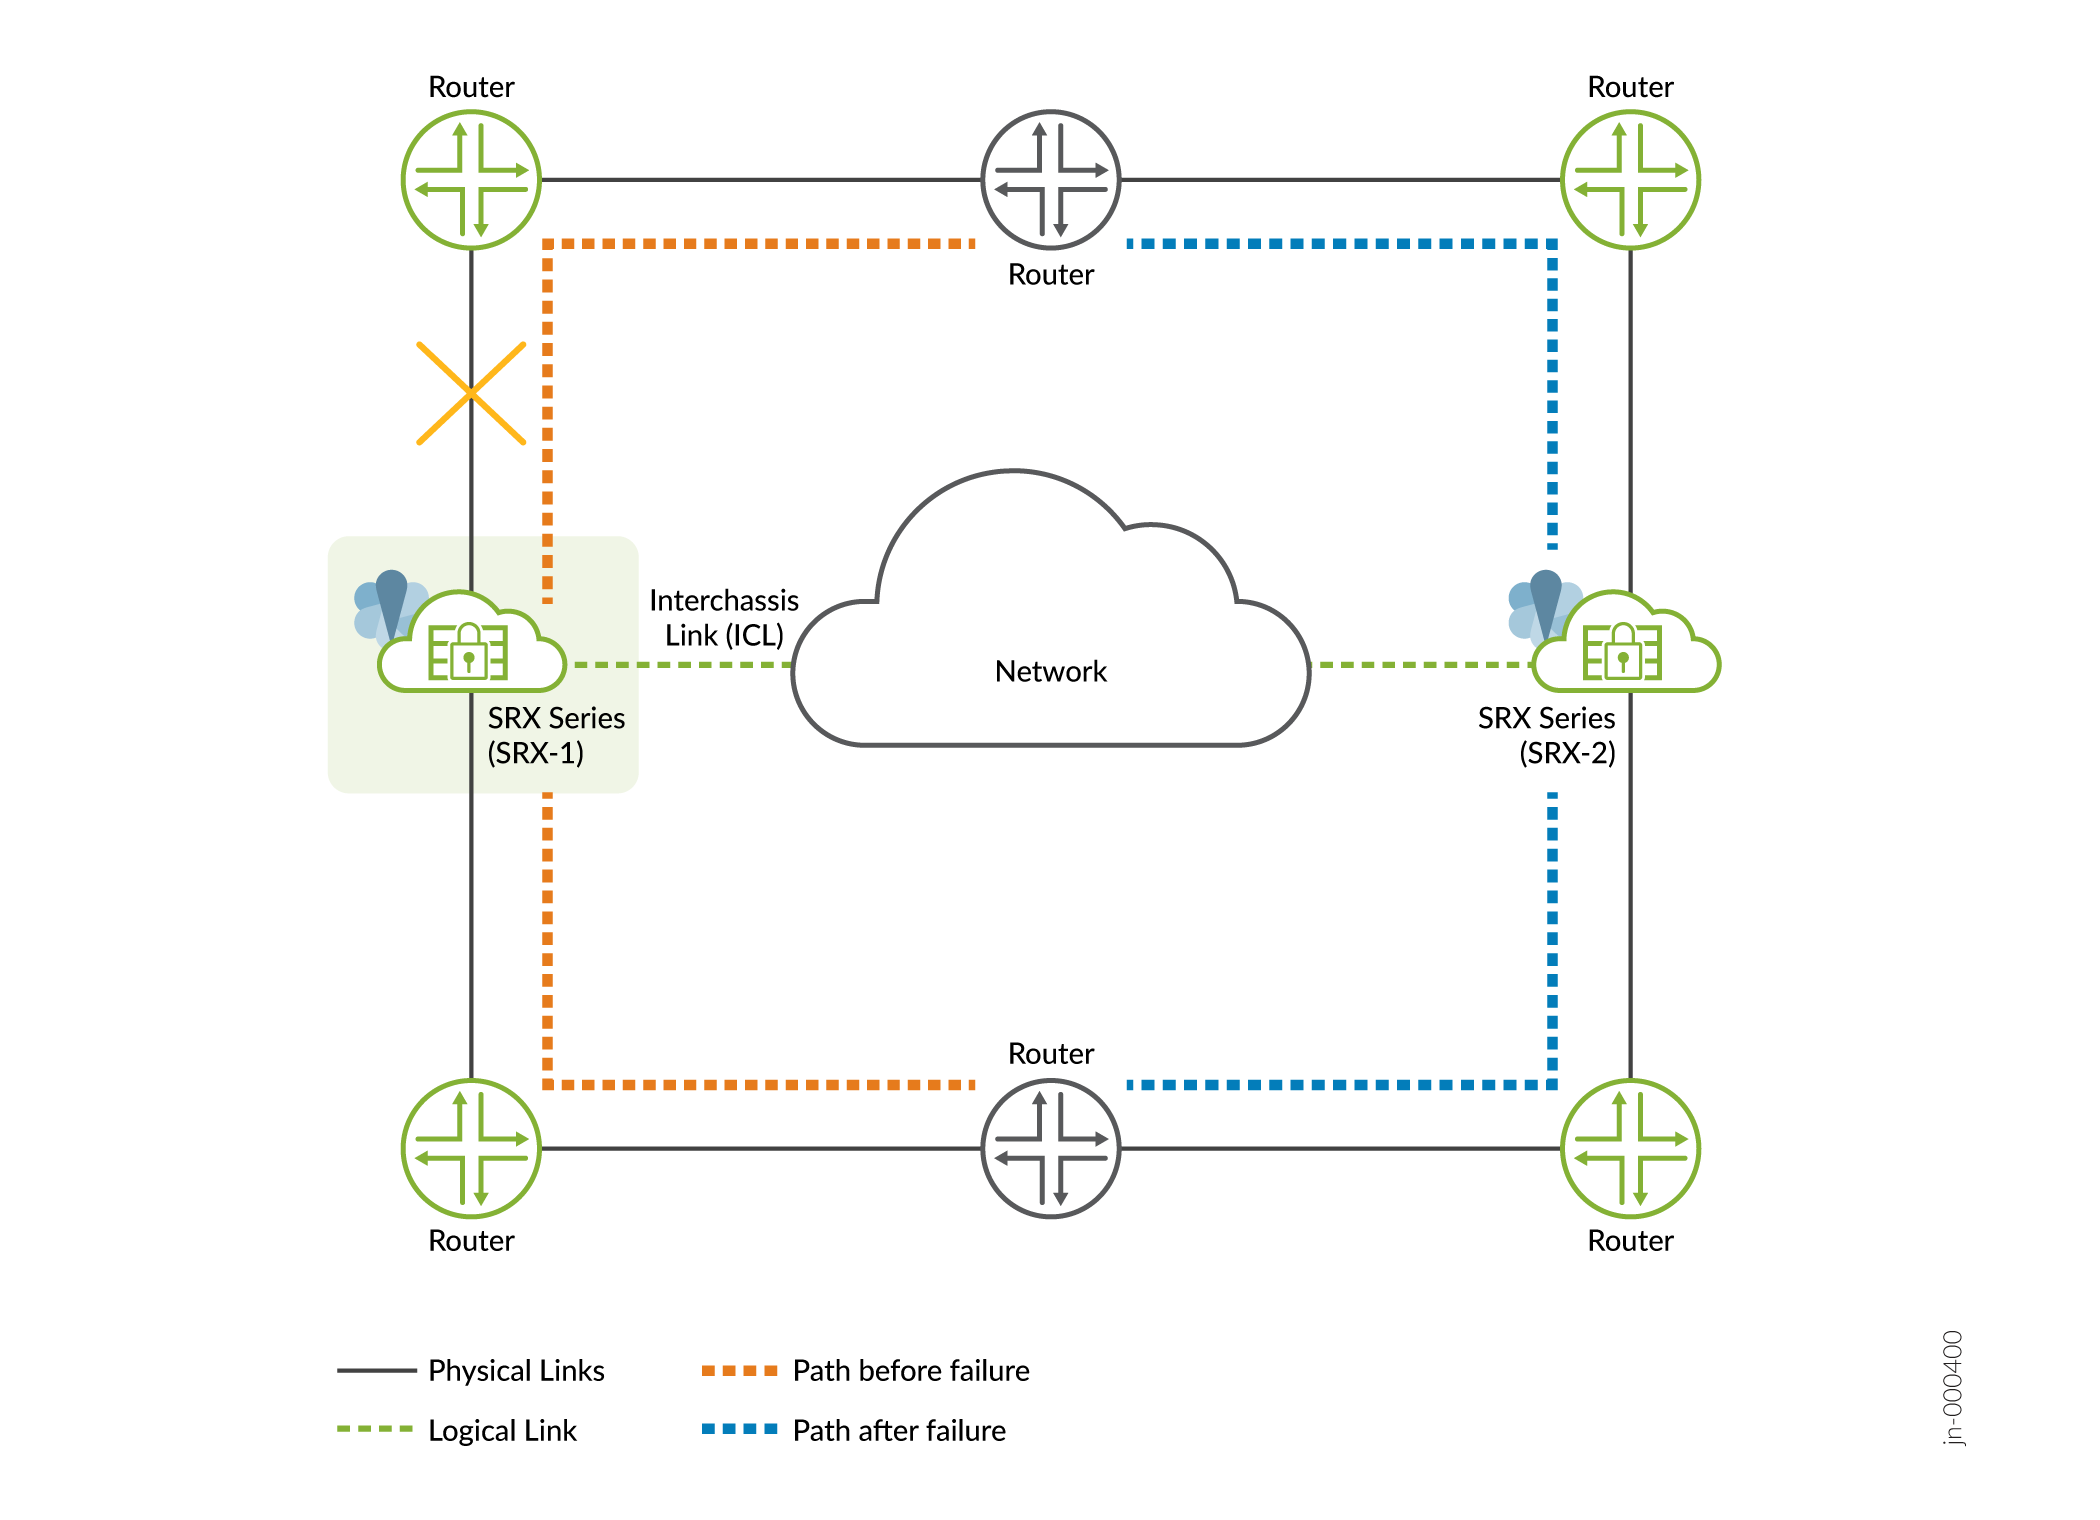
Impact—A change in the link state of the interfaces triggers a
failover. The backup node takes up the active role, and services that
were running on the failed node are migrated to other node as shown in
Figure 3. Figure 3: Interface Failure
-
Configuration—To configure BFD monitoring and interface monitoring, use the following configuration statement:
set chassis high-availability services-redundancy-group <1> monitor bfd-liveliness <source-ip-address> <destination-ip-address> routing-instance <routing-instance-name> <single-hop| multihop> <interface-name>
set chassis high-availability services-redundancy-group <1> monitor interface <interface-name>
All links critical to traffic flow should be monitored.
Checkout Example: Configure Multinode High Availability in a Layer 3 Network for complete configuration details.
- Recovery—Recovers when you repair/replace the failed interface. After the network/connectivity failure recovers, SRG1 moves from the INELIGIBLE state to the BACKUP state. The new-active node continues advertise better metrics to its upstream router and processes traffic.
- Results—Check status using the following commands:
-
For information on configuring interfaces in MNHA, see Example: Configure Multinode High Availability in a Layer 3 Network. For troubleshooting interfaces, see Troubleshooting Interfaces.
Interchassis Link (ICL) Failure
- Cause—A failure in ICL could be due to network outages, or inconsistent configurations.
- Detection— In Multinode High Availability, nodes cannot reach each other and they initiate a activeness determination probe (ICMP probe).
-
Impact— In a Multinode High Availability system, ICL connects
active and backup nodes; if the ICL goes down, both devices will notice
this change and start the activeness probe (ICMP probe). Activeness
probe is done to determine the node that can take active role for each
SRG1+. Based on the probe result, one of the node transitions to the
active state.
As shown in Figure 4, the ICL between SRX-1 and SRX-2 goes down. Both devices cannot reach each other and start sending activeness probes to the upstream router. Since SRX-1 is on higher preferred path in the router configuration, it takes up active role and continues to process traffic and advertises higher preference path. The other takes up backup role.
Figure 4: ICL Failure in Multinode High Availability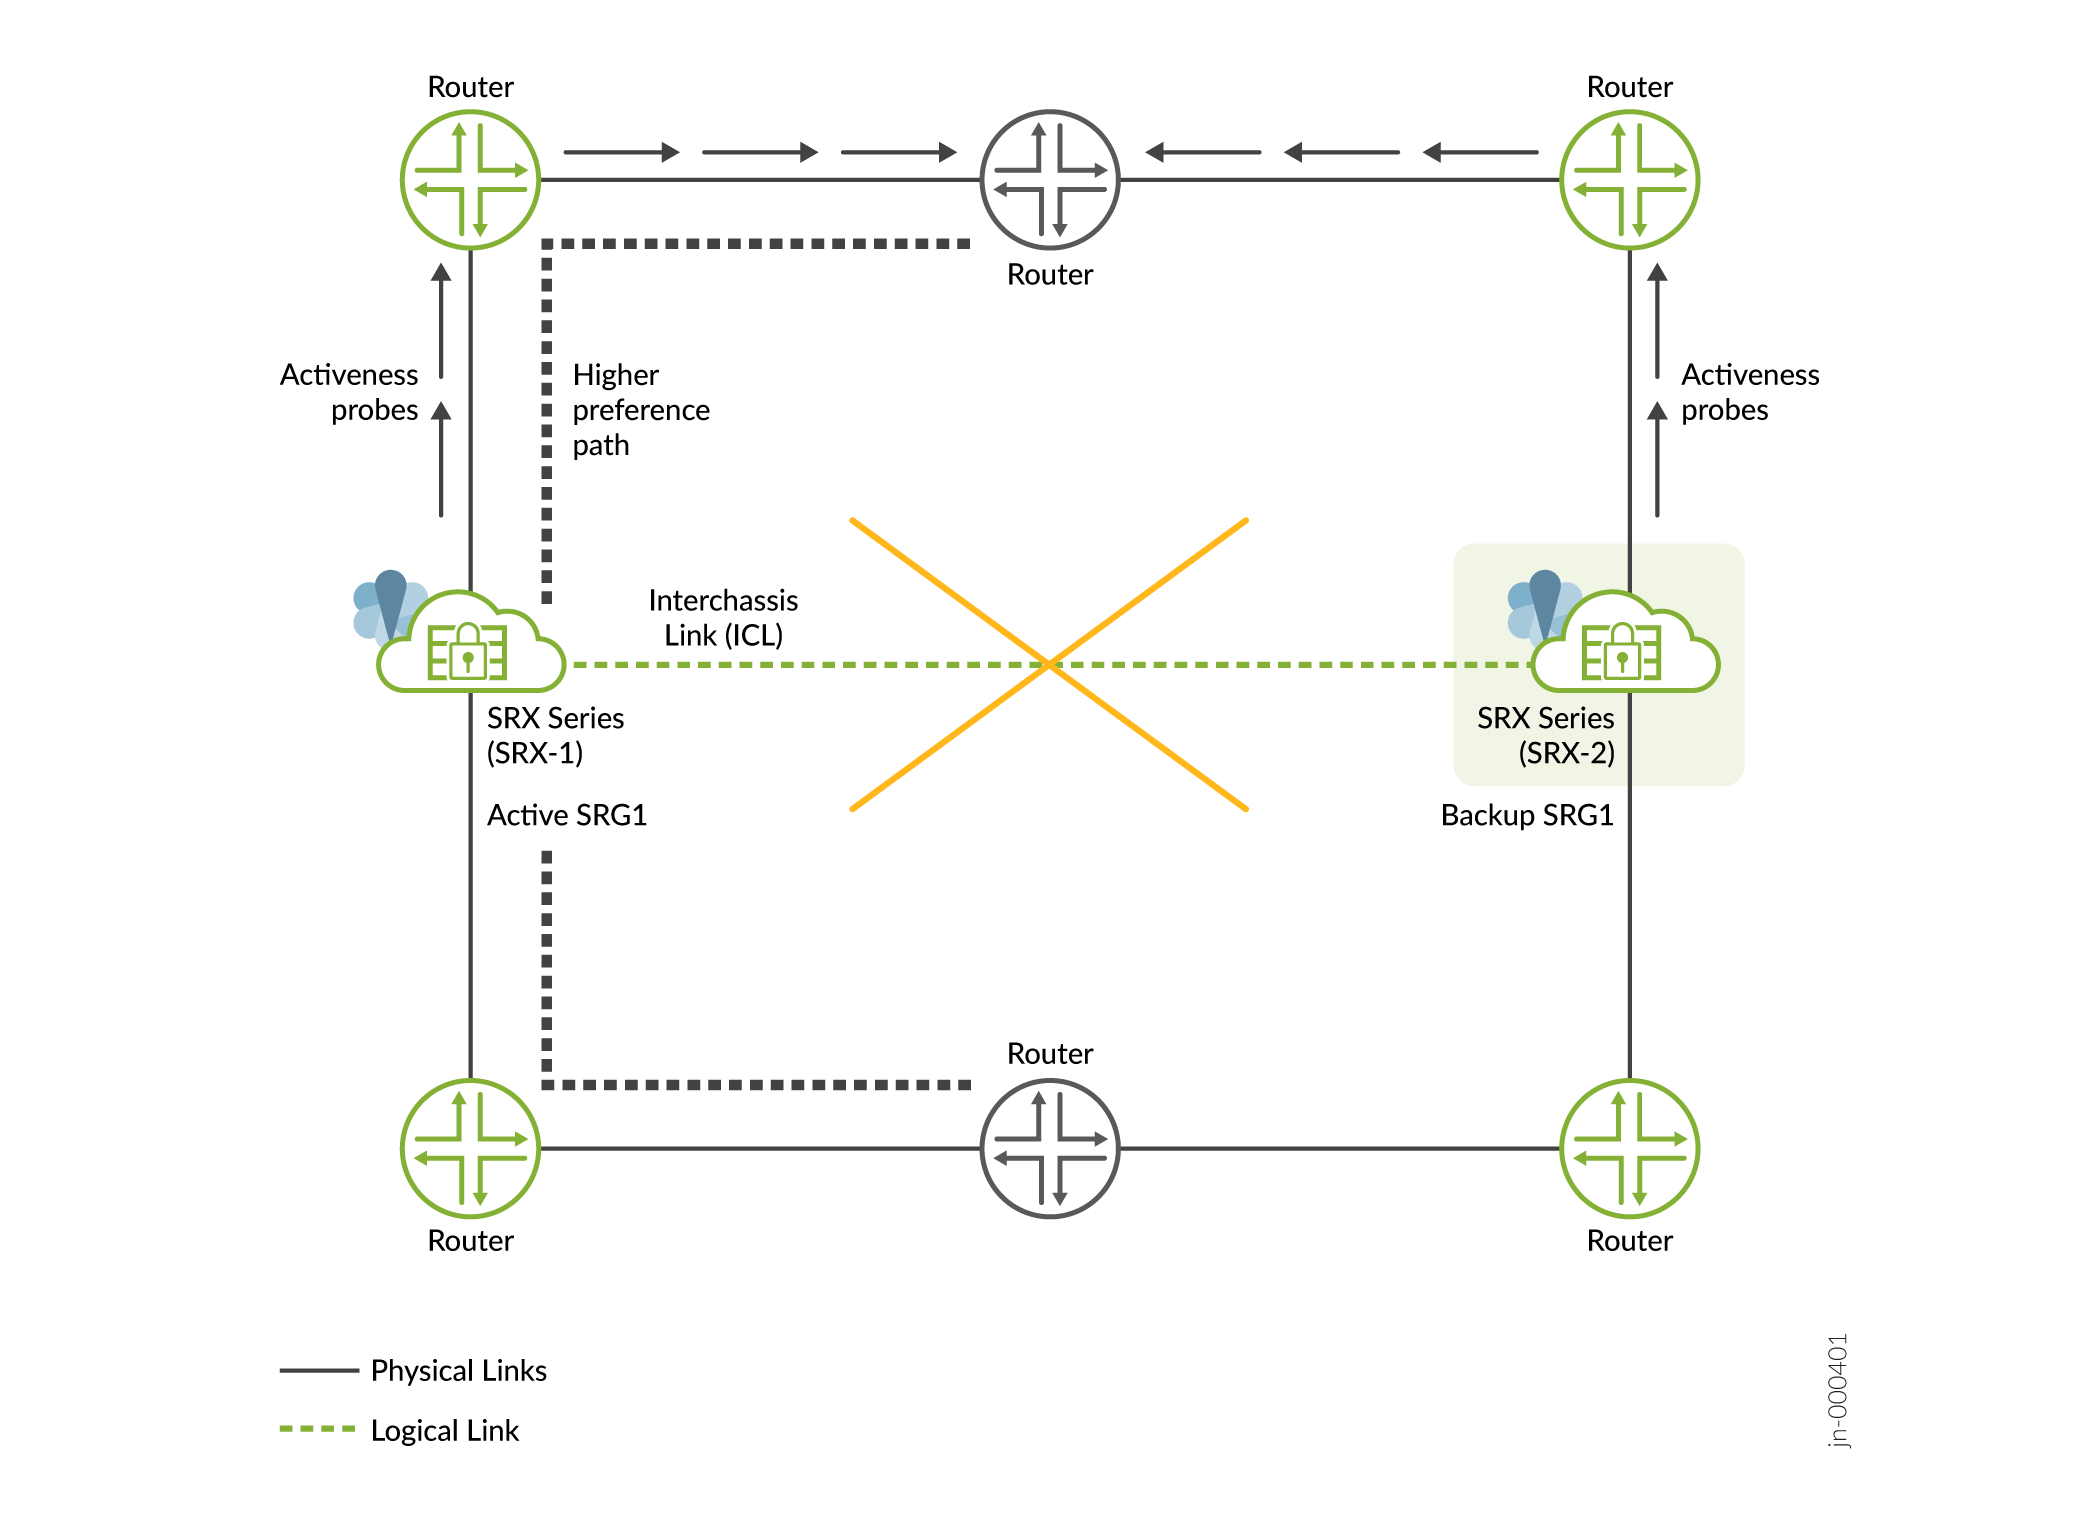
-
Configuration—To configure the activeness probing, use the following configuration statement:
set chassis high-availability services-redundancy-group <1> activeness-probe <destination-ip-address> routing-instance <routing-instance-name>
Checkout Configuring Multinode High Availability In a Layer 3 Network for complete configuration details.
-
Results—Check status using the following commands:
-
show chassis high-availability information detail -
show chassis high-availability services-redundancy-group 1 -
Check ICMP packet reply from the upstream router using ping option. Example:
ping
                                                <activeness-probe-dest-ip>
                                            source
                                            <activeness-probe-source-ip>
                                            routing-instance
                                                <routing-instance-name>
.
-
-
Recovery—Once one of the nodes assumes active role, Multinode High Availability restarts cold synchronization process and resynchronizes control-plane services (IPSec VPN). SRG state information is re-exchanged between the nodes.
Node Remains in Isolated State
-
Cause—In a Multinode High Availability setup, the node remains in
isolated state after a reboot and associated interfaces continue to
remain down when:
-
Inter chassis link (ICL) has no connectivity to the other node after booting up until the cold-sync complete
and
-
The
shutdown-on-failureoption is configured on SRG0Note:The above cause could also happen if the other device is out of service.
-
-
Detection—SRG0 status displayed as
ISOLATEDin command output. -
Recovery—The node automatically recovers when the other node comes online and the ICL can exchange system information or when you remove the
shutdown-on-failurestatement and commit the configuration.Use the
delete chassis high-availability
                                    services-redundancy-group 0 shutdown-on-failure
to remove the statement.If the above solution is not suitable for your environment, you can use the
install-on-failure-routeoption. In this option, the Multinode High Availability setup uses a defined signal route for more graceful handling of the above situation using routing policy options, which is similar to active-signal-route and backup-signal-route approach available in SRG1+.
Flexible Path Monitoring
Starting in Junos OS Release 23.4R1, we have added new enhancements for the following existing path monitoring features:
- IP monitoring
- BFD monitoring
- Interface monitoring
The enhancements add more granular control for the path monitoring feature by:
- Extension of monitoring for SRG0 in addition to SRG1+
- Grouping of monitoring functions
- Support monitoring based on the direction associated with an service redundancy group (SRG) path
- Adding weights associated with each monitoring functions
By grouping related functions together, the system can process them as a unit, which can lead to more efficient computation and resource utilization.
SRG Monitoring Objects
Lets understand the concept of monitoring objects with the following illustration.
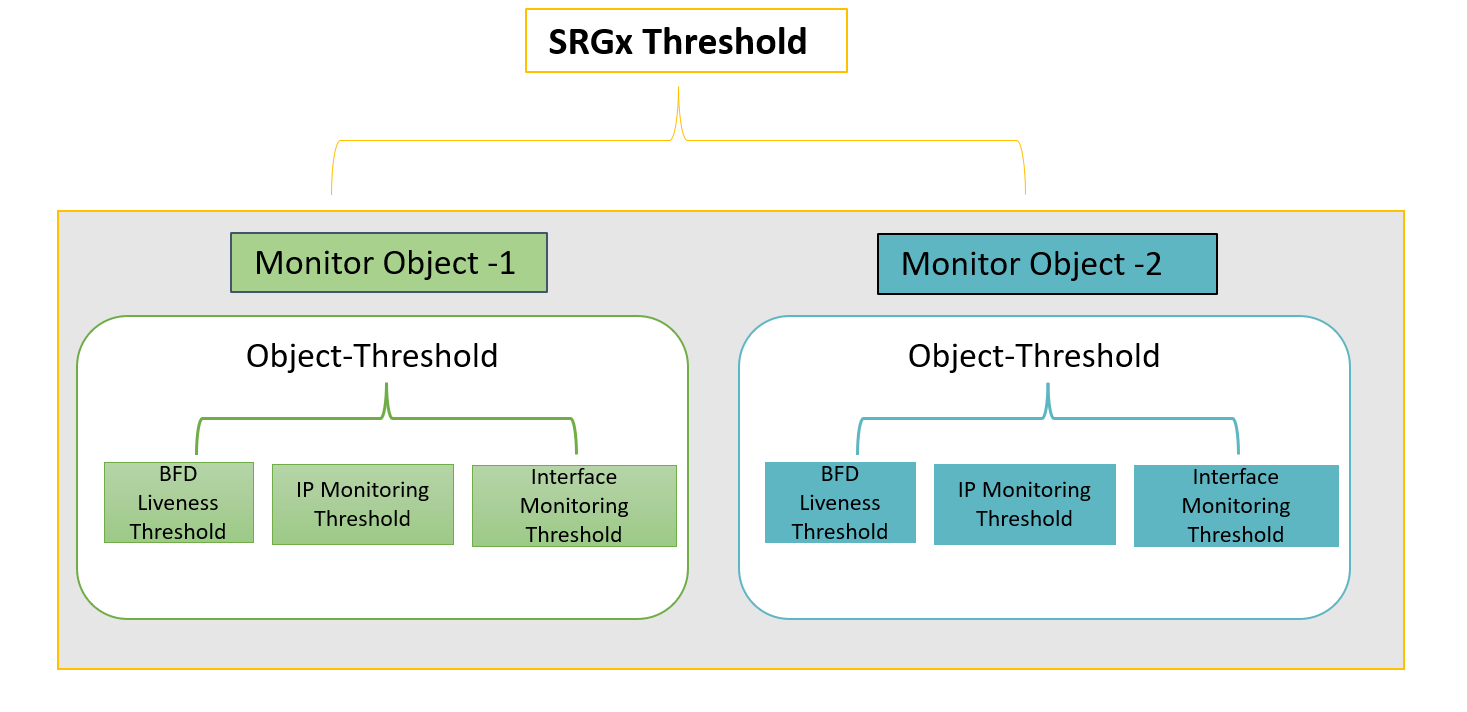
You can configure the monitoring options on a per-service-redundancy-group basis. That is, if specific items in the SRG were to fail, that SRG can failover to the other node. Each SRG includes one or more monitoring objects.
The monitoring features available in monitoring objects are—BFD liveness, interface monitoring, and IP monitoring. Each of these feature has an associated threshold value and weight attributes.
Within a monitor-object, whenever the particular object fails to trigger a failover as result of IP/interface/BFD monitoring, the system considers the event as monitoring failure. The software adds the count based on the weight of the failed object.
When the count exceeds the threshold value of IP/interface/BFD, the system adds the count to parent monitoring-object's threshold value.
When the sum of the thresholds of all monitoring-objects bound to the SRG is equal to or greater than the threshold value configured on the SRG, the system triggers a monitor failure for that SRG. SRG fails over to the other node.
Path Monitoring Configuration
Lets consider the following example for the topology shown in Figure 6. In this setup, we are configuring path monitoring options for SRG1 on Node 2 device.
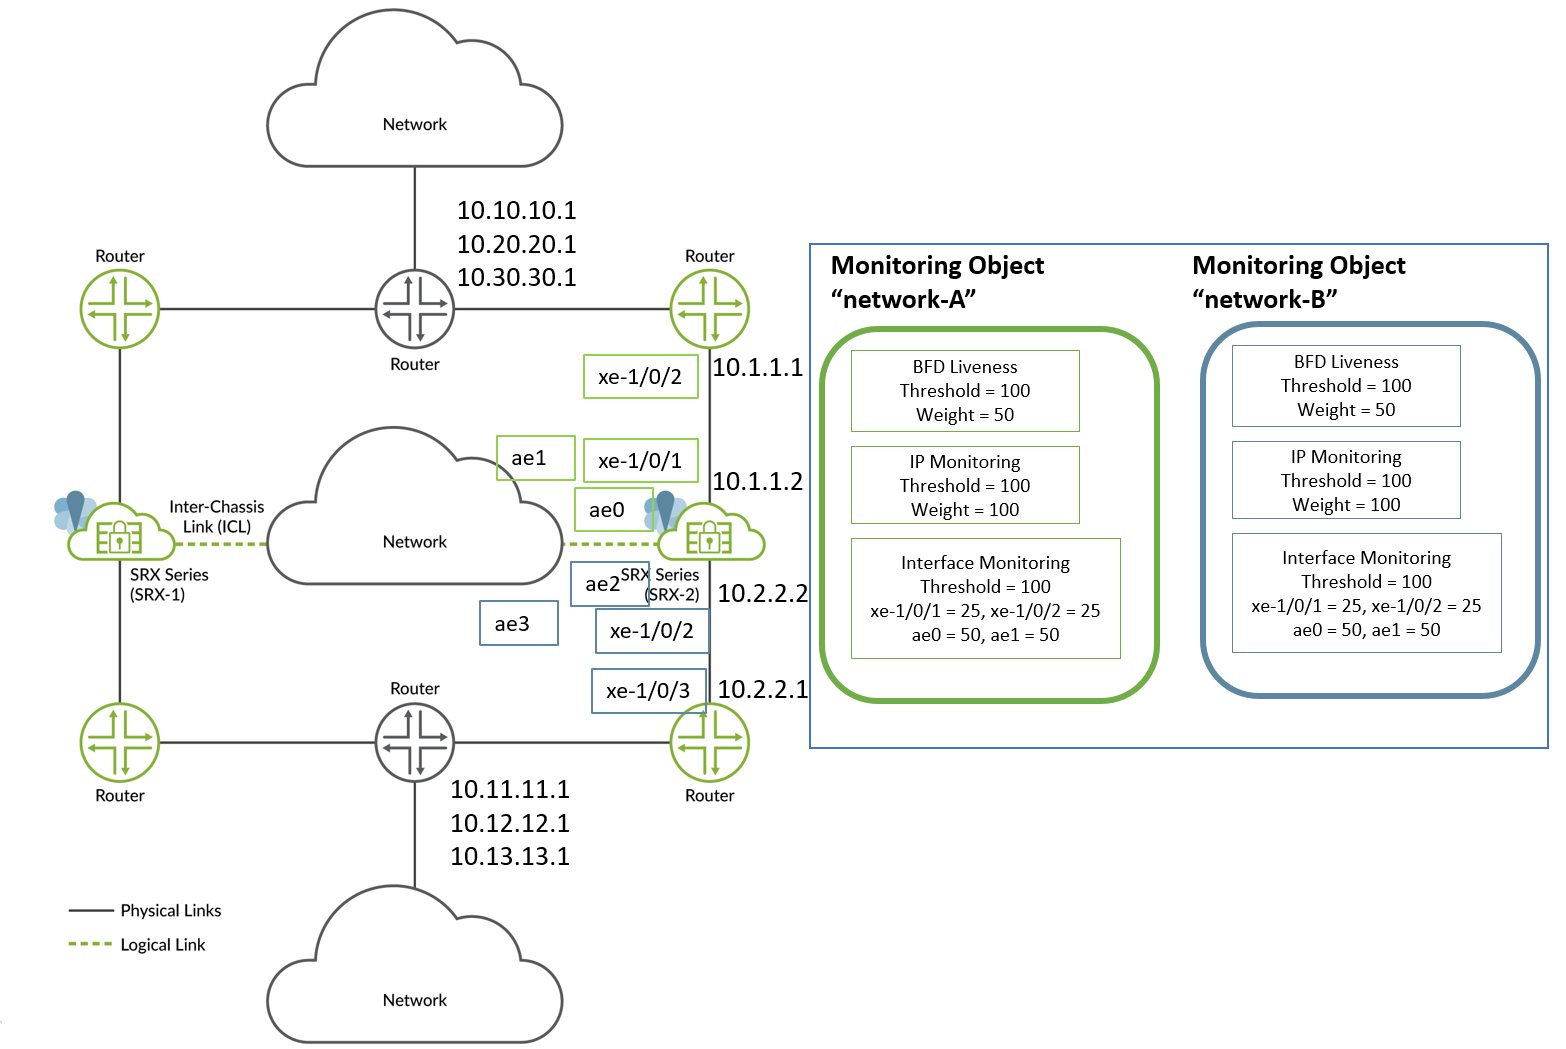
In this example, to configure path monitoring options:
- Use an aggregated Ethernet interface (ae) for inter-chassis link (ICL) and use xe-1/0/x interfaces for connecting to neighboring routers.
- Create two monitor-objects “network-A” and “network-B”. Both the network-A and network-B monitor-objects include all IP addresses and interfaces configured between the SRX Series device and neighboring routers.
- Configure BFD to monitor the neighboring routes.
- Configure IP monitoring to monitor the routes not directly connected to SRG1.
- Configure interface monitoring on directly connected links or next-hops.
The following table shows sample weights and threshold assignments.
|
Monitor Objects |
BFD |
IP |
Interface |
Monitor-Object Threshold |
SRG Threshold |
|||
|---|---|---|---|---|---|---|---|---|
|
Threshold |
Weight |
Threshold |
Weight |
Threshold |
Weight |
|||
| network-A |
100 |
50 |
100 |
50 (10.10.10.1, 10.20.20.1, 10.30.30.1) |
100 |
25 (xe-1/0/1 and xe-1/0/2) 50 (ae0 and ae1) |
100 |
100 |
| network-B |
100 |
50 |
100 |
50 (10.11.11.1, 10.12.12.1, 10.13.13.1) |
100 |
25 (xe-1/0/3 and xe-1/0/4) 50 (ae2 and ae3) |
200 |
|
- You can configure up to 10 monitoring objects per SRG.
- You can configure SRG monitoring as in Junos OS 23.4 (with SRG threshold and monitoring-objects) or configure monitoring options as supported before Junos OS Release 23.4R1. Combining both the styles of configuration is not supported.
- Configuring monitor-objects is same as on SRG 0 and SRG1+.
Configuration Samples:
In the following configuration snippet, the service redundancy group (SRGx) includes two monitor-objects—network-A and network-B. Each of these monitoring objects have IP monitoring, interface monitoring, and BFD detection configured with respective weights and threshold values.
- Set SRG threshold
value.
set chassis high-availability services-redundancy-group x monitor srg-threshold 100
- Configure monitor-object
network-A.- Set monitor object threshold value.
set chassis high-availability services-redundancy-group x monitor monitor-object network-A object-threshold 100
-
Configure BFD monitoring options.
set chassis high-availability services-redundancy-group x monitor monitor-object network-A bfd-liveliness threshold 100
set chassis high-availability services-redundancy-group x monitor monitor-object network-A bfd-liveliness dst-ip 10.1.1.1 src-ip 10.1.1.2 session-type multi-hop weight 100
-
Configure weight and threshold values for IP monitoring.
set chassis high-availability services-redundancy-group x monitor monitor-object network-A ip threshold 100
set chassis high-availability services-redundancy-group x monitor monitor-object network-A ip destination-ip 10.10.10.1 weight 50
set chassis high-availability services-redundancy-group x monitor monitor-object network-A ip destination-ip 20.20.20.1 weight 50
set chassis high-availability services-redundancy-group x monitor monitor-object network-A ip destination-ip 30.30.30.1 weight 50
- Configure weight and threshold values for interface monitoring.
set chassis high-availability services-redundancy-group x monitor monitor-object network-A interface threshold 100
set chassis high-availability services-redundancy-group x monitor monitor-object network-A interface interface-name xe-1/0/1 weight 25
set chassis high-availability services-redundancy-group x monitor monitor-object network-A interface interface-name xe-1/0/2 weight 25
set chassis high-availability services-redundancy-group x monitor monitor-object network-A interface interface-name ae0 weight 50
set chassis high-availability services-redundancy-group x monitor monitor-object network-A interface interface-name ae1 weight 50
- Set monitor object threshold value.
-
Configure monitor-object
network-B.-
Set monitor object threshold value.
set chassis high-availability services-redundancy-group x monitor monitor-object network-B object-threshold 200
-
Configure BFD monitoring in the monitor-object.
set chassis high-availability services-redundancy-group x monitor monitor-object network-B bfd-liveliness threshold 100
set chassis high-availability services-redundancy-group x monitor monitor-object network-B bfd-liveliness dst-ip 10.2.2.1 src-ip 10.2.2.2 session-type multi-hop weight 100
-
Configure weight and threshold values for IP monitoring.
set chassis high-availability services-redundancy-group x monitor monitor-object network-B ip threshold 100
set chassis high-availability services-redundancy-group x monitor monitor-object network-B ip destination-ip 10.11.11.1 weight 50
set chassis high-availability services-redundancy-group x monitor monitor-object network-B ip destination-ip 10.21.21.1 weight 50
set chassis high-availability services-redundancy-group x monitor monitor-object network-B ip destination-ip 10.31.31.1 weight 50
-
Configure weight and threshold values for interface monitoring.
set chassis high-availability services-redundancy-group x monitor monitor-object network-B interface threshold 100
set chassis high-availability services-redundancy-group x monitor monitor-object network-B interface interface-name xe-1/0/3 weight 25
set chassis high-availability services-redundancy-group x monitor monitor-object network-B interface interface-name xe-1/0/4 weight 25
set chassis high-availability services-redundancy-group x monitor monitor-object network-B interface interface-name ae2 weight 50
set chassis high-availability services-redundancy-group x monitor monitor-object network-B interface interface-name ae3 weight 50
-
Let take the case of network-B monitor-object in the sample.
The system has a threshold value of 100 for interface monitoring and assigned weights for the member interfaces (50, 50, 25, and 25). If an interface of weight 50 goes down, the weight value of the interface (50) is added to the count and compared to the threshold value of the interface-monitoring. That is—count is 50 and interface threshold is 100. The count is still less than interface threshold value.
If another interface of weight 50 goes down, the count is incremented by 50 and compared to the threshold value of the interface-monitoring. The count is now equal to the interface threshold value 100. As the count equals the threshold value, the system adds this value (100) to monitor-object (network-B)'s count. The threshold value of monitor-object network-B is 200. The count (100) is still less than object-monitor's threshold value.
Similarly, if IP monitor or BFD monitor also reach their respective threshold values and add to the object-monitor's count, the count is incremented and compared against object-monitor's threshold value. Once the count suppresses object-monitor's threshold value, the system adds the count to service-redundancy-group (SRG-1)'s count. If the sum of both network-A and network-B object-monitor counts exceeds SRG-1's threshold value, the system triggers failover to another node.
Check Monitoring Objects Configuration
Use the show chassis high-availability services-redundancy-group
1 or show chassis high-availability
services-redundancy-group <id> monitor-object <name>
commands.
The following sample shows the output of show chassis high-availability
services-redundancy-group 1 command.
user@host> show chassis high-availability services-redundancy-group 1
SRG failure event codes:
    BF  BFD monitoring
    IP  IP monitoring
    IF  Interface monitoring
    PM Path monitoring
    CP  Control Plane monitoring

.............................................
        SRG Path Monitor Info:
          SRG Monitor Status: UP
          SRG Monitor Threshold: 100
          SRG Monitor Weight: 0
          SRG Monitor Failed Objects: [ NONE ]


          Object Name: Network-B
          Object Status: UP
          Object Monitored Entries: [ IP IF BFD ]
          Object Failures: [ IP ]
          Object Threshold: 200
          Object Current Weight: 0

          Object Name: Network-A
          Object Status: UP
          Object Monitored Entries: [ IP IF BFD]
          Object Failures: NONE
          Object Threshold: 100
          Object Current Weight: 0
In the command output, you can see the status of both monitoring objects
Network-B and Network-A. You can also
notice that the failure object details in the output along with their threshold
values and weight.