Getting Started with Network Sustainability Analytics
Use this topic to get started with Network Sustainability Analytics in Juniper Data Center Assurance.
To get started with Network Sustainability Analytics:
Access the Sustainability Feature
You must enable Network Sustainability Analytics feature for your organization.
The Sustainability menu is available in the sidebar.
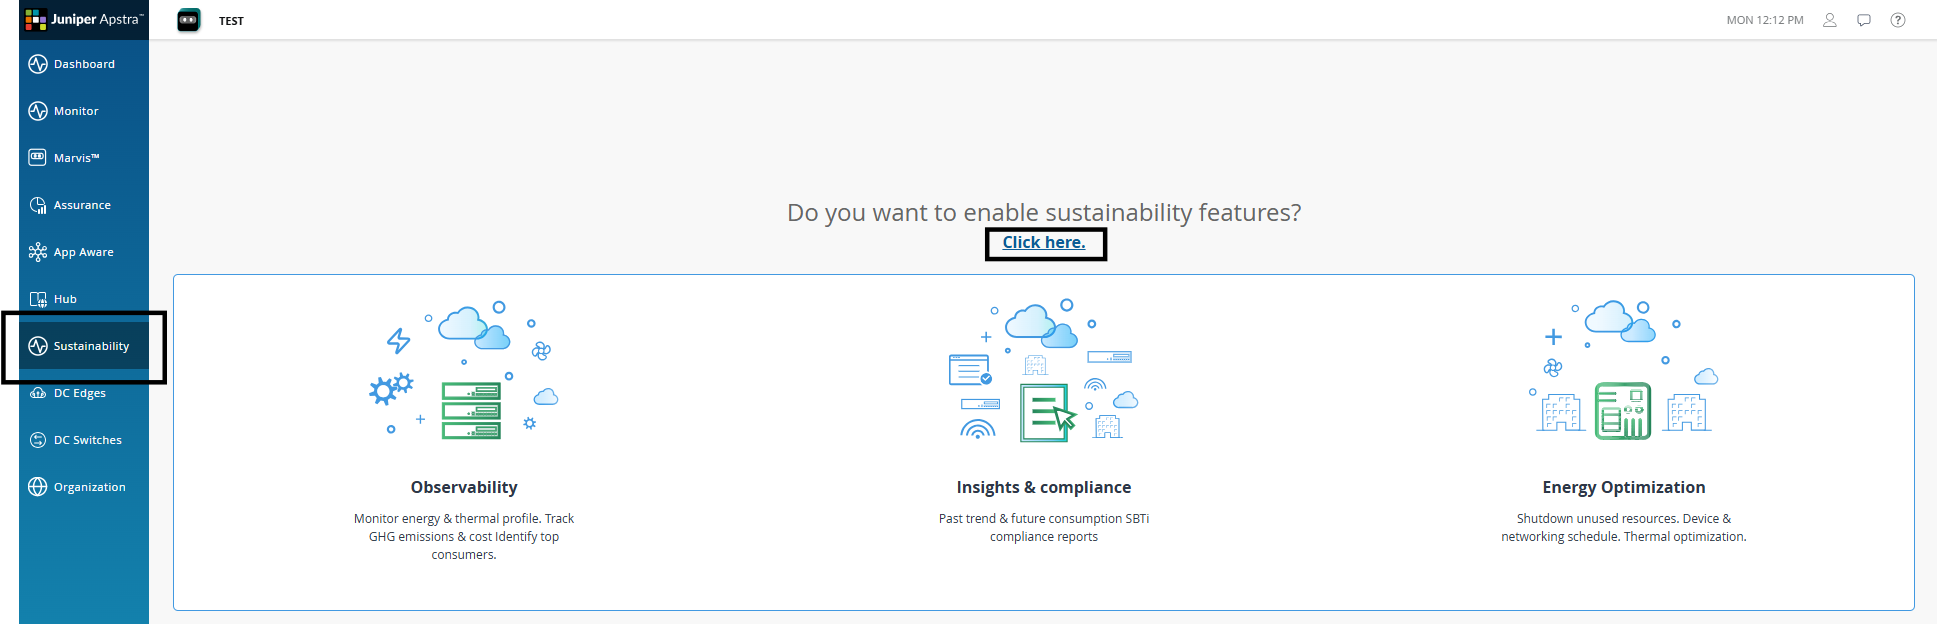
When you click the Sustainability menu for the first time, the Sustainability landing page is displayed. However, you must configure the required sustainability parameters to view Sustainability data.
The landing page provides a preview of the key sustainability capabilities that will be available to you once the feature is enabled.
To begin using Network Sustainability Analytics, click the hyperlink on the landing page.
Complete the Initial Setup
After you enable the Sustainability feature, complete the initial setup workflow.
-
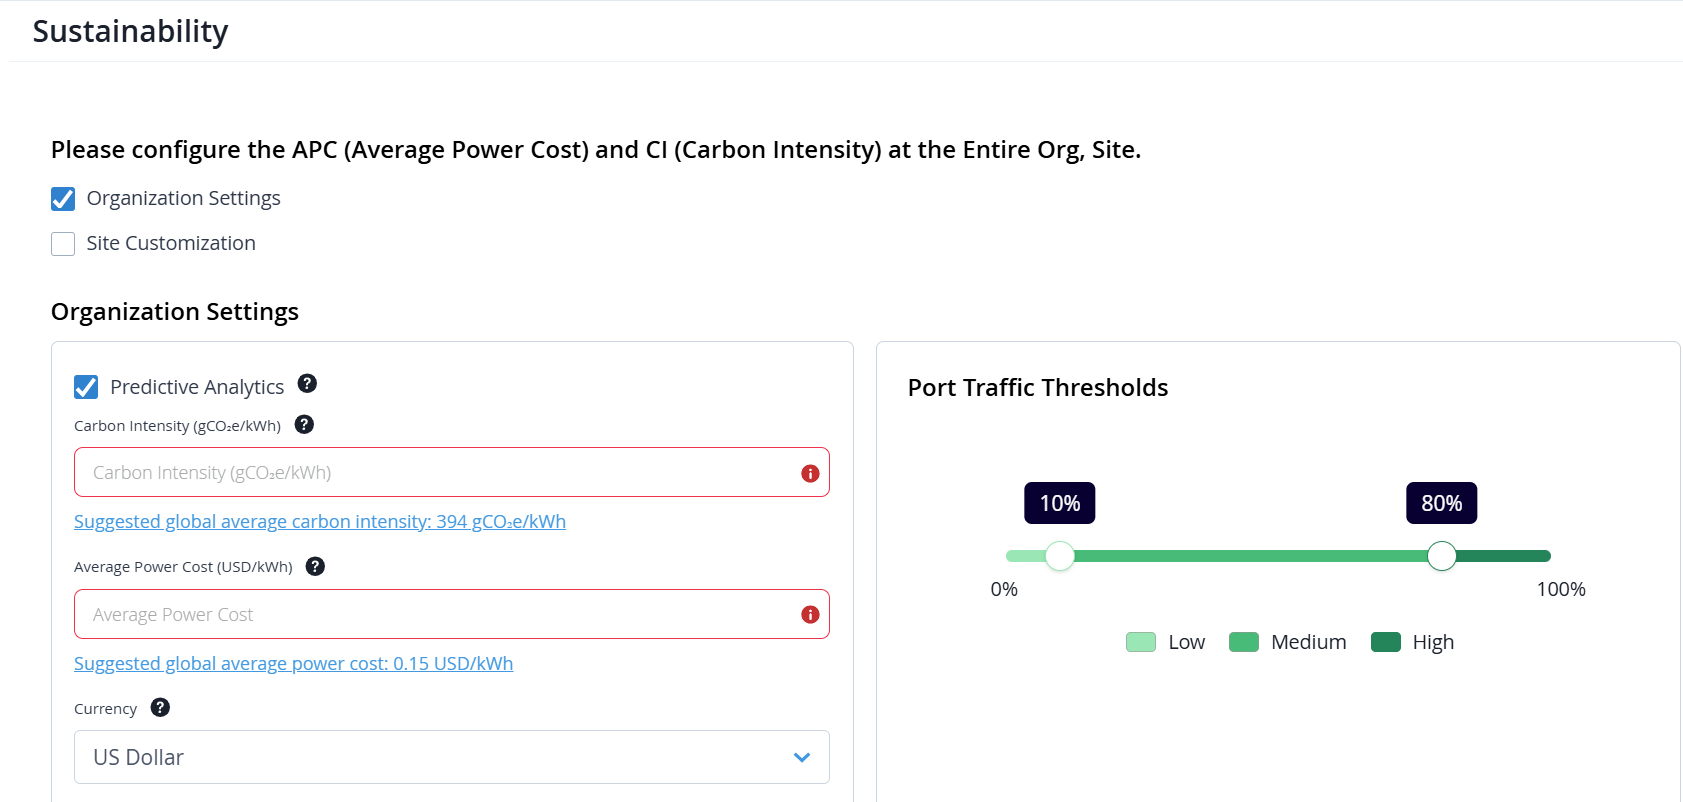
(Required) Keep the Predictive Analytics check box selected unless recommended otherwise by your HPE Networking representative.
When enabled, this feature offers AI-powered forecasts for key sustainability metrics, potential energy savings, and energy optimization recommendations.
-
(Required) Configure the following mandatory inputs for calculations and reporting: Average Power Cost (APC) and Carbon Intensity (CI).
For both parameters, suggested values are displayed based on global or location-specific estimates. You can click the provided hyperlink to automatically populate the suggested value in the corresponding field.
For more information, see Configure Sustainability Settings for the Organization, Configure Sustainability Settings for a Site.
-
(Optional but Recommended) Configure the traffic thresholds for device ports by defining utilization ranges.
Use the Port Traffic Thresholds widget to define percentage ranges. Based on these ranges, the system classifies each port as low, medium, or high utilization.
The system then uses these utilization ranges to classify port behavior in Per Port Peak / Off-Peak Traffic Monitoring heatmap and to generate current and forecasted low traffic port optimization recommendations.
For more information, see Configure Port Threshold for the Organization, Configure Port Threshold for a Site.
Sustainability inputs can be configured at the organization and site levels. By default, Organization Settings is selected for configuration, see Figure 2.
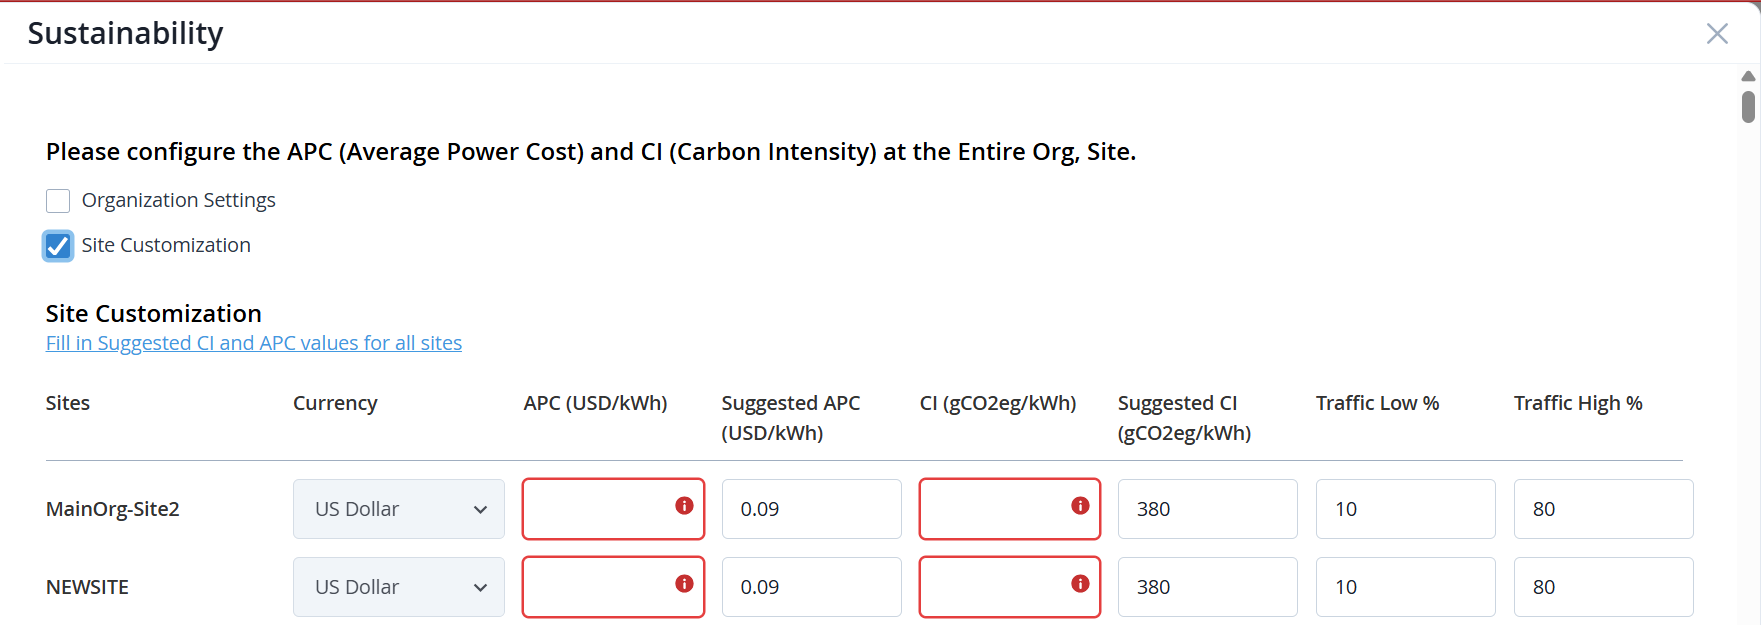
To configure inputs for individual sites and obtain accurate, site-specific analytics, select Site Customization, see Figure 3.
-
The currency unit at the site-level is inherited from the unit set at the organization-level and cannot be modified for individual sites.
-
In the Traffic Low % and Traffic High % fields, enter utilization thresholds that define port utilization ranges in percentage.
Traffic Low % specifies the upper threshold for low port utilization.
Traffic High % specifies the lower threshold for high port utilization.
The system compares measured port traffic against these thresholds to classify ports as low or high utilization.
For example, if Traffic Low % is set to 30 and Traffic High % is set to 70, a port utilizing 20% of its capacity is classified as low utilization, while a port utilizing 85% of its capacity is classified as high utilization.
If not configured, the values are inherited from the organization-level settings.
You can update these settings at any time from the corresponding configuration pages. For more information, see Configure Sustainability Settings for the Organization, Configure Port Threshold for the Organization.
After the Sustainability feature is enabled and the required settings are configured, it may take up to 24 hours for Sustainability data to populate on the dashboards.
While data is being collected and processed, the Sustainability page displays a status banner indicating that information is still being collected and also shows a countdown until the page becomes active.
In the meantime, you can also view the Organization‑level Sustainability dashboard layout in a greyed‑out state. It provides a preview of the metrics, charts, and sections that will become available once data processing is complete. No actionable data is shown during this period.
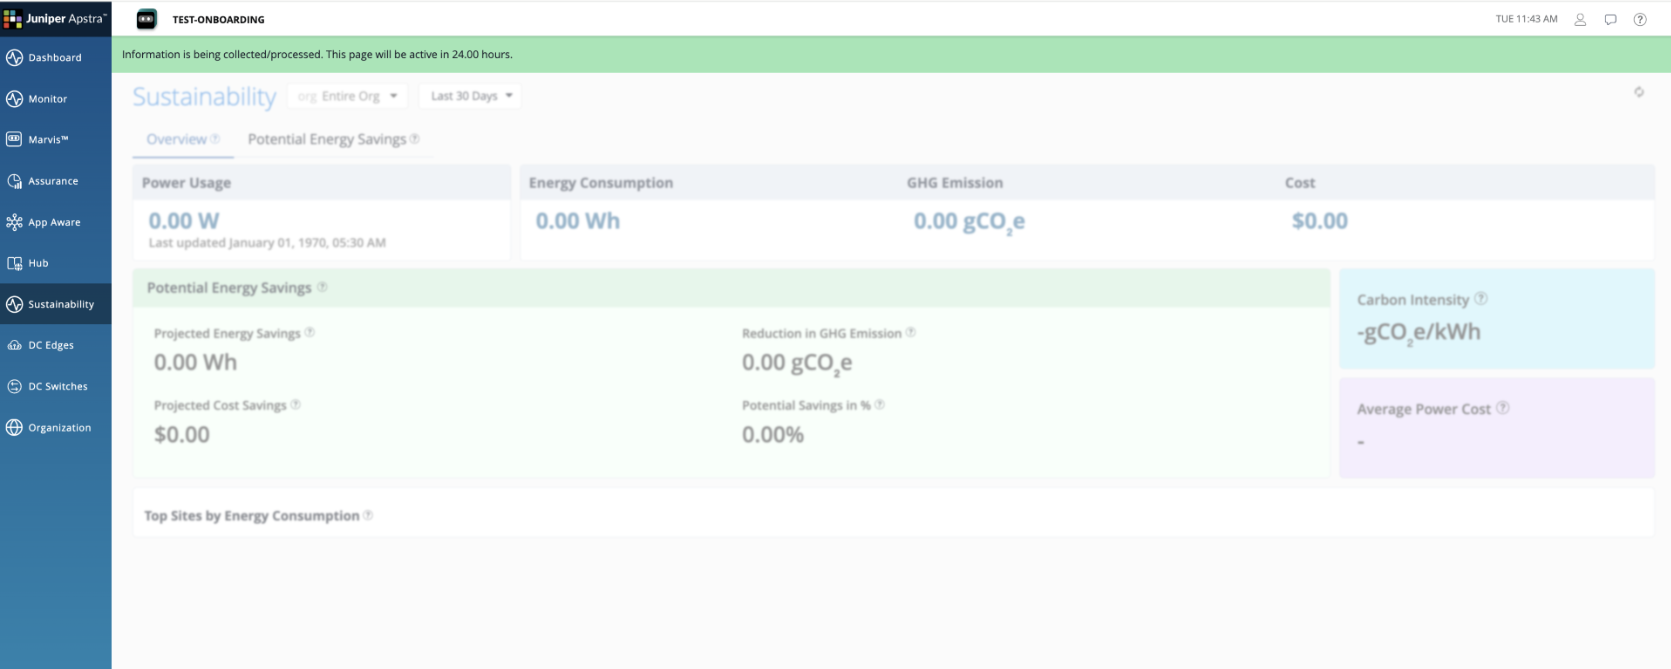
Once the initial data processing completes, the Sustainability dashboard automatically becomes active and begins displaying sustainability analytics, insights, and recommendations.
Verify Prerequisites and Environment Readiness
Before Sustainability data can populate on the dashboards, ensure the following:
- The correct version of Apstra Edge is onboarded to Juniper Data Center Assurance.
Verify Edge status from the DC Edges page. See, Adopt Juniper Apstra Edge.
-
Verify the devices and software versions meet the supported requirements to enable the Network Sustainability Analytics feature. See, Sustainability: Supported Platforms and Software Versions.
Telemetry Accumulation and Refresh Cadence
Sustainability dashboards may initially display partial or progressively populated data. Metric cards, trend charts, reports, and recommendations are updated as telemetry data accumulates and during subsequent refresh cycles.
Greenfield Deployments
- In a greenfield deployment, data collection begins after Apstra Edge is onboarded.
- Aggregated metrics and historical trends appear gradually as sufficient telemetry data is collected.
- A delay before meaningful data is visible is expected and normal and does not indicate a configuration issue.
Brownfield Deployments
- In a brownfield deployment, Apstra Edge is already onboarded or upgraded and telemetry collection is in progress.
- Sustainability dashboards populate more quickly by aggregating existing data.
- Aggregated metrics and historical trend charts may appear shortly after enablement.
- For both greenfield and brownfield deployments, it can take up to 24 hours for Sustainability data to appear on the dashboards.
- If dashboards remain empty after this period, verify Edge connectivity.
Updates and Configuration Changes
Once telemetry collection begins:
- Sustainability dashboards, reports, and recommendations are updated based on the standard data refresh cadence.
- Aggregated metrics, trend visualizations, forecasts, and recommendations reflect data collected in the most recent refresh cycle.
- Changes to sustainability settings, such as Average Power Cost, Carbon Intensity, or Port Traffic Thresholds, affect future calculations and recommendations only.
-
Historical data is not recalculated when the sustainability settings are changed.
Need Help?
For additional assistance, contact your designated HPE Networking representative.