Help us improve your experience.

Let us know what you think.

Do you have time for a two-minute survey?


组织洞察(测试版)

调查影响 Mist 组织的站点、设备、客户端、隧道、警报、事件、固件等的问题。

查找组织洞察

从Mist门户的左侧菜单中,导航到 Monitor > Service Levels,然后单击 Monitor 页面顶部的 Insights 按钮。默认情况下,将显示“站点见解”页面。选择下拉菜单,然后选择整个组织。

在页面的右上角,您可以在“ 概述 ”和“ 趋势” 选项卡之间切换。

“概述”选项卡

在“见解”仪表板上选择 “整个组织” 后,默认情况下会显示“ 概述 ”选项卡。网络运维中心 (NOC) 用户可以使用“组织洞察概览”仪表板访问显示影响网络的任何潜在问题的单一管理平台。在仪表板的各个部分中,颜色指示为您提供有关来自各个类别的警报的信息。
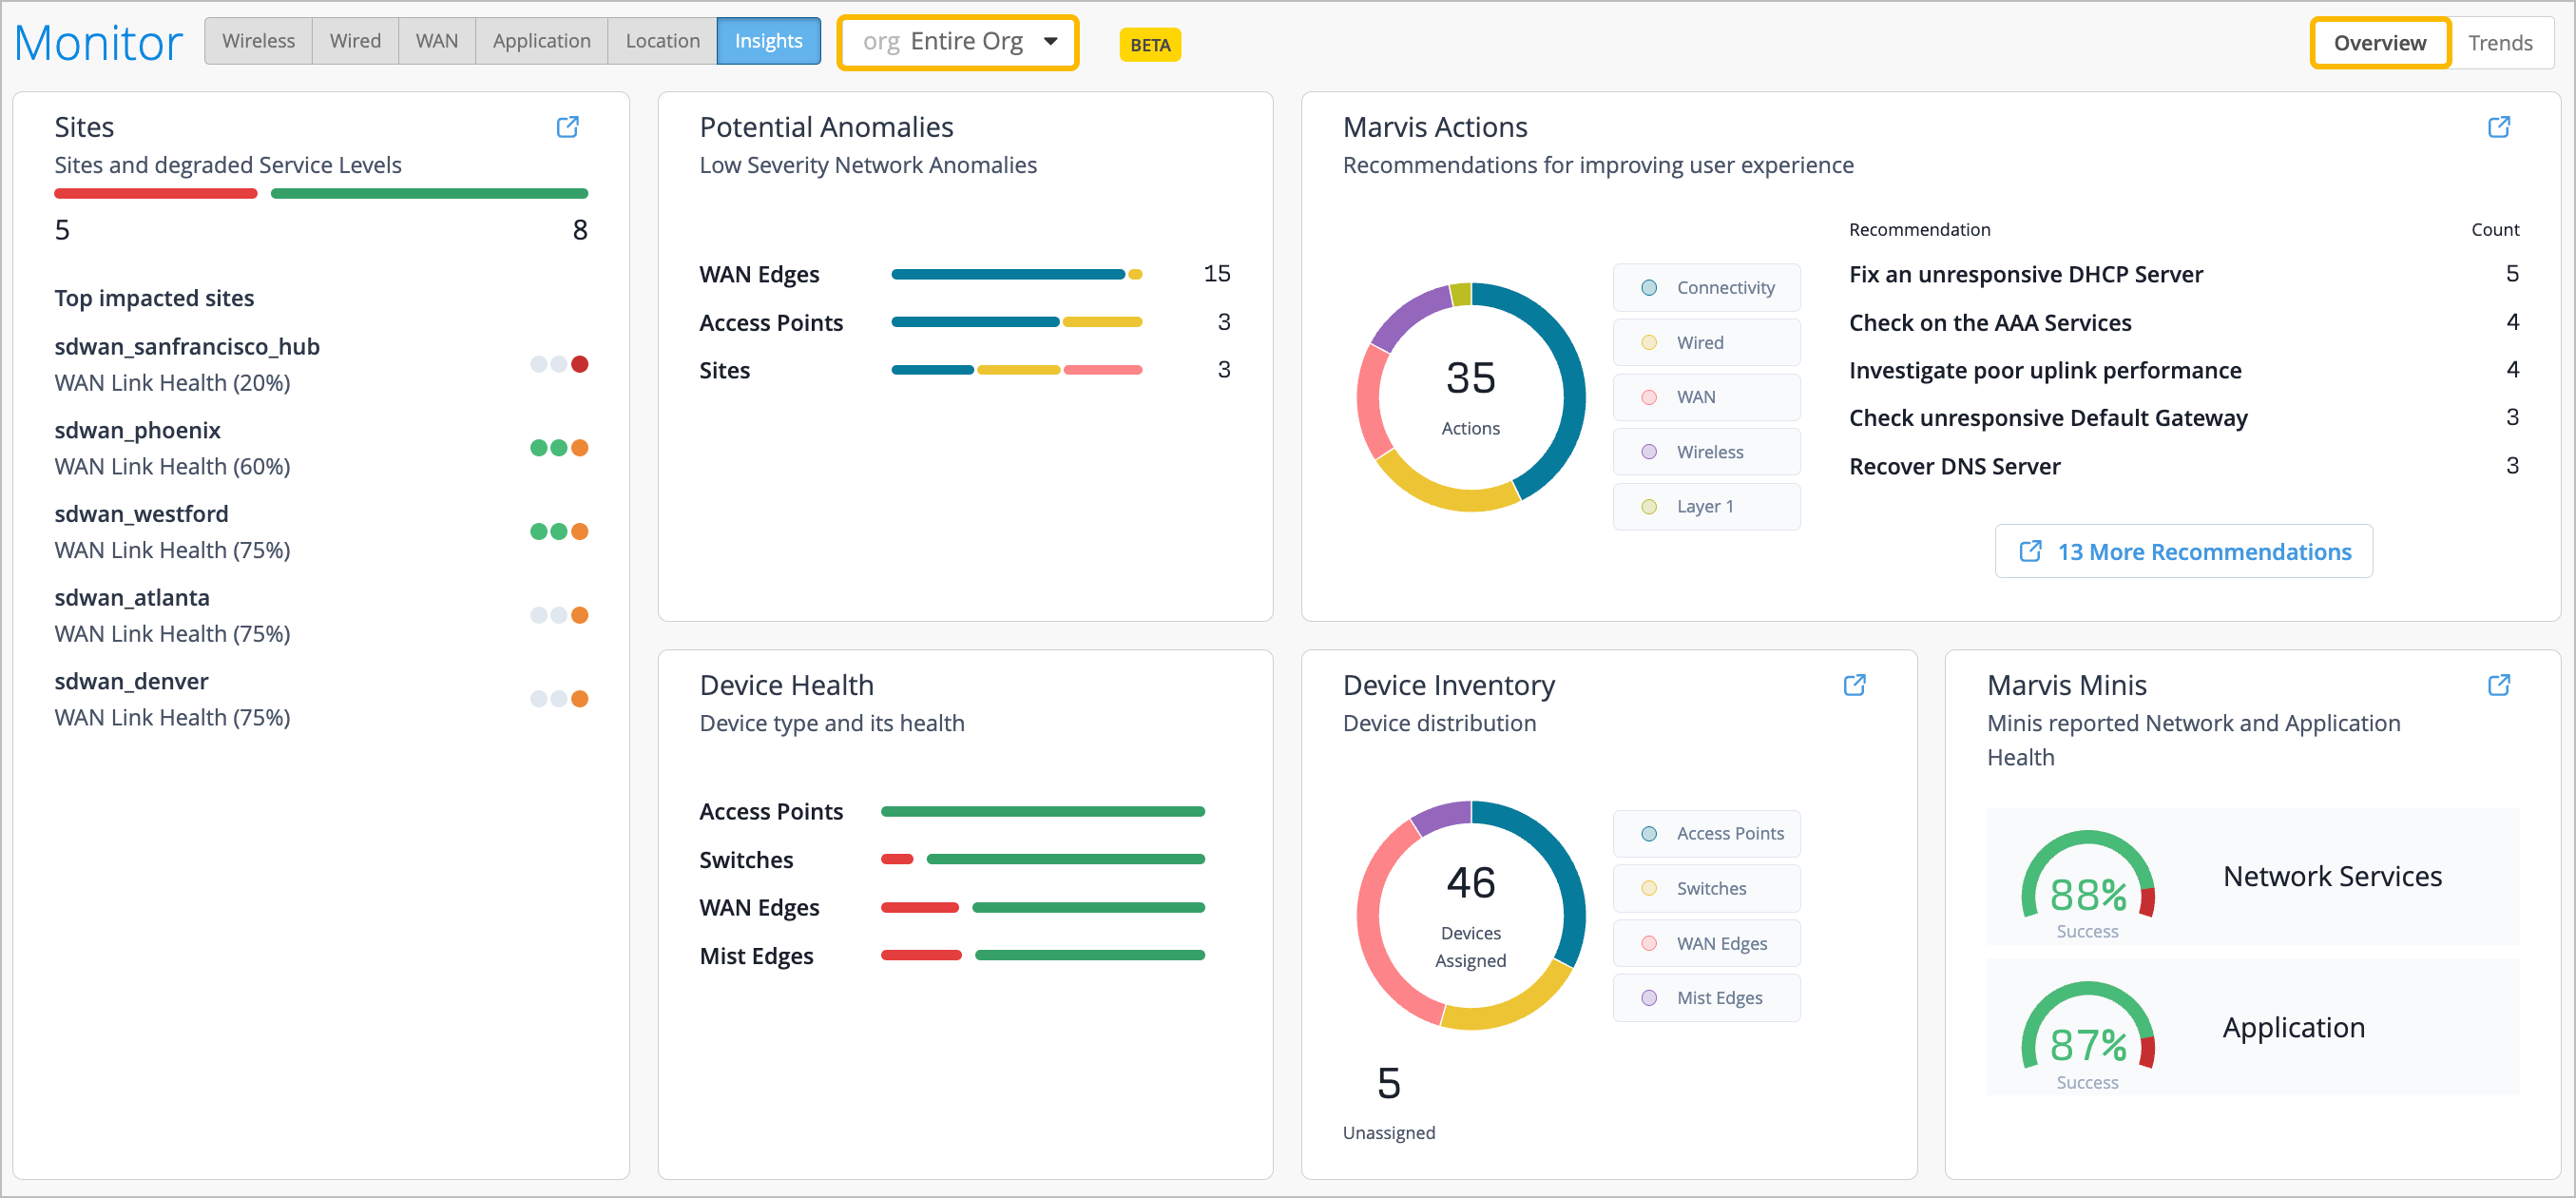
Dashboard interface for network monitoring showing sites with degraded service levels, network anomalies, recommendations for user experience improvement, device health, device inventory distribution, and network application health success percentages.

站点

在“站点”部分中,您可以查看与降级的 WAN、有线和无线运行状况 SLE 相关的前 10 个最差站点。快速浏览以了解 SLE 的运行状况。红色表示 SLE 运行状况低于 60%,橙色表示 SLE 运行状况低于 80%。绿色表示 SLE 运行状况为 100%。

当您从“站点”小部件中单击某个站点时,您将转到该站点的“站点见解”页面。当您单击右侧的颜色编码时,您将被带到相应的 WAN、有线或无线 SLE。
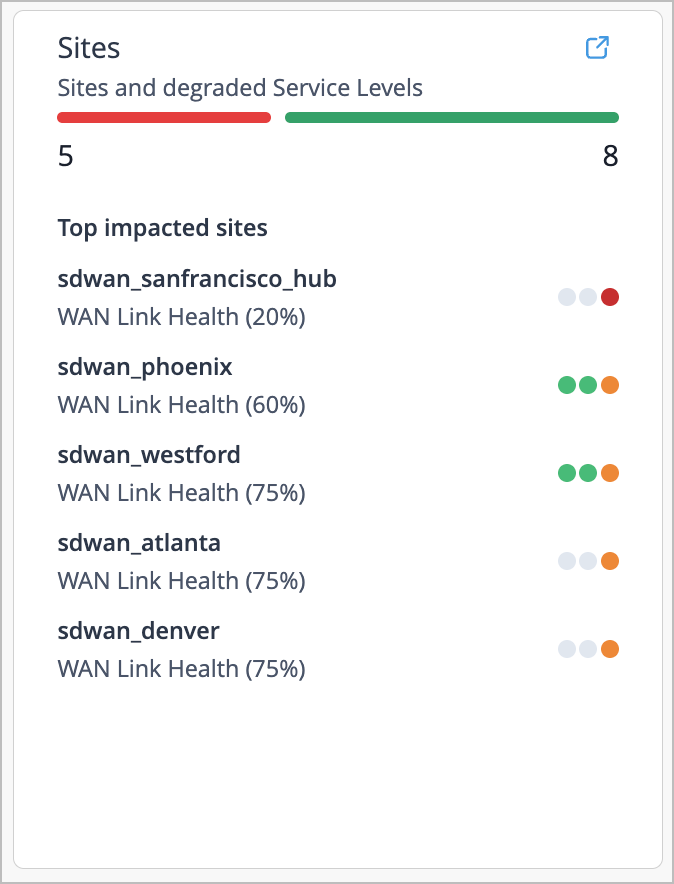
Dashboard showing Sites and Service Levels. 5 sites degraded and 8 healthy. Top impacted sites: sdwan_sanfrancisco_hub at 20 percent health with red indicator; sdwan_phoenix at 60 percent health with green indicator; sdwan_westford at 75 percent health with green indicator; sdwan_atlanta and sdwan_denver at 75 percent health with orange indicators.

如果单击部分顶部行中的红色,则弹出窗口将显示站点及其受影响的 SLE。该窗口按类别组织。
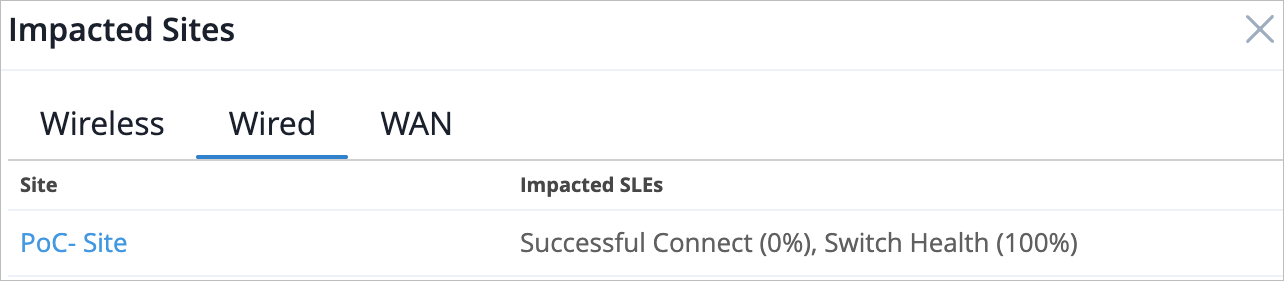
Table titled Impacted Sites with tabs Wireless, Wired selected, and WAN. Columns Site and Impacted SLEs. Entry PoC-Site lists Successful Connect 0 percent and Switch Health 100 percent. Network monitoring dashboard showing SLE status for PoC-Site.

潜在异常

在潜在异常部分,了解组织的低严重性网络异常。您可以查看来自各种类别的警报,例如站点、服务器、ISP、应用程序、接入点、Mist Edge、WAN Edge、交换机、路由器和客户端。
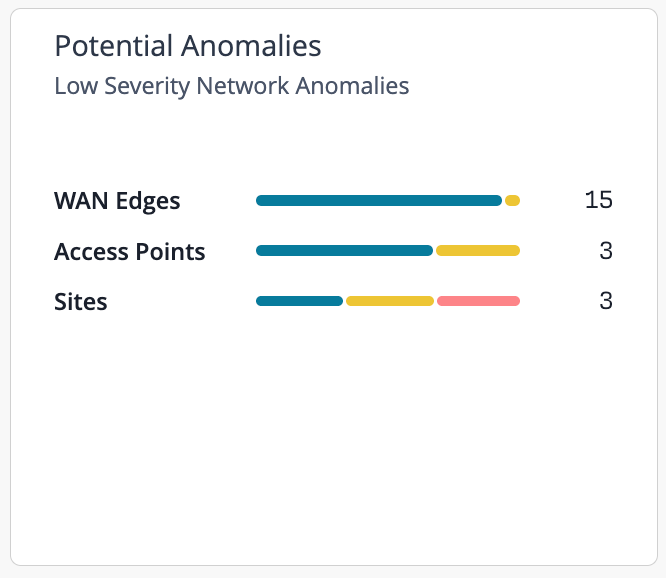
Dashboard titled Potential Anomalies with subtitle Low Severity Network Anomalies showing 15 WAN Edge anomalies, 3 Access Point anomalies, and 3 Site anomalies categorized by severity levels using blue, yellow, and red bars.

单击色线以显示按类别组织的异常详细信息弹出窗口。您可以单击窗口左侧的异常名称,以查看遇到该特定网络异常的受影响站点的列表。
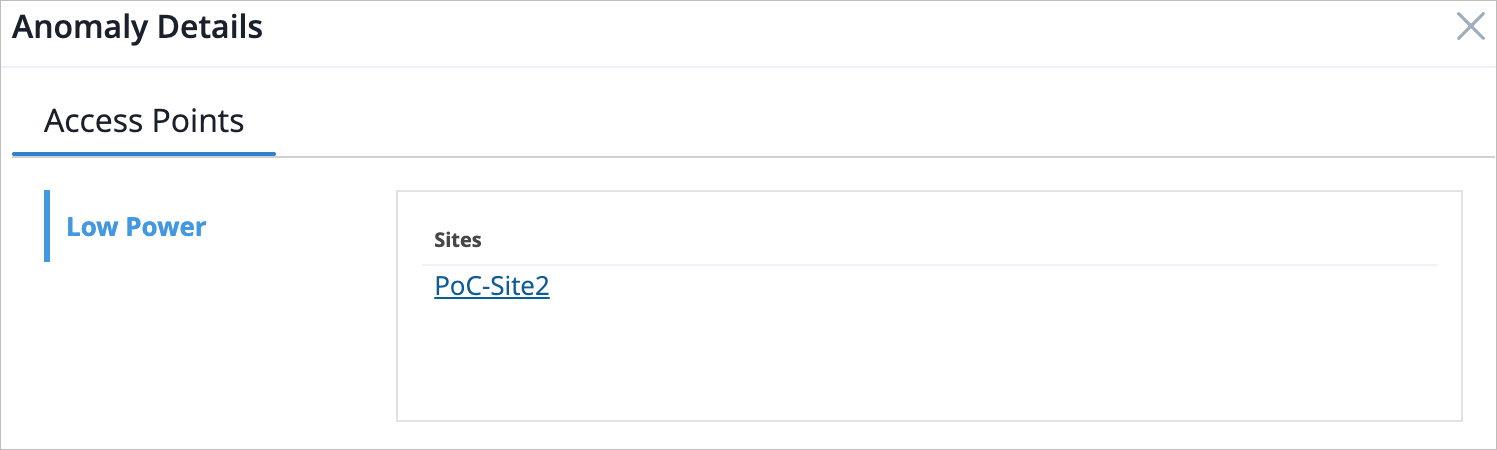
Anomaly Details screen showing Access Points with Low Power and Sites link labeled PoC-Site2, with a close button in the top-right corner.

设备运行状况

在“设备运行状况”部分按设备类型查看组织的总体运行状况。您可以将鼠标悬停在色线上,以查看整个组织的特定类型的设备有多少台处于联机或脱机状态。
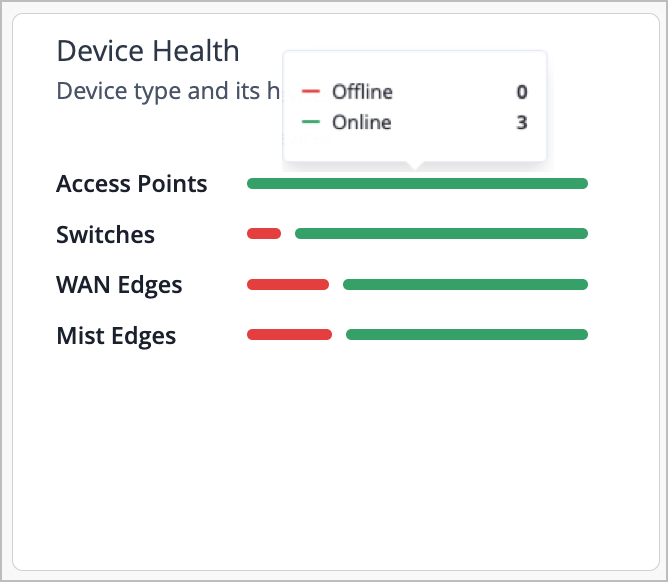
Device Health dashboard showing status of Access Points online, Switches mixed, WAN Edges mixed, and Mist Edges mixed. Total: 0 offline, 3 online.

如果单击设备类型旁边的红色,将弹出一个窗口,其中显示断开连接的设备。您可以看到设备名称、所属站点和 MAC 地址等信息。
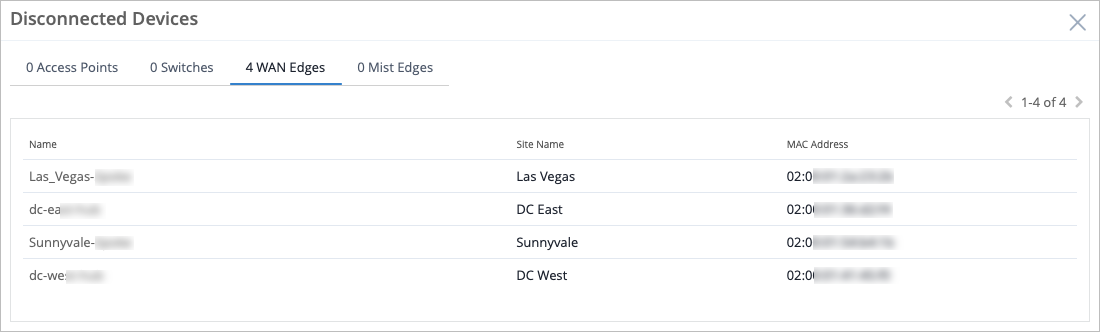
Dashboard showing 4 disconnected WAN Edge devices with names, site locations, and partially blurred MAC addresses. No disconnected Access Points, Switches, or Mist Edges. Page 1 of 4 navigation visible.

Marvis 操作

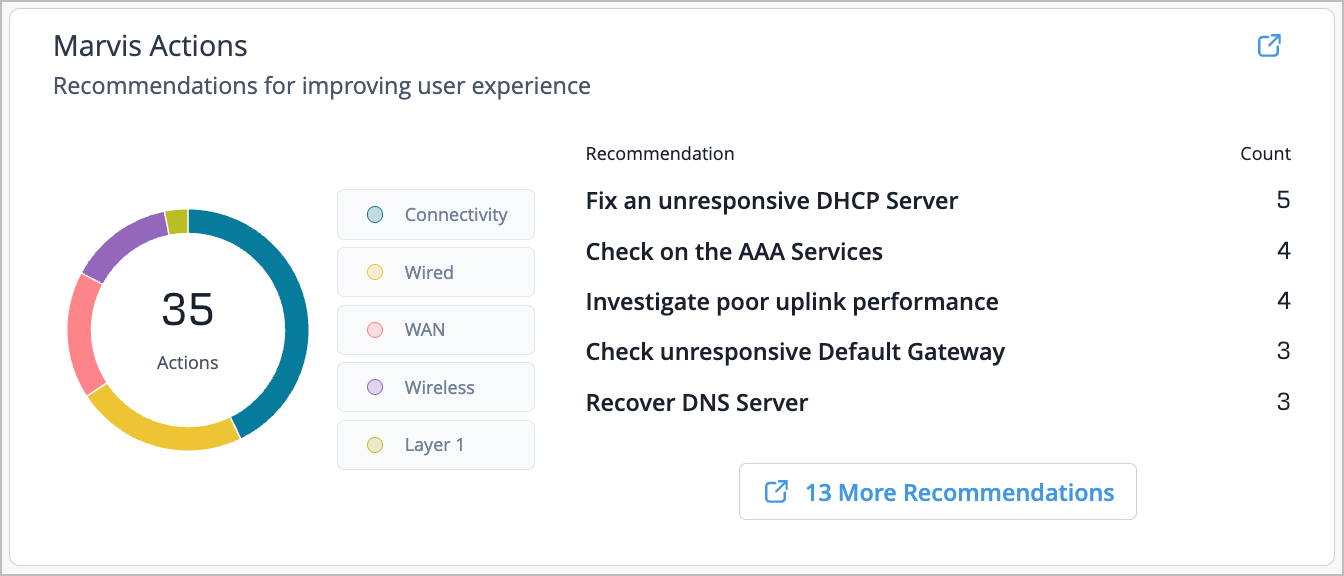
查看有关优化网络性能和改善用户体验的 Marvis 操作建议。显示的类别包括第 1 层、无线、WAN、有线和连接。悬停鼠标可查看贵组织有多少特定类别的 Marvis 操作建议。
注意:只有当您拥有有效的 Marvis 订阅时,信息才会显示在 Marvis 操作部分。

Dashboard titled Marvis Actions showing 35 recommendations to improve network user experience categorized by Connectivity, Wired, WAN, Wireless, Layer 1, with a table listing specific actions like fixing DHCP server issues and investigating uplink performance.

设备清单

在设备清单部分轻松查看设备分布和活动。点击此处,了解 WAN Edge、接入点、Mist Edge 和交换机。快速浏览组织中分配的设备数,或需要分配站点的设备数。悬停鼠标以查看分配给组织的特定设备数量。
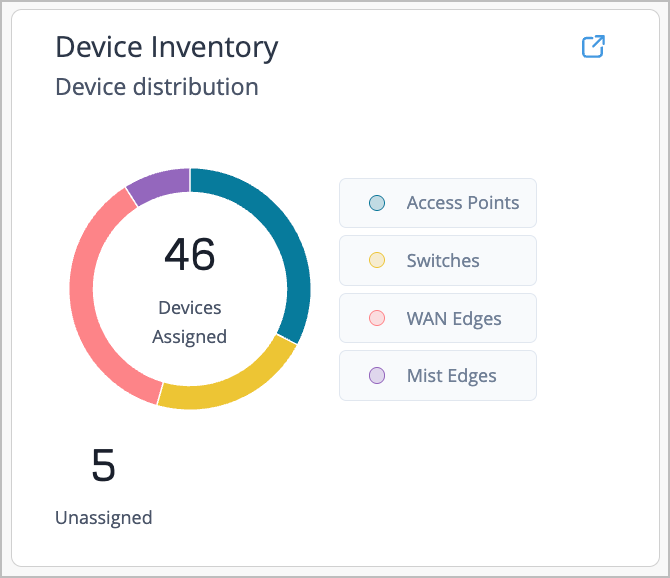
Device inventory distribution dashboard showing a donut chart: 46 devices assigned as Access Points in blue, Switches in yellow, WAN Edges in pink, Mist Edges in purple, and 5 unassigned devices.

Marvis Minis

了解源自 Marvis Minis 网络和应用 SLE 的 Marvis Minis 报告信息。

注意:只有当您拥有有效的 Marvis 订阅时,信息才会显示在 Marvis Minis 部分中。

Marvis Minis 会定期运行验证来评估网络连接和应用可达性,从而检测网络或应用问题,您可以在组织洞察概述的 Marvis Minis 部分一目了然地看到这些问题。有关更多信息,请参阅 Marvis Minis SLE 仪表板(测试版)、网络服务 SLE (Marvis Minis) 和应用服务 SLE (Marvis Minis)。
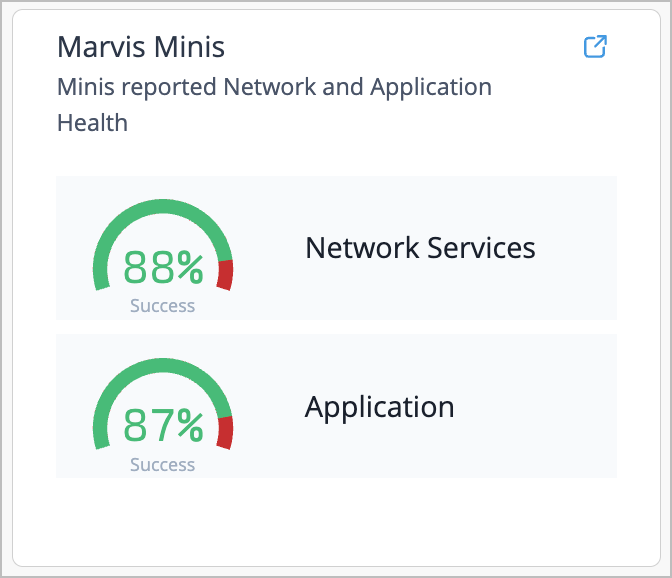
Dashboard titled Marvis Minis showing network services success rate 88 percent and application success rate 87 percent with green progress indicators.

单击部分中的红色以显示 Marvis Minis 报告信息的弹出窗口。“网络服务”选项卡显示遇到网络服务问题的受影响站点。
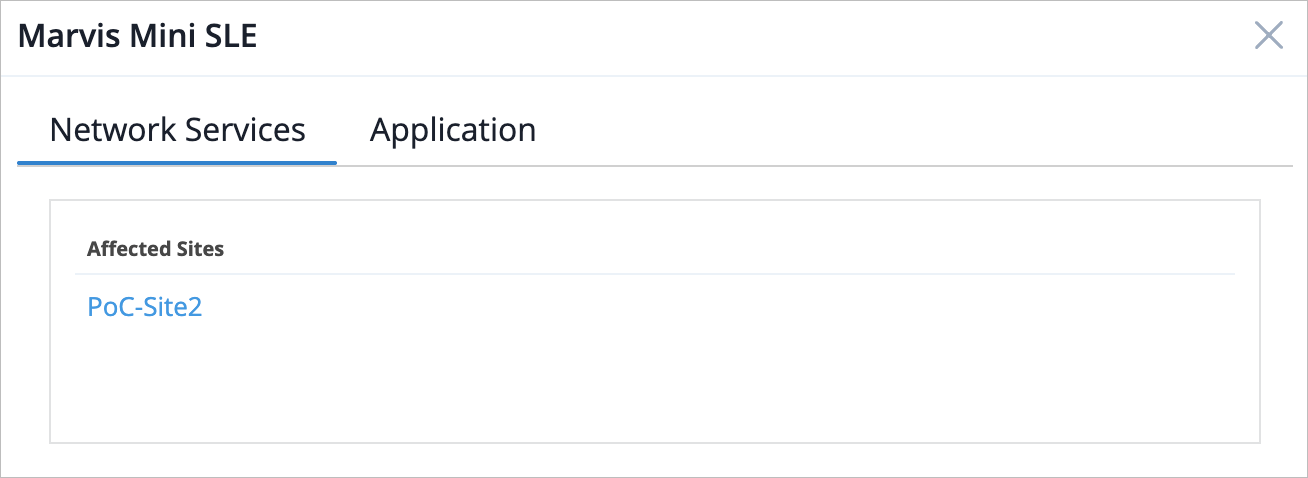
Marvis Mini SLE interface with Network Services tab selected; Affected Sites section lists PoC-Site2 as an affected site.

“应用程序”选项卡列出了受影响的应用程序。您可以单击窗口左侧的应用程序名称以查看每个应用程序受影响站点的列表。
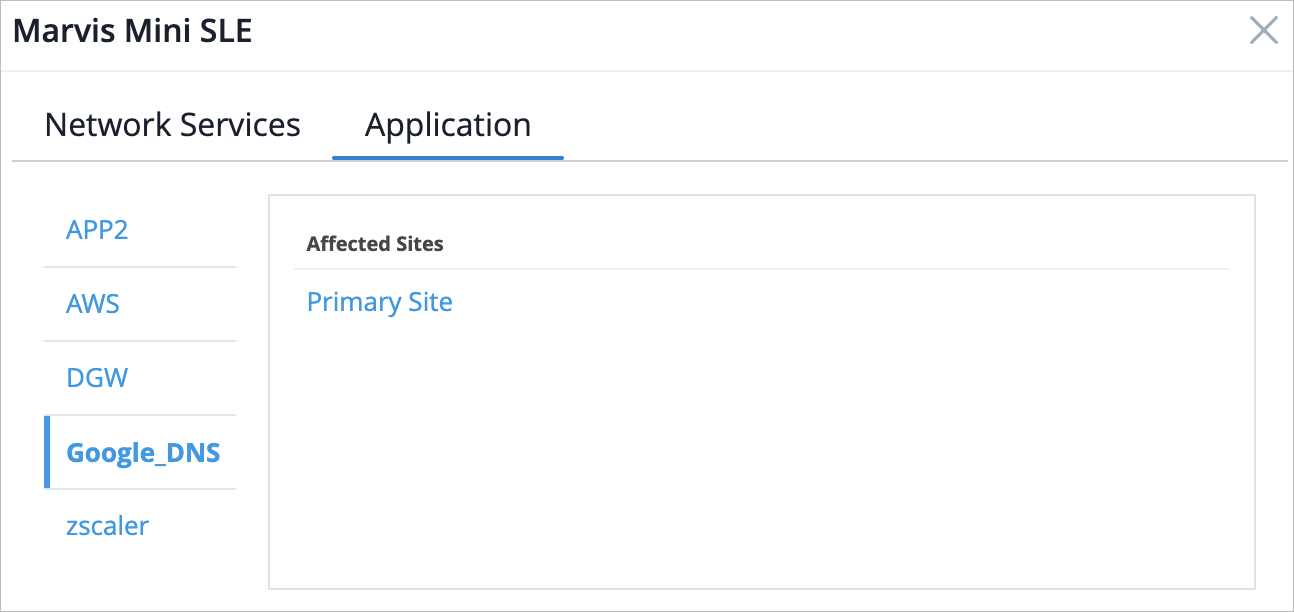
User interface of Marvis Mini SLE with Application tab selected. Google_DNS is highlighted in the services list, and Primary Site is listed under Affected Sites.

“趋势”选项卡

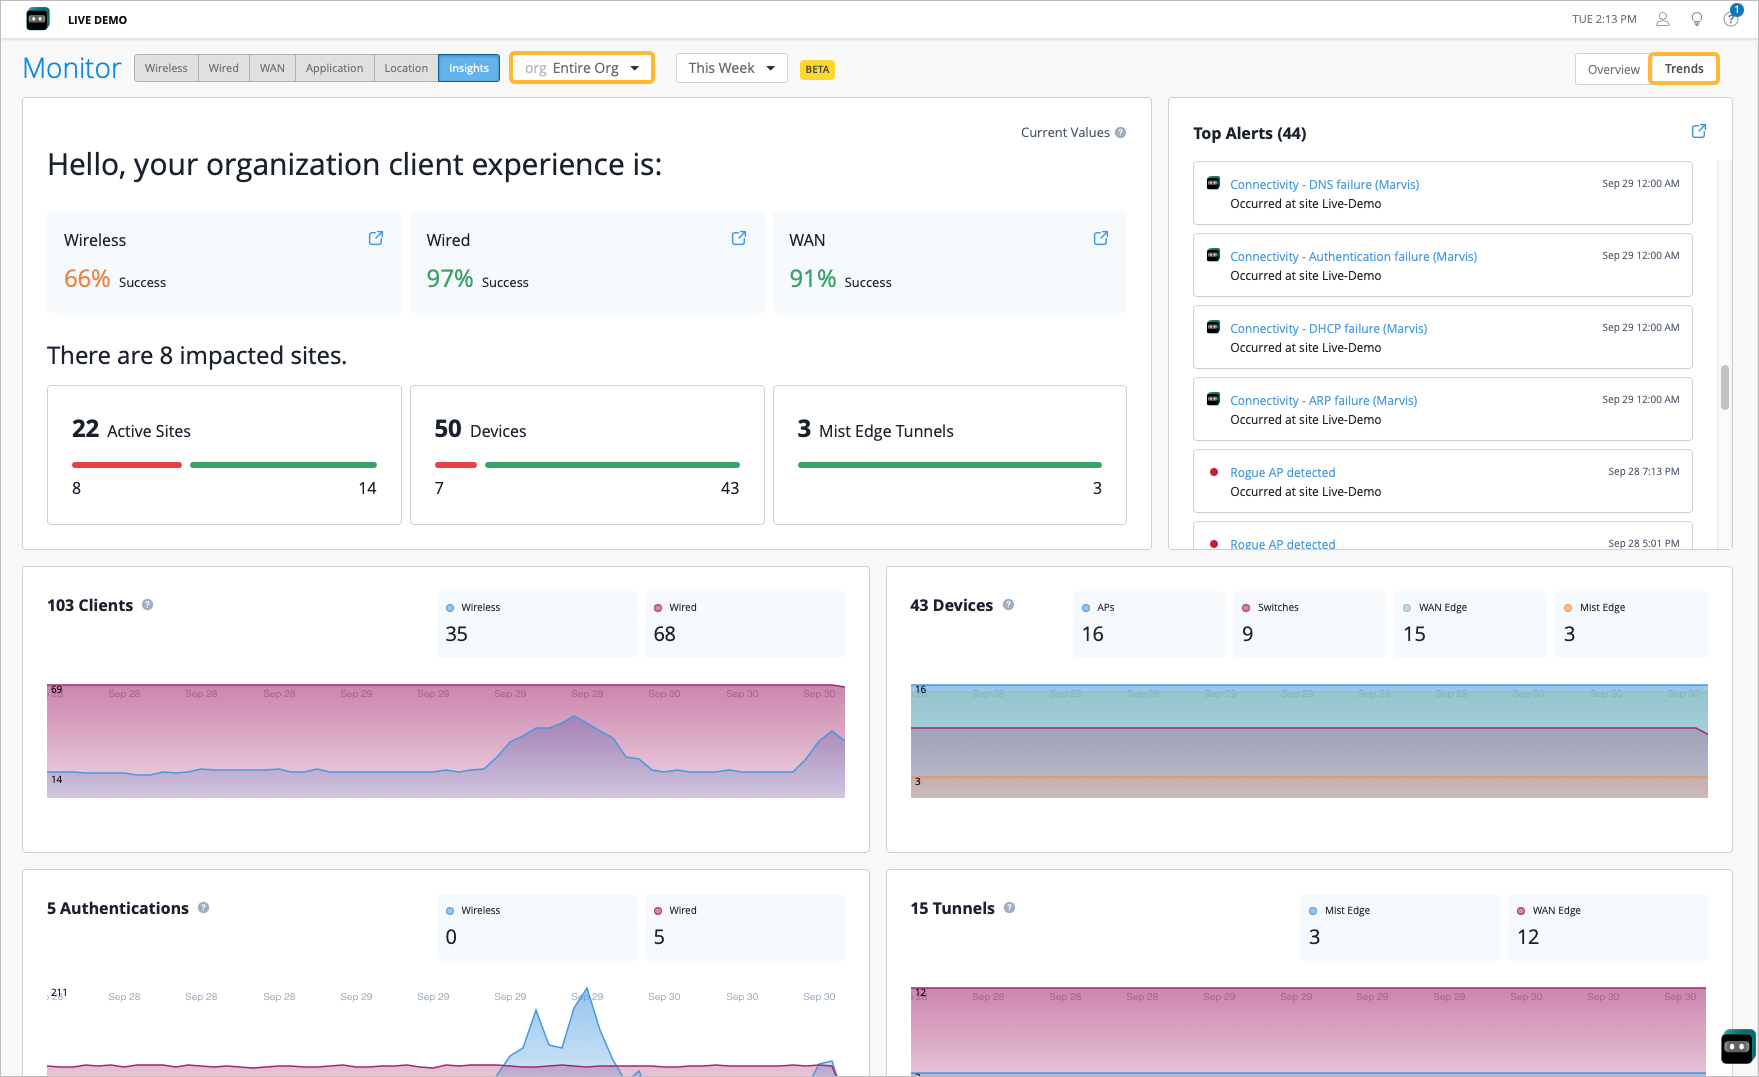
选择“组织见解”页右上角的 “趋势 ”选项卡以查看网络监视指标。快速查看有线、无线和 WAN 的整体客户端体验,或向下滚动页面以查看更多信息和图表。

您还可以选择要查看数据的时间范围。为此,请选择页面顶部的下拉菜单,然后选择所需的时间范围。
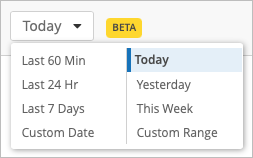
Dropdown menu with date and time range options including Last 60 Min, Last 24 Hr, Last 7 Days, Custom Date, Today highlighted, Yesterday, This Week, and Custom Range. Beta tag displayed.

Network monitoring dashboard showing performance metrics: wireless success rate 66 percent, wired 97 percent, WAN 91 percent; 8 impacted sites and 7 impacted devices out of 22 sites and 50 devices; 44 alerts like DNS, authentication, DHCP issues; 103 clients split into 35 wireless and 68 wired; 43 devices including APs, switches, WAN Edge; graphs display trends in client activity and tunnel performance; navigation allows filtering by organization and time period.

组织客户端体验

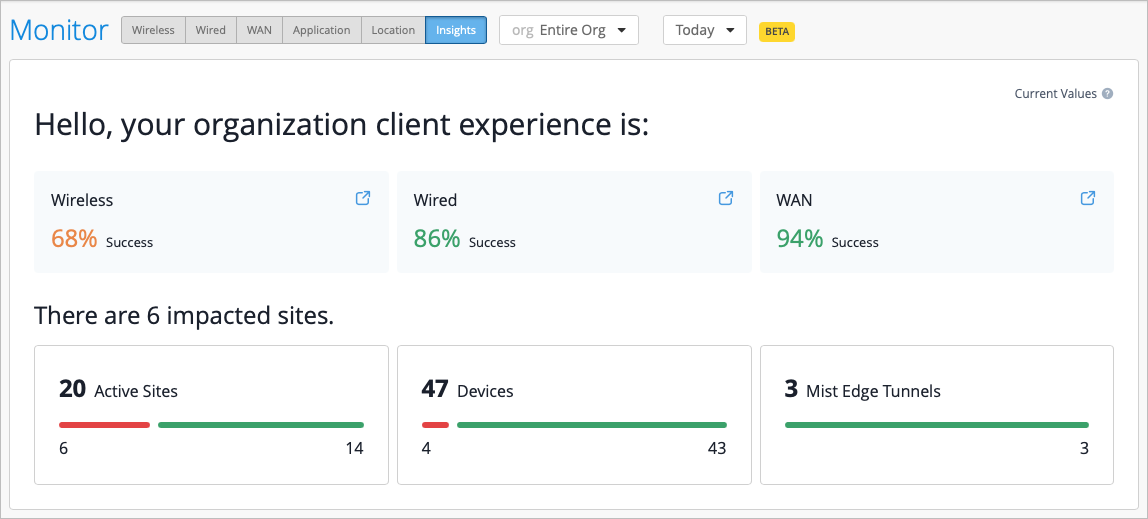
Dashboard interface for monitoring network performance; wireless 68 percent, wired 86 percent, WAN 94 percent, 6 impacted sites, BETA phase.

  • 总体 SLE 运行状况 — 显示无线、有线和 WAN 客户端的总体 SLE 运行状况。SLE 运行状况分数是通过考虑每个 SLE 中最具可操作性的 SLE 子集来计算的。每个小部件中还有一个快捷方式,您可以使用它来跳转到这些 Insights 页面。

  • 活动站点 - 活动站点计数表示服务中的站点数,并列出过去 7 天内有客户端活动的站点。此计数还告诉您组织中在过去 7 天内具有客户端活动的站点数。细分为您提供了每个域中的 SLE 子集具有最佳(以绿色表示)或次优(以红色表示)SLE 的站点数量。每分钟刷新一次。

    选择条形图的红色部分,以显示 SLE 欠佳的受影响站点列表。这将显示受影响的 SLE 和成功百分比。

    Dialog box titled Impacted Sites with three tabs: Wireless, Wired, and WAN. Wireless tab shows a table listing sites wan-vsrx-hub, wan-srx_hub, and sdwan_toronto with impacted SLEs AP Health 0 percent and Successful Connect 0 percent.

  • 设备 - 设备计数可深入了解活动设备总数(过去 14 天内处于活动状态),以及组织级别连接和断开连接设备的进一步细分。

    点按栏的红色部分以打开每个设备类别的断开连接设备列表。
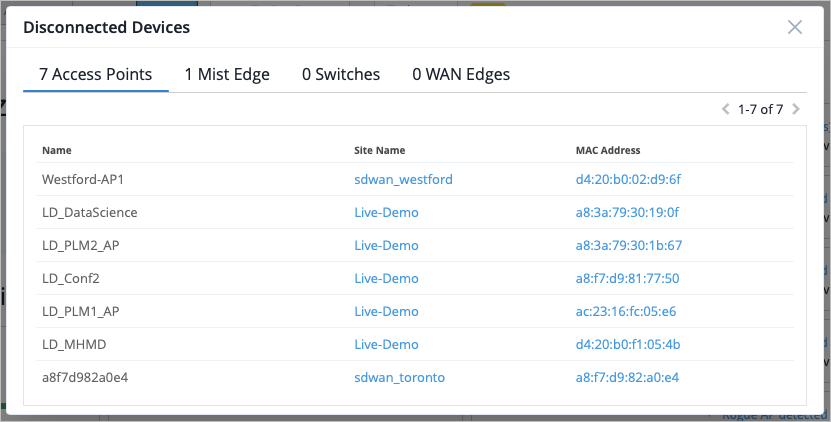
    Network management interface showing 7 disconnected access points, 1 Mist Edge, 0 switches, and 0 WAN edges with device names, site names, and MAC addresses listed.

  • Mist Edge 隧道 — 此计数可深入了解为 Mist Edge 配置的隧道总数。如果单击条形图的红色部分,则可以通过细分查看已配置但当前断开连接的隧道。

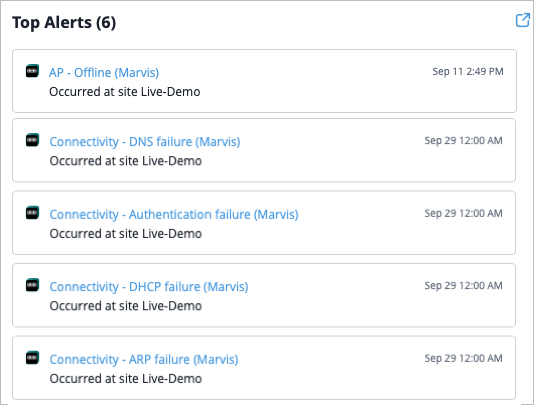
  • 热门告警 — 此部分显示影响最大的告警,可有效减少告警疲劳。此列表中可以显示以下警报类型:

    • Marvis 操作

    • 检测到接入点环路事件

    • WAN 边缘/交换机 DHCP 池已耗尽

    • 关键交换机端口正常/关闭

    • 关键 WAN 边缘端口启动/关闭

    • EVPN 检测到重复的 MAC 地址

      Top Alerts from monitoring system: 6 issues including AP offline, DNS failure, authentication failure, DHCP failure, and ARP failure at site Live-Demo with timestamps.

网络活动概述

这些图表提供了有关网络活动的高级洞察。数据可视化反映了选定时间段内的系统状态和使用模式。图形通过 API 和 WebSockets 更新。

  • 客户端 — 此图反映每个有线和无线保证的最新客户端数。这些数字每分钟通过 WebSockets 更新一次。图表本身显示无线和有线用户的客户端连接,并每 10 分钟自动刷新一次。图表最多可能需要 5 分钟才能显示趋势的大幅下降。
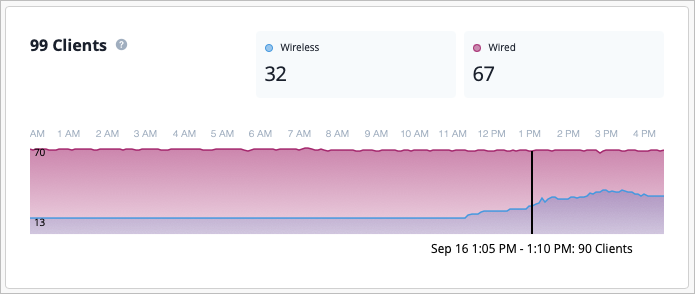
    Graph showing network client connections from 1 AM to 4 PM, with 32 wireless clients in blue and 67 wired clients in pink at 1:05 PM, totaling 90 connections.

  • 设备 - 显示连接云的有线、无线和 WAN 设备的最新数量。这些数字通过 WebSocket 每分钟更新一次,最多可能需要 5 分钟才能表明趋势大幅下降。该图表本身显示了接入点、交换机、WAN Edge 和 Mist Edge 的设备云连接。它每 10 分钟自动刷新一次。
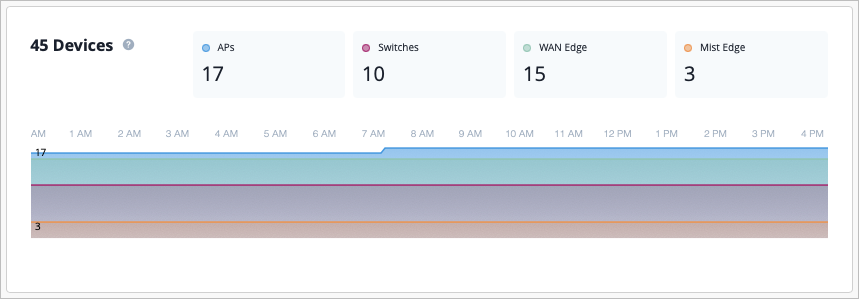
    Dashboard showing 45 network devices categorized as APs 17, Switches 10, WAN Edge devices 15, Mist Edge devices 3, with a time-based graph from 12 AM to 4 PM displaying device counts by type using distinct colors.

  • 身份验证 — 显示有线和无线客户端上成功身份验证事件的当前速率。这些数字通过 WebSockets 每分钟更新一次。该图表本身显示了基于所选时间每小时 5 分钟有线和无线客户端成功身份验证事件的趋势。它每 10 分钟自动刷新一次。
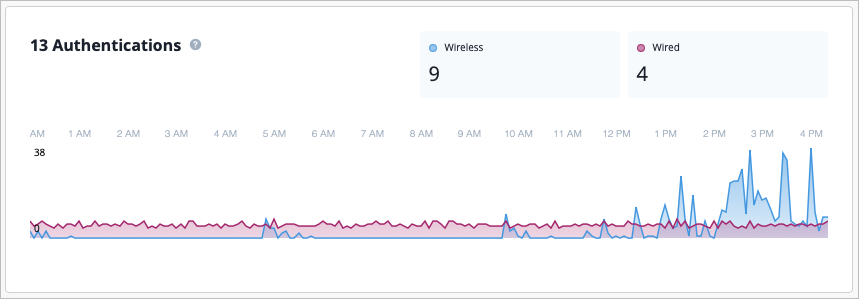
    Graph showing authentication data over time with 13 total authentications: 9 wireless and 4 wired. Wireless authentications increased after 12 PM; wired remained steady.

  • 隧道 - 显示 Mist Edge 和 WAN Edge 的当前隧道数。这些数字每分钟通过 WebSocket 更新一次。在图表中,您可以看到基于所选时间每小时 5 分钟 Mist Edge 和 WAN Edge 的活动隧道事件的聚合趋势。它每 10 分钟自动刷新一次。
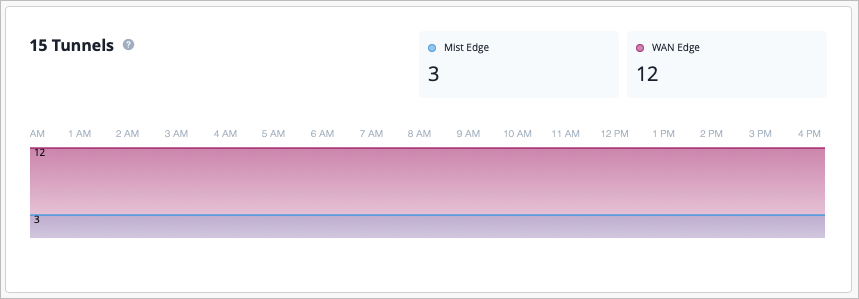
    Graph showing 15 network tunnels over time; 3 Mist Edge in blue and 12 WAN Edge in pink, from 12 AM to 4 PM.

  • 警报 - 显示所选时间段内的警报总数,包括最新数量的安全性、基础架构和 Marvis 警报。在图表中,您可以看到在特定时间点发生了哪些类型的警报。
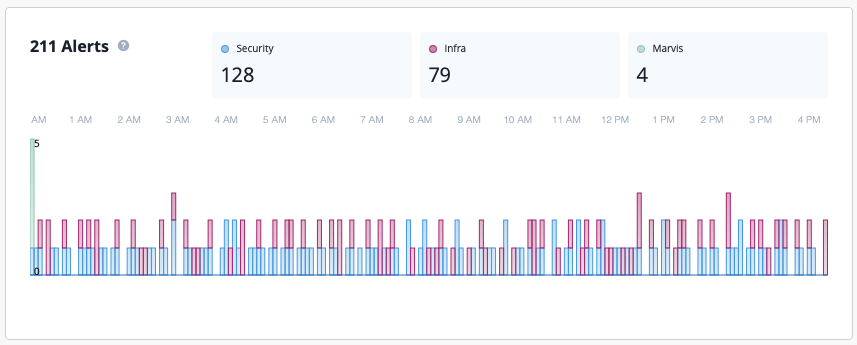
    Dashboard showing 211 alerts categorized as Security 128 in blue, Infra 79 in pink, Marvis 4 in green, with a bar chart displaying alert distribution from 1 AM to 4 PM.

  • 事件 - 显示选定时间段内当前基础架构和客户端事件的总数。图表通过 API 更新,UI 每 10 分钟刷新一次。
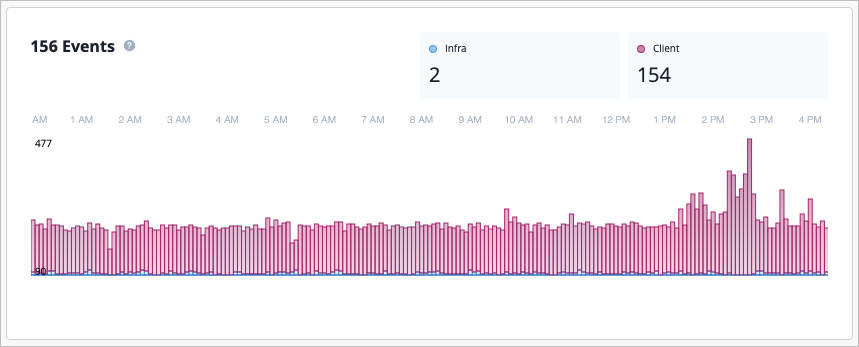
    Bar chart showing 156 events from 12 AM to 4 PM. Client events in pink peak at 154 around 3 PM. Infra events in blue remain minimal at 2 throughout.

固件概述

固件部分提供了按设备类型、固件版本和硬件型号细分的设备固件部署的详细明细。网络工程师和 IT 管理员可以使用固件部分来监控固件一致性、确定升级机会以及确保整个无线基础架构的最佳性能。
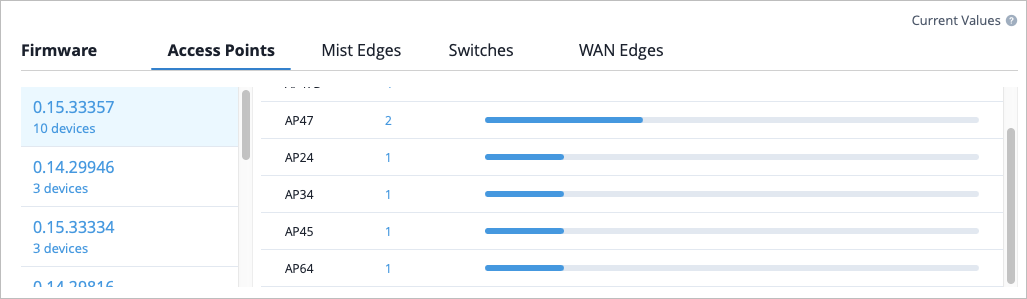
Network management interface showing a table with columns for firmware versions, access points, Mist Edges, switches, and WAN Edges, displaying device metrics and statuses.

您还可以单击“设备计数”列中的数字以查看一个弹出窗口,其中包含设备信息,例如设备名称、MAC 地址和设备所属的站点。
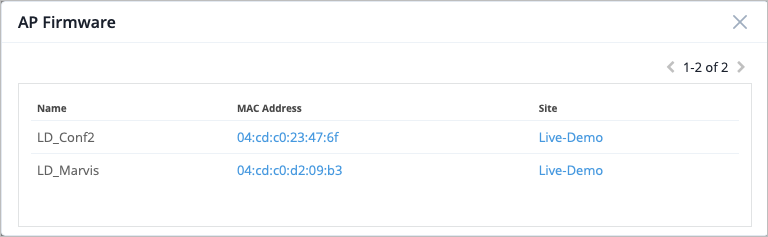
Table titled AP Firmware with columns Name, MAC Address, and Site. Entries: LD_Conf2, 04:cd:c0:23:47:6f, Live-Demo; LD_Marvis, 04:cd:c0:d2:09:b3, Live-Demo. Displaying 1-2 of 2 entries. Close button at top-right corner.