Application Services SLE (Marvis Minis)
Use the Application Services SLE to assess the performance of applications and the impact of the LAN and WAN connectivity on the application performance.
Marvis Minis runs validations using curl tests to assess application reachability and network connectivity issues. These tests help determine if an application server is responsive and accessible. Applications are constantly monitored, with classifiers being triggered at the first sign of latency or reachability issues.
The Application Services SLE provides insights into the reachability of applications based on the Marvis Minis validations. If an application is down or unreachable, the SLE can provide insights into potential network connectivity issues or server downtime. The SLE provides more granular visibility across the application, LAN, and WAN domains
Classifiers
The Application Services SLE classifiers help distinguish whether an application is reachable or whether the application performance is degraded due to network latency.

-
Application—Indicates that the issue is isolated to a specific application or service, while the network path to the destination remains healthy. This classifier helps distinguish application-level problems from broader network connectivity issues.
-
Reachability—Indicates unsuccessful HTTP requests or complete packet loss based on the validation data. Marvis Minis verifies application reachability by using default Internet connectivity URLs. You can also define custom URLs/FQDNs in the organization or site settings. See Add Custom URLs for Marvis Minis Validation .
Marvis Minis considers an application as reachable if the response status code is either 200 (OK) or 408 (for default apps).
-
Latency—Lists the number of attempts when the application response is slow due to latency. The latency can be caused due to a network issue or an issue with the application. The latency is computed based on curl tests and comparison with a rolling baseline over the past 14 days.
-
Services—Lists application-level service degradation issues such as slow or non-responsive applications. This classifier focuses on scenarios where the application itself is unresponsive or underperforming even though the network path is functioning normally.
-
-
LAN—Indicates that the issue is on the local network, specifically between the user’s device and the local gateway. This classifier covers problems related to local connectivity or switching within the LAN environment. This classifier has the following sub-classifiers:
-
Loss
-
Latency
-
-
WAN—Indicates that the issue lies outside of the local network, specifically between the local gateway and the destination. This classifier includes problems related to external connectivity, ISP links, routing across wide-area networks, or upstream network disruptions. This classifier has the following sub-classifiers:
-
Loss
-
Throughput
-
Latency
-
Root Cause Analysis for the Application Services SLE
You can use the information across the following tabs that display when you click ˅ beside Application.
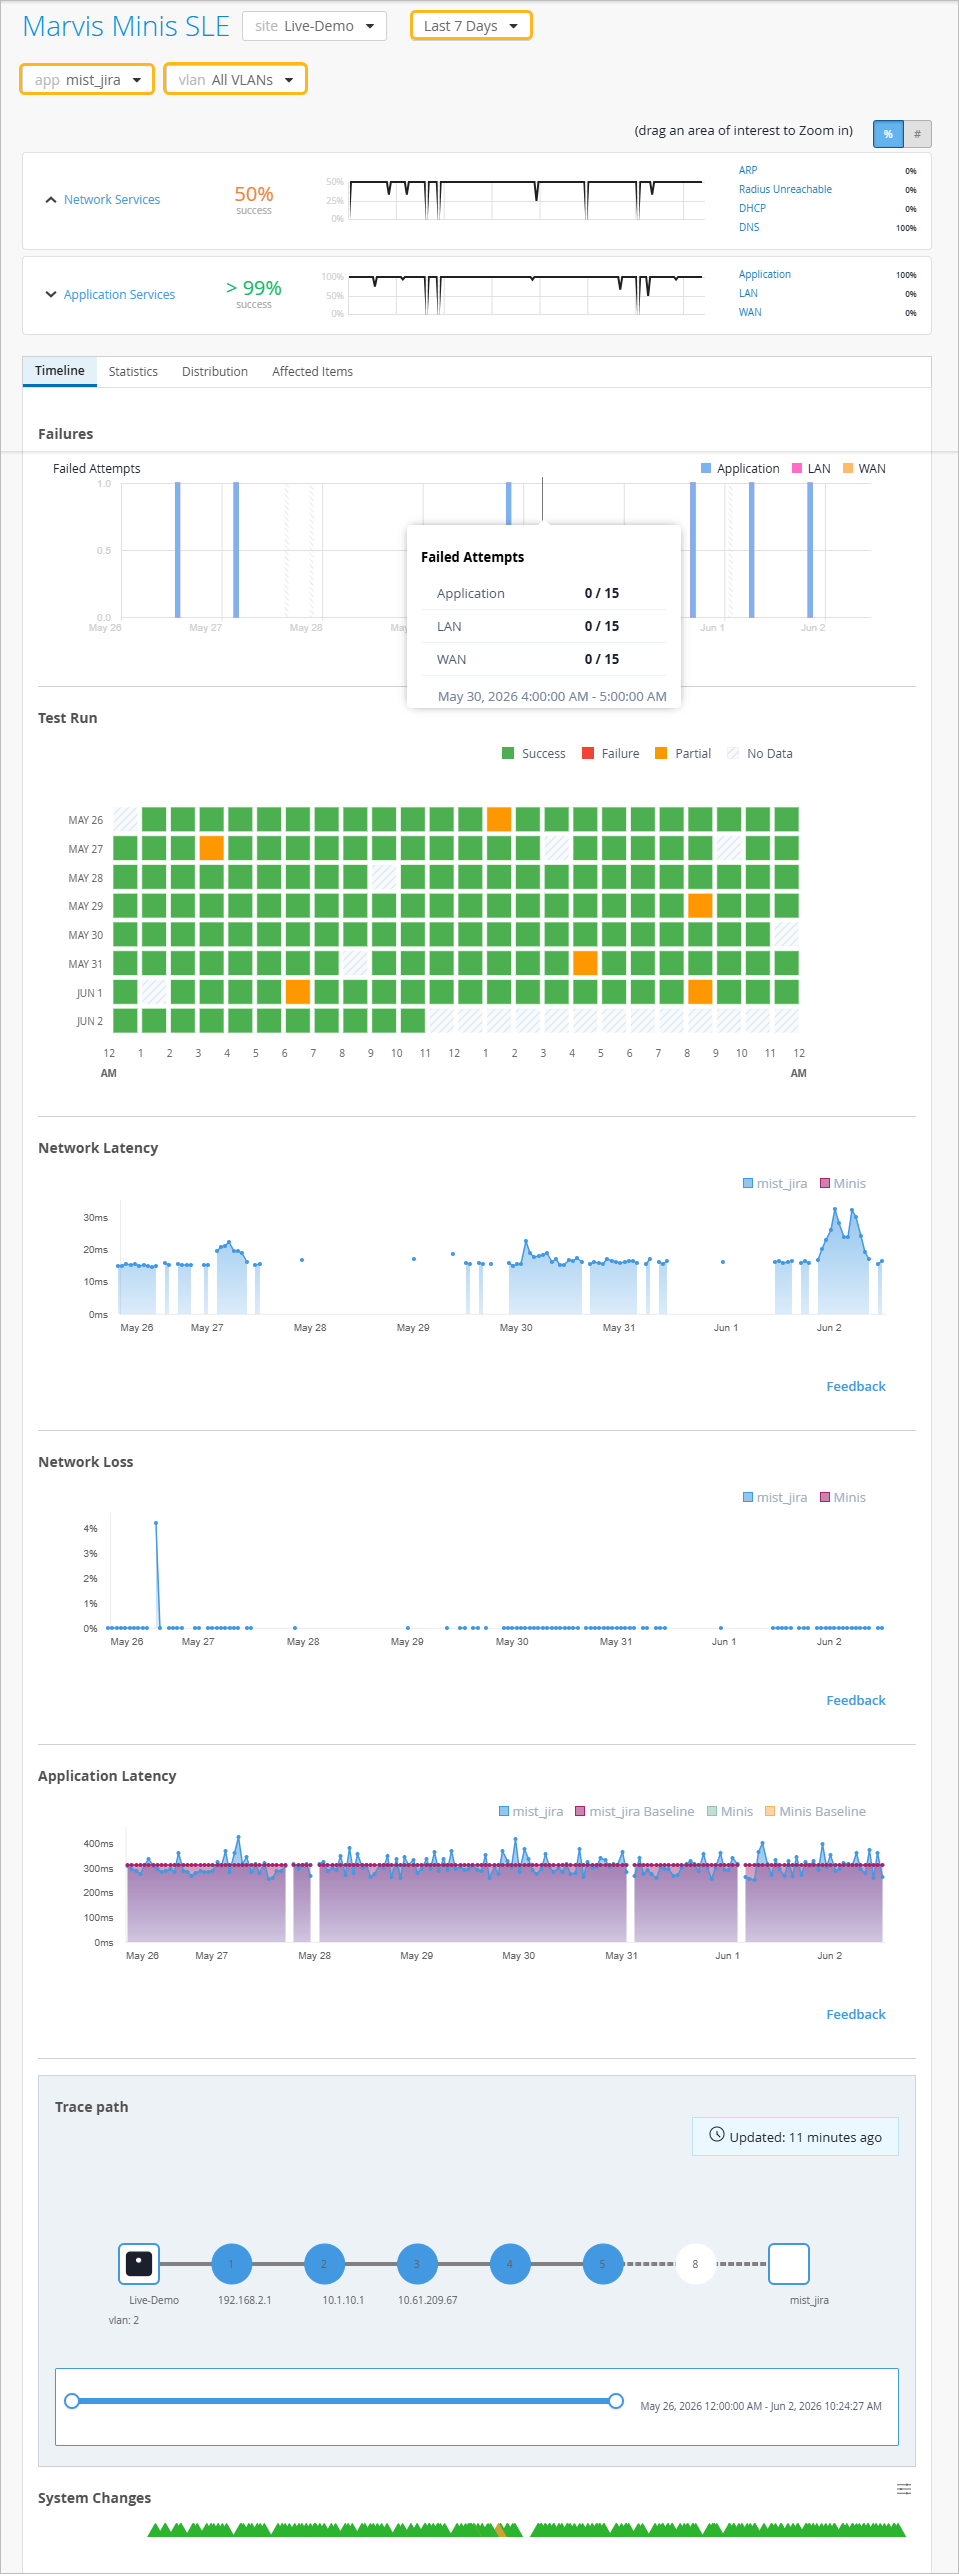
Timeline—See exactly when the issues occurred and whether the issues relate to application reachability, network latency, or Internet services.
Here is an example of how Marvis displays the timeline for the Application Services SLE. You can view the total number of attempts and the number of failed attempts for a specific date and time by hovering over the Failures graph. In this example you can see that a total of 78 attempts were made to connect to the network on March 24 of which 4 attempts failed due to network latency and 1 attempt failed due to issues with the Internet services.
The checkerboard chart provides a quick visual summary of hourly validation test outcomes. You can view the chart for a selected timeline, classifier and delve into the specifics of each individual test for more detailed insights. You can also view the chart for a specific application or VLAN.
Note:Note that the chart is visible for the Application Services SLE only at the site level.
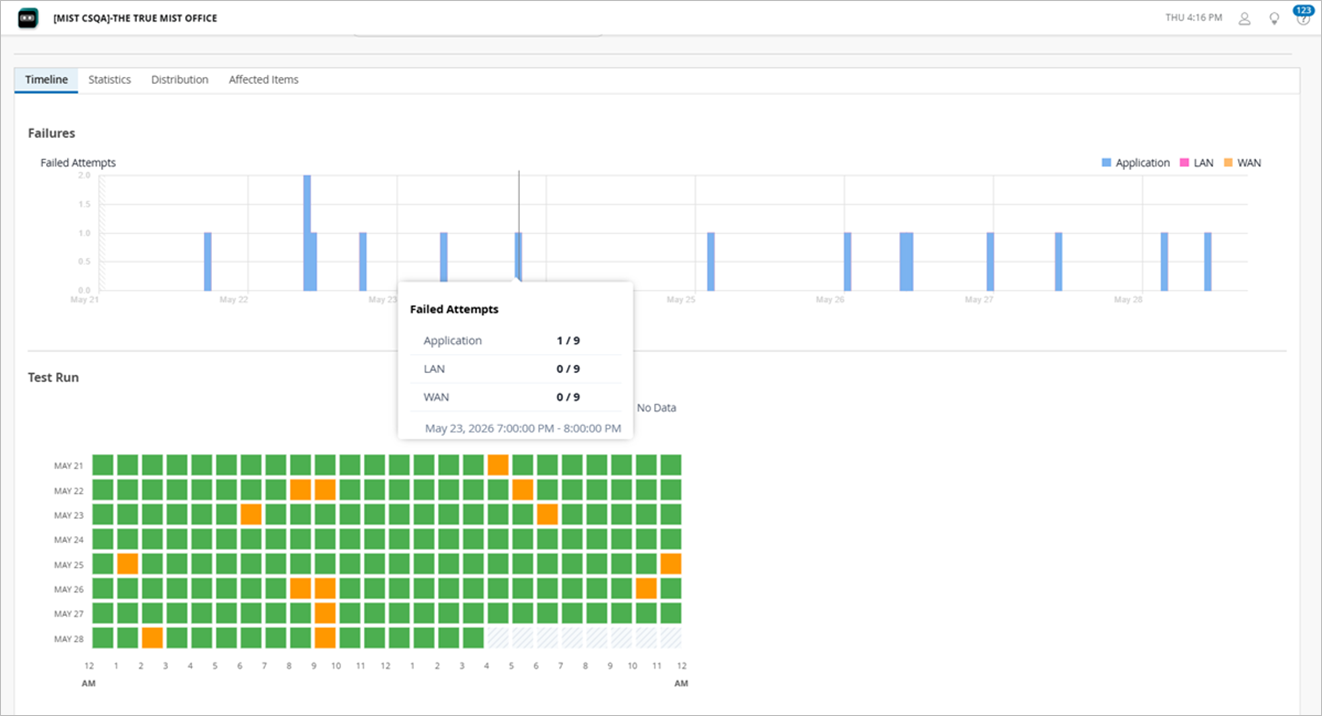
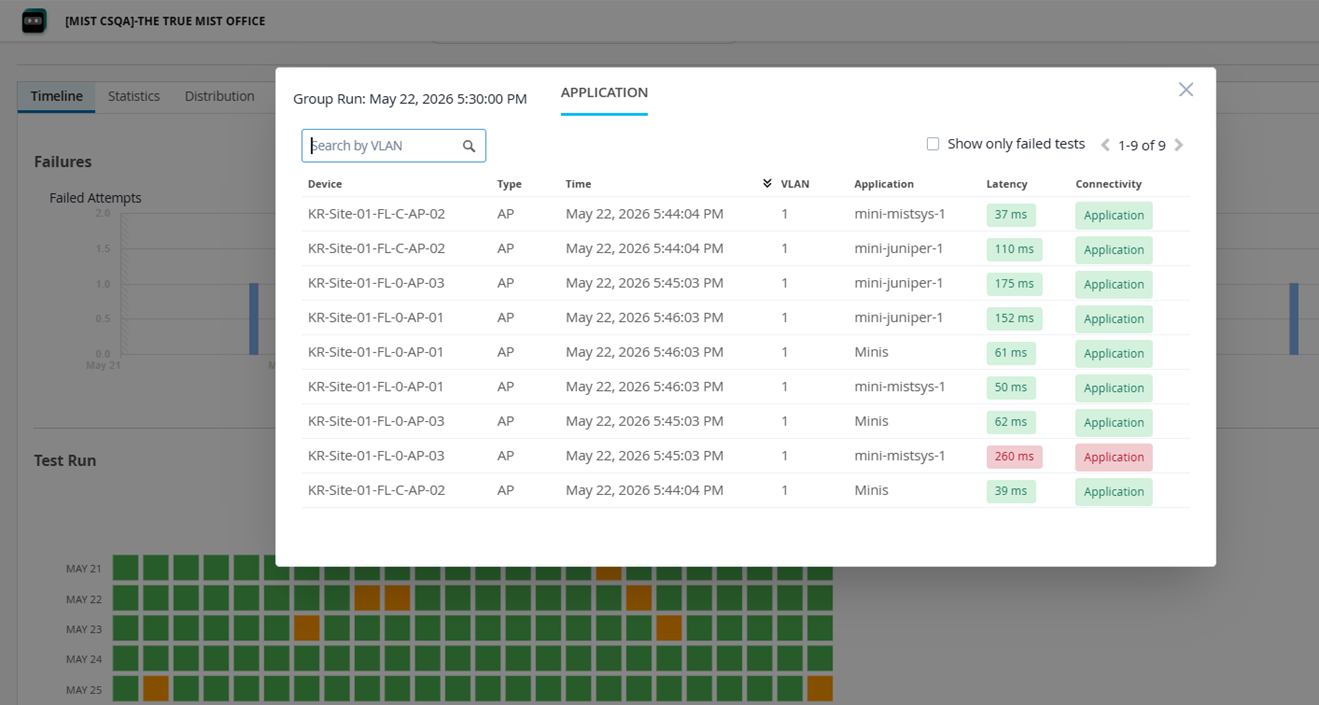
Every cell on the checkerboard chart represents data from an hourly validation. By clicking on a cell, you can view the details of the tests executed, including its results for each classifier. If you want to view details of only the failed tests, select the Show only failed tests check box.
-
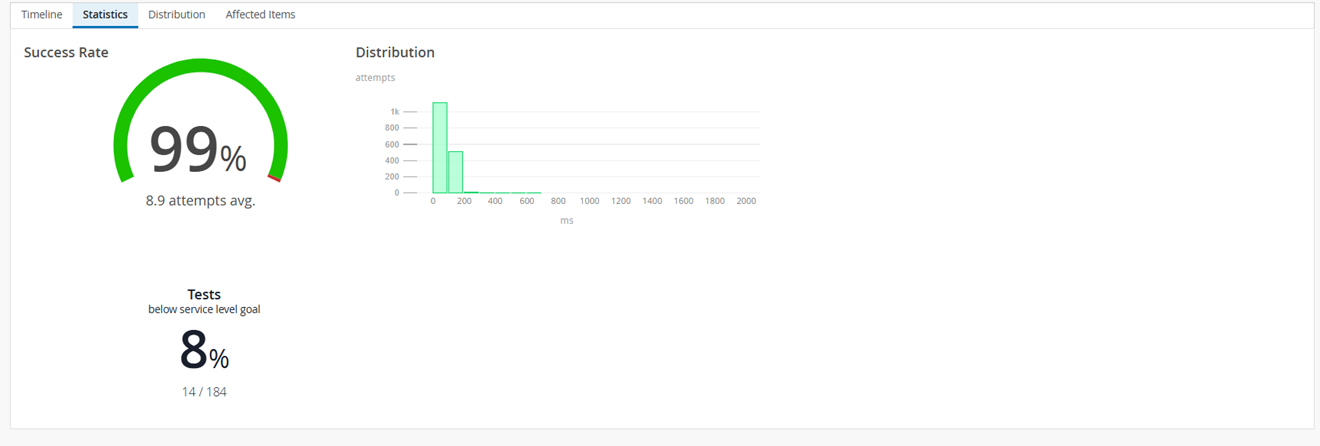
Statistics—See the success rate, number of sites experiencing failures and the latency information. The Distribution graph indicates the latency. In this example, you can see that ~1000 connection attempts experienced a latency of up to 200 ms.
-
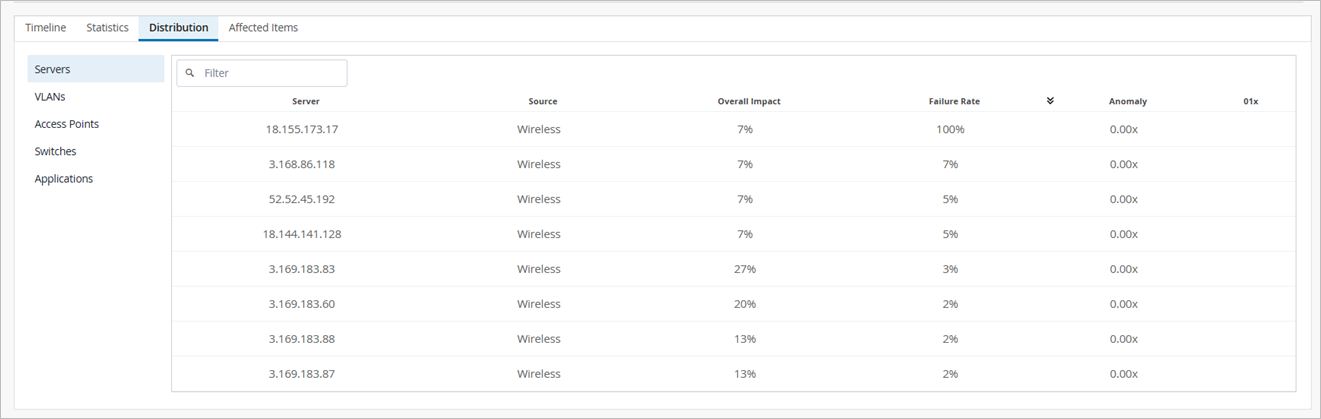
Distribution—See which switches, APs, and VLANs were affected. The Source column indicates the source of the test (wireless or wired)—which indicates whether the tests were run on an AP or a switch.
-
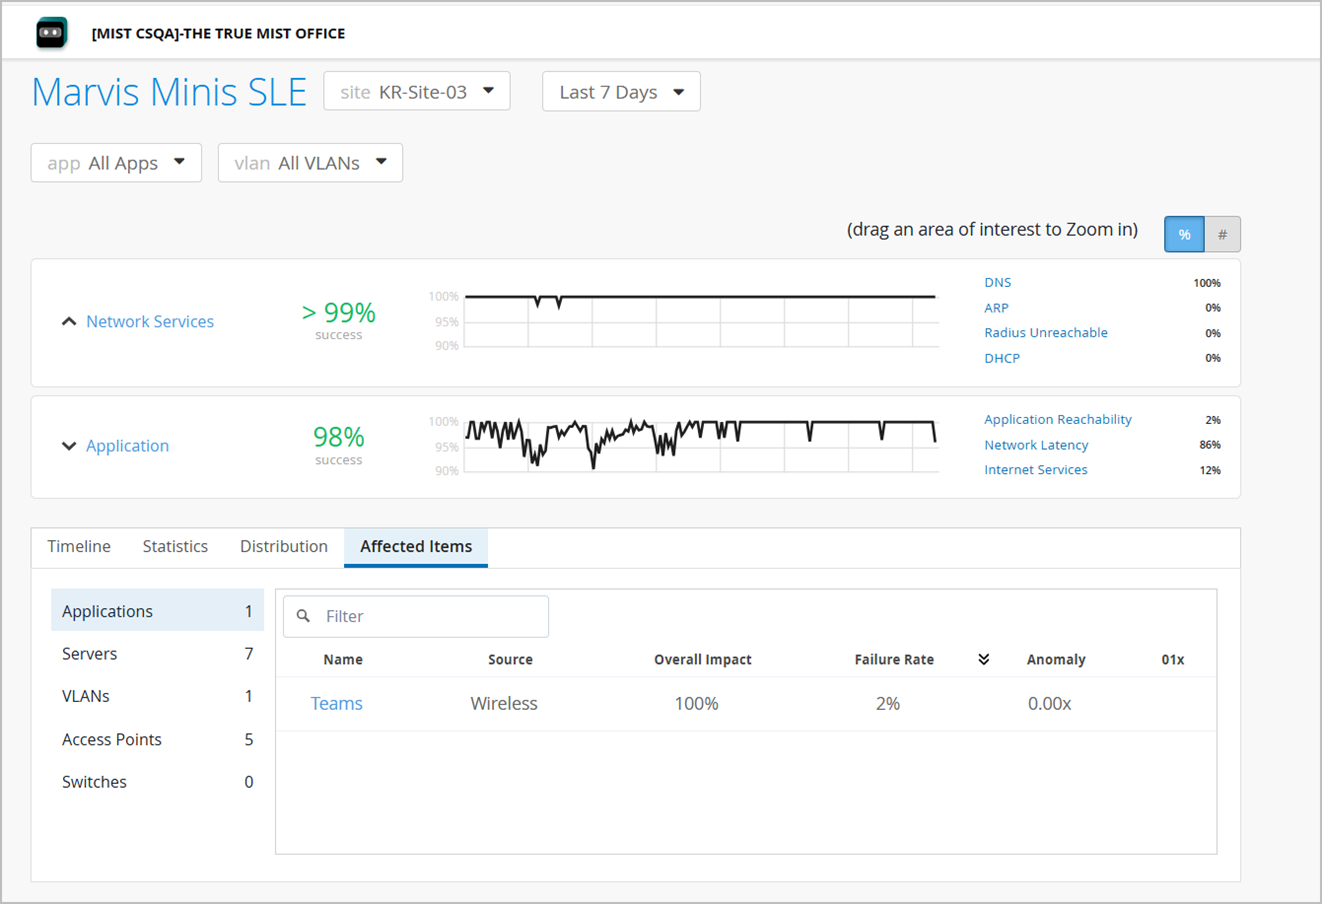
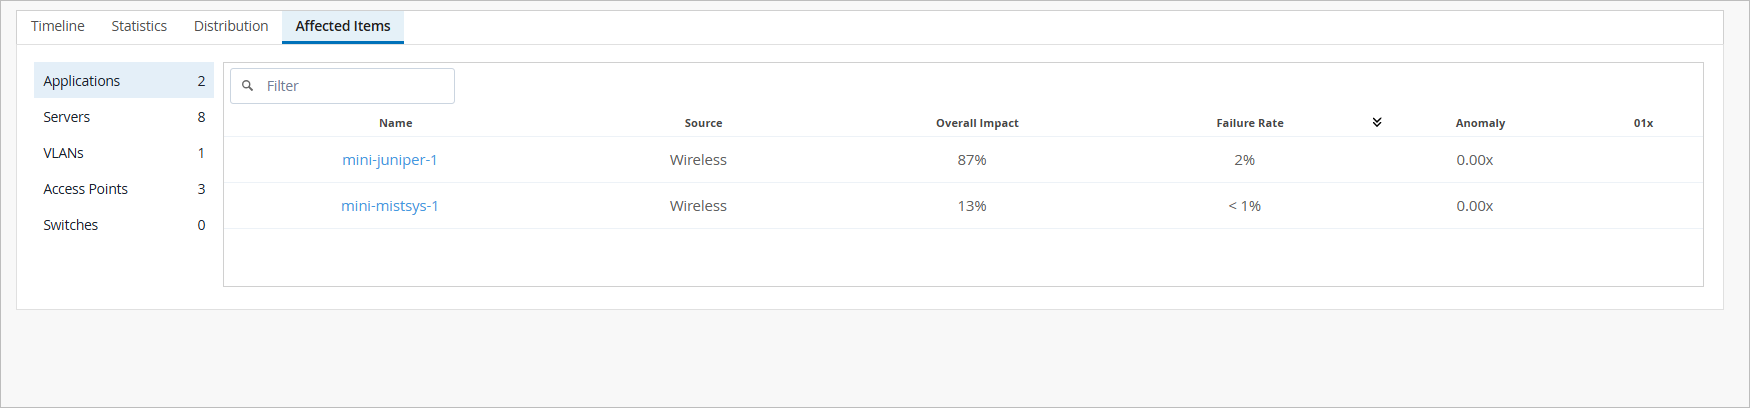
Affected Items—See which applications were affected and how much each one contributed to the overall impact. Also see the individual failure rate for each application. The Source column indicates the source of the test (wireless or wired)—which indicates whether the tests were run on an AP or a switch.
You can use the app and vlan drop-down lists to filter SLE data by a specific application or VLAN. This feature allows for more focused analysis, enabling you to focus on specific network segments or applications most relevant to your needs. Here are the different options to view data:
-
All applications on all VLANs (default view)
-
All applications on a specific VLAN
-
A specific application on all VLANs
-
A specific application on a specific VLAN
The site-level application view offers additional insights for applications, providing a more granular understanding of their performance and issues:
-
Checkerboard chart that provides a quick visual summary of hourly validation test outcomes at the site level.
-
Network Latency
-
Packet Loss
-
Curl Latency
-
Traceroute
Marvis Minis running on devices validates application reachability and performance against a globally hosted Minis cloud application, served through a CDN. This enables Minis to measure network metrics as close as possible to your client VLAN's Internet gateways.
Ensure that *.mist.com addresses are allowed and reachable through your firewall.
The Latency, Jitter, and Traceroute statistics are currently available as part of the Beta program for the enhanced Marvis Minis. Contact your account team to participate in the Beta program. Also, note that these sections are displayed only for an application at the site level.
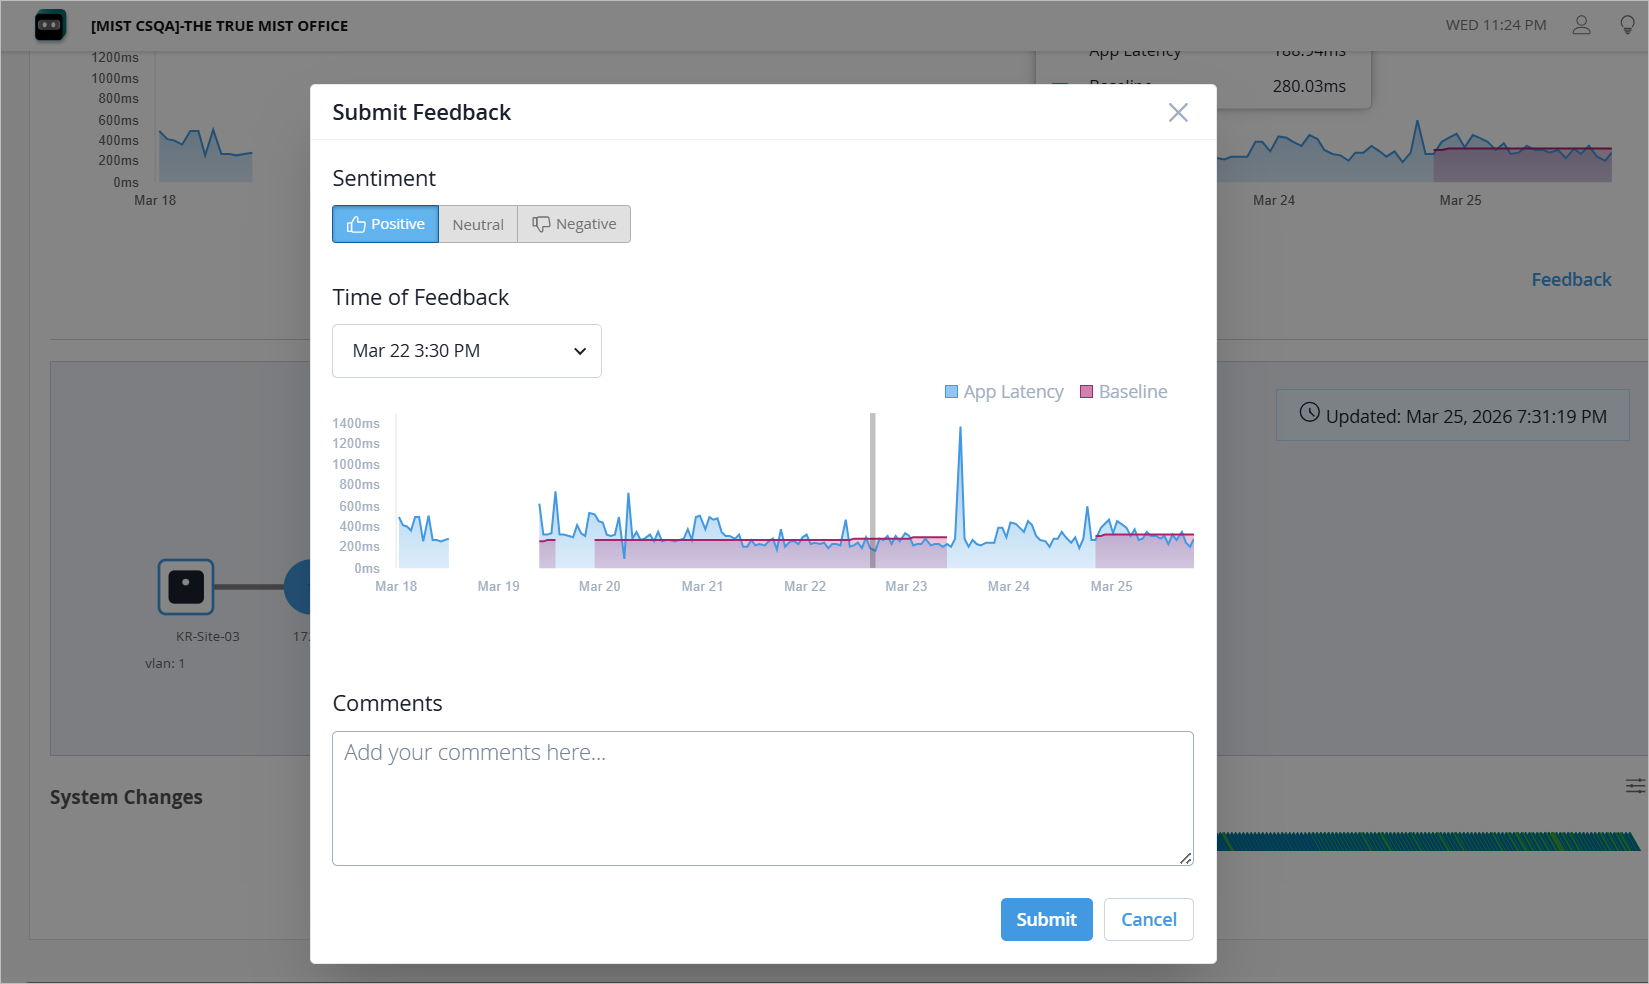
You can use the Feedback link to submit details about issues you encounter, report undetected problems or incorrect information about network latency, packet loss, and application latency. If your feedback pertains to a specific time range, simply select the relevant area on the graph. This action will open the feedback dialog box where you can enter your comments and observations.