AP Metrics
Proactively monitor the performance of the access points (APs) at your site and quickly identify and troubleshoot connectivity and firmware compliance issues.
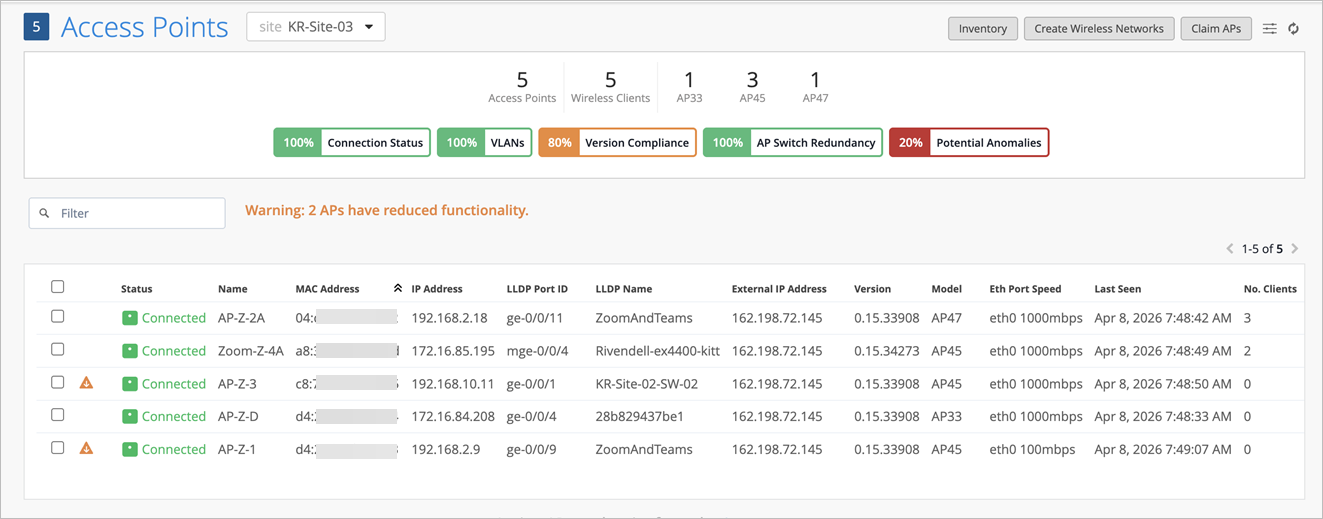
You can see the overall operational health of the APs on the Access Points page, which shows a score for connectivity status, VLANs, version compliance and AP switch redundancy. Click one of the orange or red scores to see which devices have a problem and why, as shown in Figure 1.
- Green indicates 98.5% or higher compliance.
- Orange means 80% to 98.5% compliance.
- Red means that 80% or fewer APs are meeting the standard.
-
Connection Status—Shows the percentage of APs that are online at your site. Click this metric to see the list of APs that are offline and the reason, for example, No IP Address or No Ethernet Link. You can also check the LED blink pattern on the AP itself, as described here: What Does the AP Status LED Indicate?
-
VLANs—Shows the percentage of APs where all wired VLANs are active. Click this metric to see APs with inactive VLANs and find the VLAN IDs. Users connected to an inactive, or incorrectly configured VLAN won't be able to get an IP address or connect to the network.
-
Version Compliance—Shows the percentage of APs, by model, that are using the expected firmware version. The values shown here can have different meaning depending on whether or not you've enabled Auto Update for the firmware. If this feature is enabled, the value reflects the percentage of APs running the version specified in the configuration. Otherwise, the value is relative to the predominant version, per AP model. For example, if three AP41s are running version 0.7.20383 and two are running version 0.5.17445, version 0.7.20383 is considered the compliant version (and in this case, 40%, or 2 of the 5 total APs, will be shown as non-compliant). For help with the Auto Update feature, see Enable Automatic Firmware Upgrade.
-
AP Switch Redundancy—Shows how many APs, that are also RF neighbors, as measured by RSSI strength, are connected to the same switch (or VC stack member).
- 1—No redundancy, that is, all the top RF neighbors are connected to the same uplink switch or stack member.
- 2—Good redundancy, that is, at least one of the top RF neighbors is connected to a different uplink switch or stack member.
- 3 and greater—Excellent redundancy, that is, two or more top RF neighbors are connected to two or more different uplink switches.
You can also view your AP switch redundancy according to the site floorplan by selecting Switches from the main menu and then opening the Location tab, as shown in Figure 2.
Figure 2: Switch Redundancy Map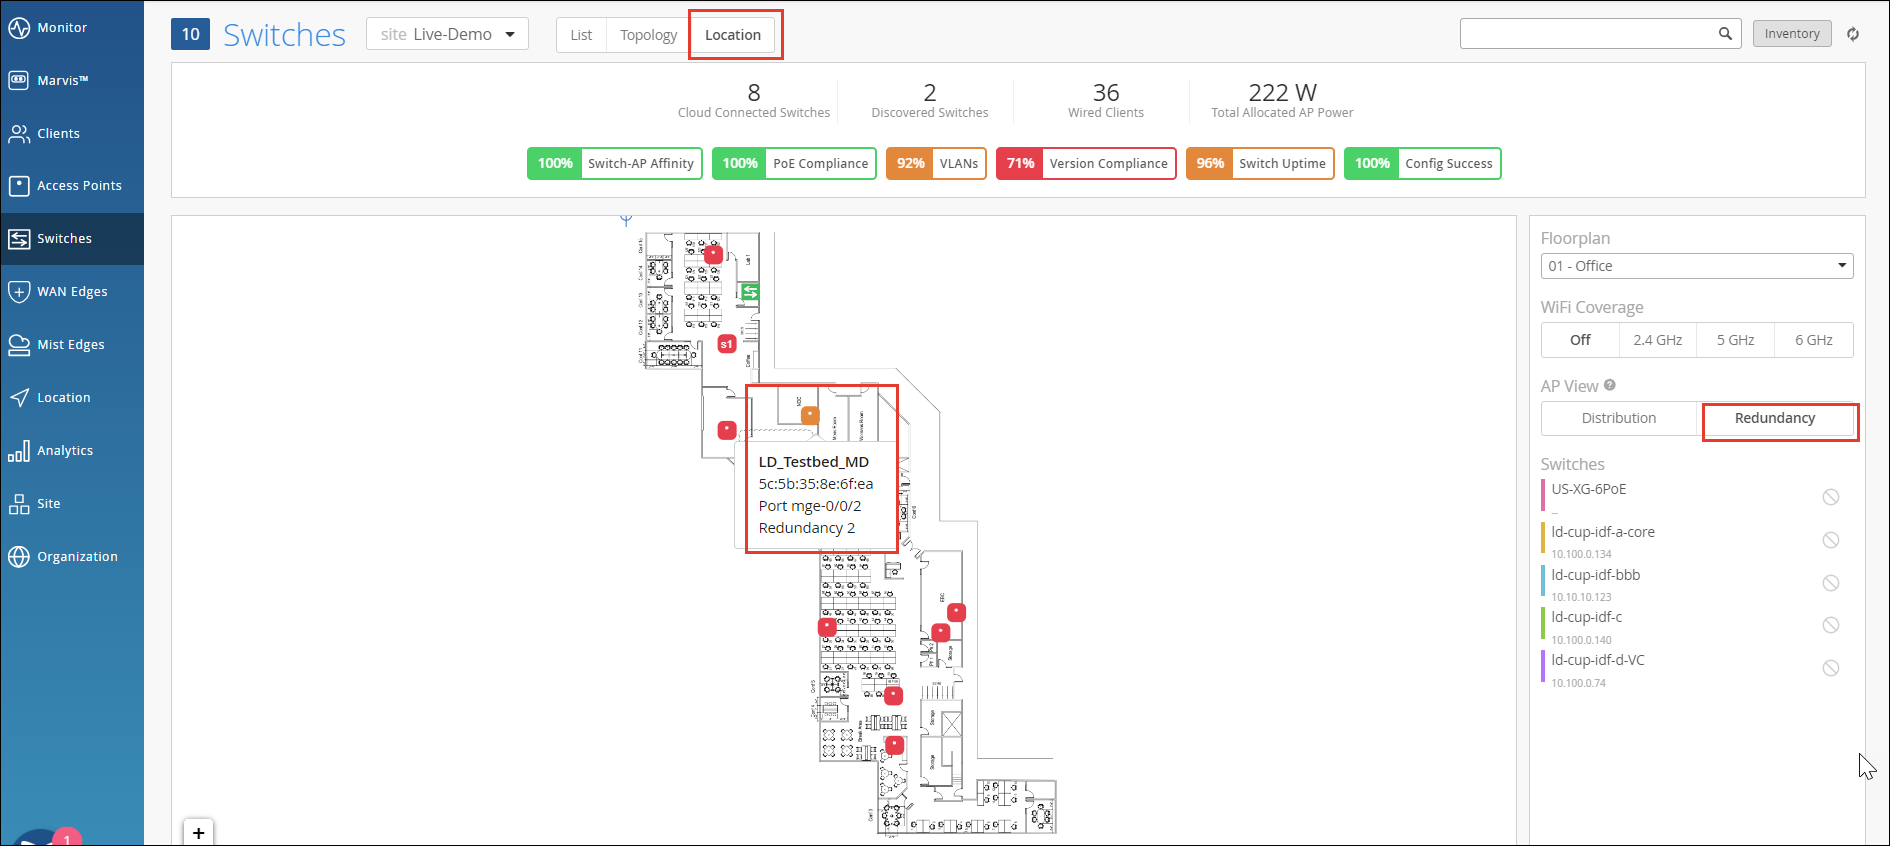
-
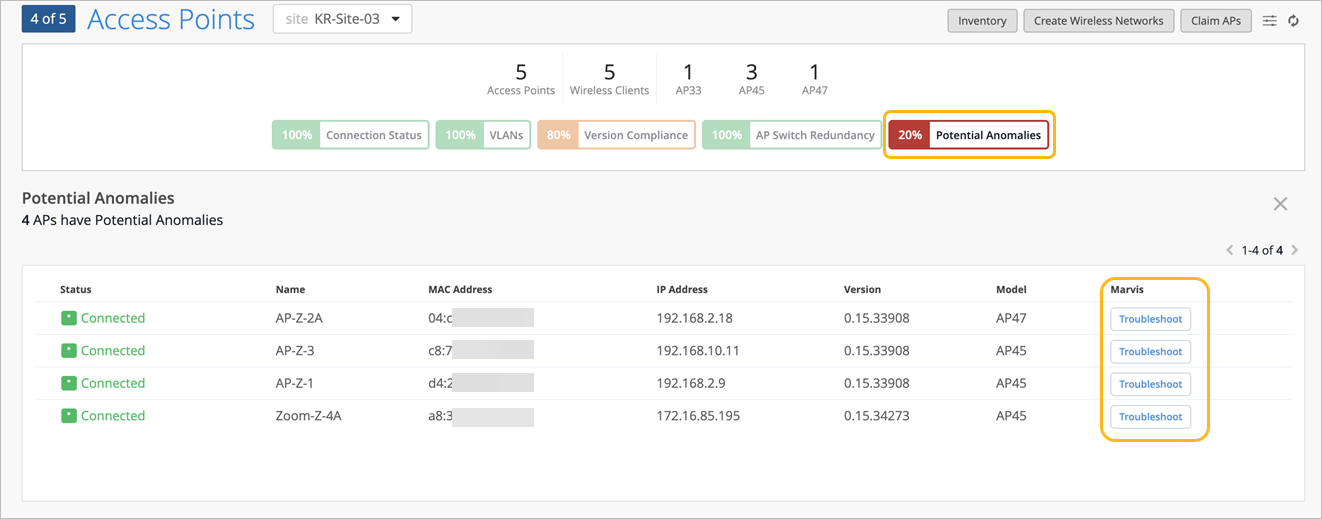
Potential Anomalies—This indicator displays the percentage of APs that currently have no potential anomalies detected by Marvis.
-
If none of the APs have potential anomalies, the percentage is 100%.
-
If the APs have potential anomalies, the value decreases in proportion to how many are affected. For example, if a site has 10 APs and 2 of them have anomalies, the percentage is 80%.
If the percentage is less than 100%, you can click the indicator to view the APs with anomalies. APs with potential anomalies are listed with a Troubleshoot button. Clicking the Troubleshoot button launches the conversational assistant with a pre-filled prompt such as “Troubleshoot <device> for last 7 days”, enabling you to view the detected anomalies without having to manually initiate troubleshooting.
-
AP Parameters, Statuses, and Warnings
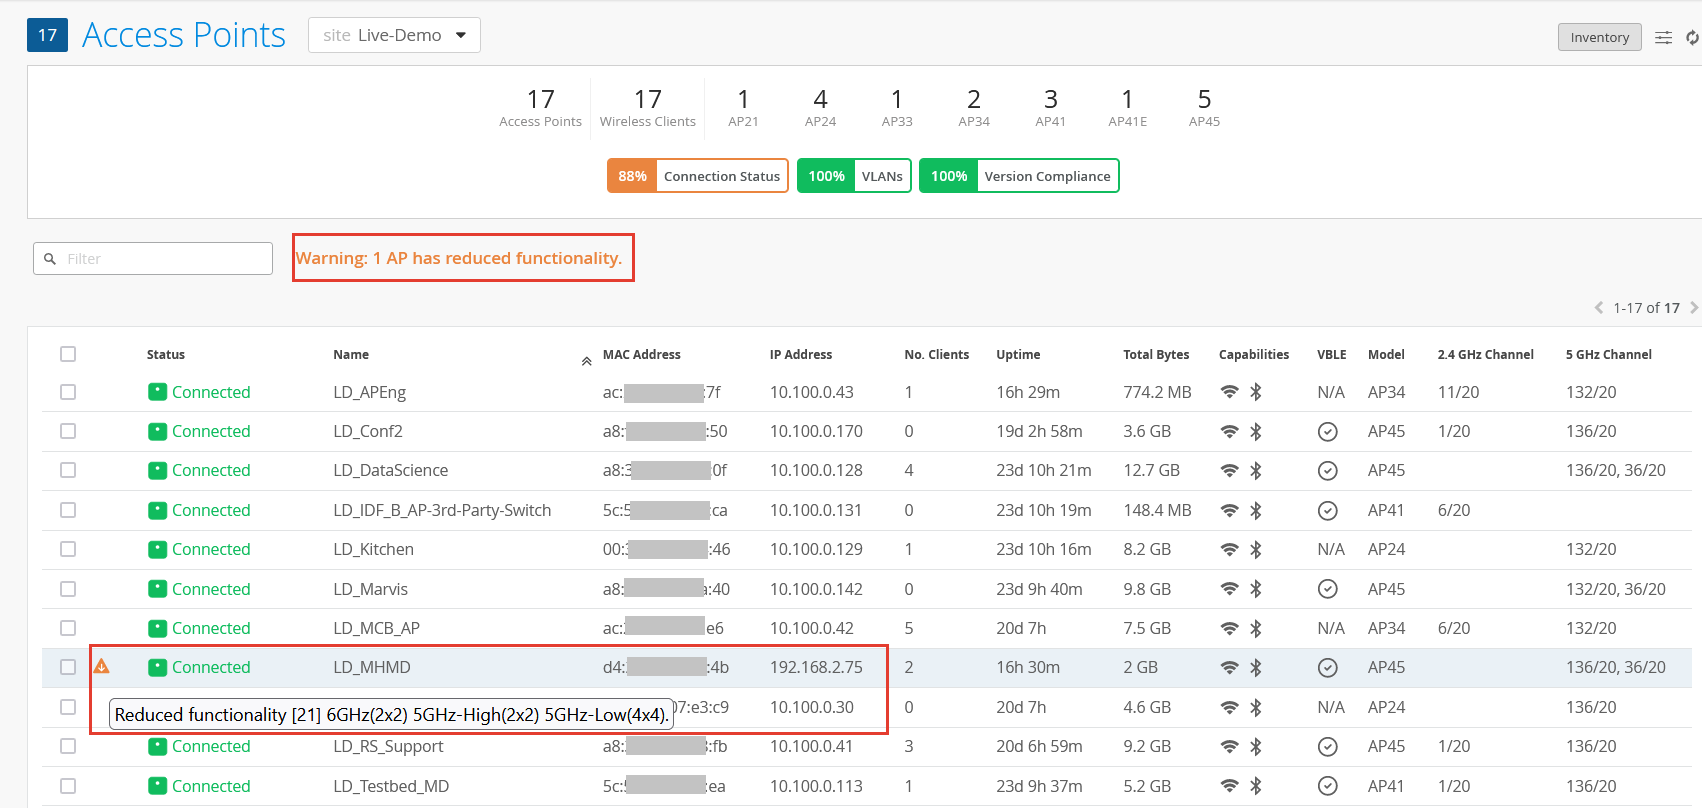
Figure 3 shows a list of APs, including columns with various details. Choose the details you'd like to see by clicking the so-called "hamburger" menu at the top of the page and then selecting from the list of over 60 parameters that appear. You can sort the order in which the parameters are shown in the table. Common fields include AP name, MAC address, channel(s), radio band, and device profile. For APs with GNSS/GPS radios, you can enable GPS‑based geolocation visibility to display the latitude and longitude.
The Access Points page also shows the status of each AP in the site, as well as any warnings associated with the AP. Warning messages are typically shown when an AP is operating in a reduced functionality mode, such as when an AP43 is being used to supply power to an attached USB peripheral.
If an AP in the list shows Stale Configuration, it means that the AP was automatically rolled back to a its last known good configuration, typically because there was an error that caused it to disconnect from the Mist cloud. This warning is associated with the Automatically Revert Configuration setting for APs site-wide.