AP Insights
Investigate issues affecting access points (APs).
Finding the AP Insights
Go to the Insights page, click the site menu at the top of the page, then click Access Point on the left, and then click the AP that you want to view.
Channels
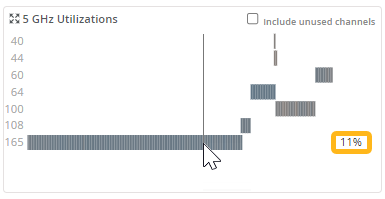
These charts show channel utilization for all frequency bands (as applicable to the selected AP). Use the graphs for the 2.4 GHz, 5 GHz, and 6 GHz frequency bands to view interference sources and to assess overall channel health.

-
Use the checkbox above the graph to show or hide the unused channels.
Hover your mouse pointer over any segment of the chart to show the percent utilized at that point in time. As shown in this example, the percentage appears on the right side of the chart.

Related Events and Information for APs
When you select an AP at the top of the Insights page, related events and information also appear. For help with these sections of the page, go to these topics:
Current Values for APs
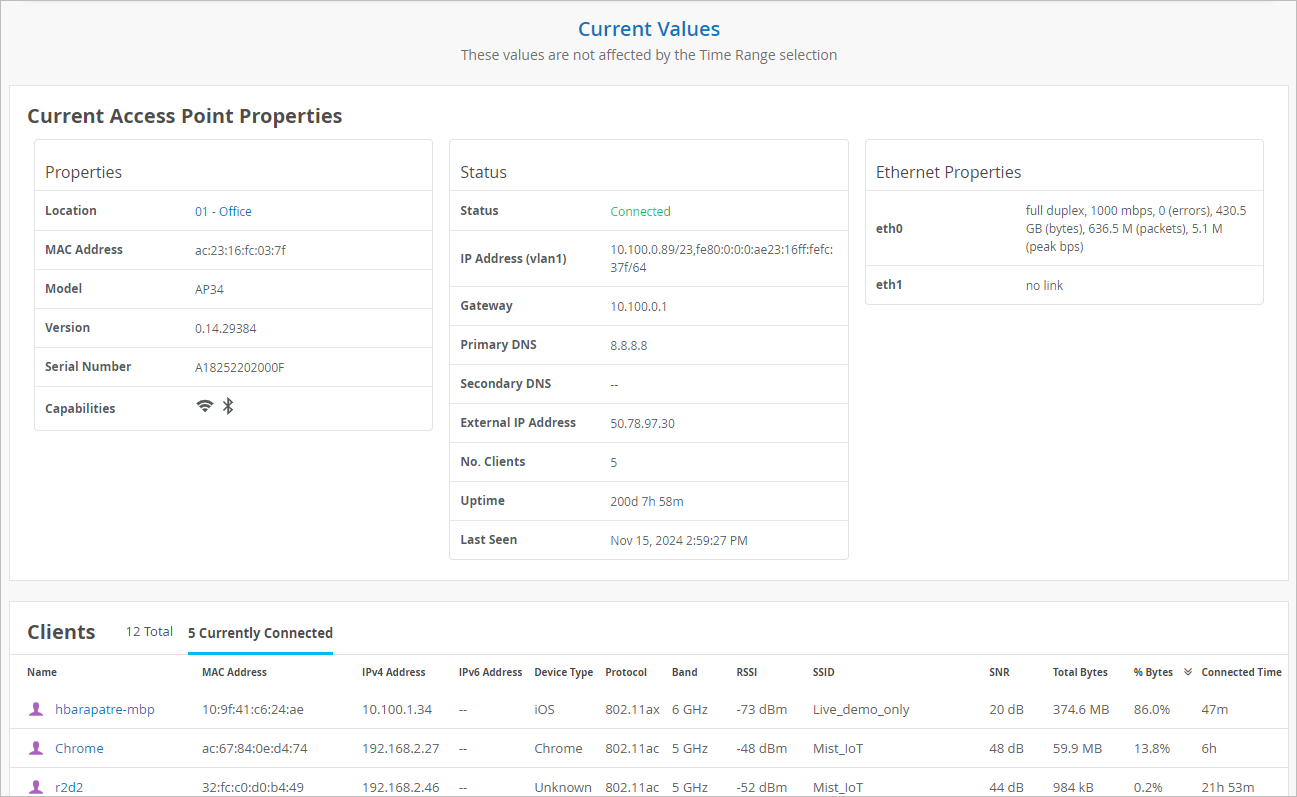
The Current Values section appears toward the bottom of the Insights page.

The values in this section don't change when you adjust the time range selection at the top of the page.
When you select an AP as the context, this section includes:
-
Current Access Point Properties
-
Properties—Location, MAC address, model, and more
-
Status—Current status (connected, rebooting, disconnected), IP address, gateway, DNS, number of clients, uptime, and more
-
Ethernet Properties—Ethernet details for each port
-
-
Clients—MAC address, IP address, device type, protocol, band, RSSI, SSID, SNR, bytes, and connected time.
-
Use the tabs at the top of this section to show all clients or connected clients.
-
Click the name of a client to reload the Insights page with the data for that client.
-
