Pre-Connection and Post-Connection Charts
See pre- and post-connection data to gain insight into network issues.
Finding the Pre- and Post-Connection Information
The Pre-Connection and Post-Connection Charts appear on the Insights page when you select a site or wireless client from the shortcut menu.
Only the Post-Connection Charts appear when you select an AP or a Cellular Edge.
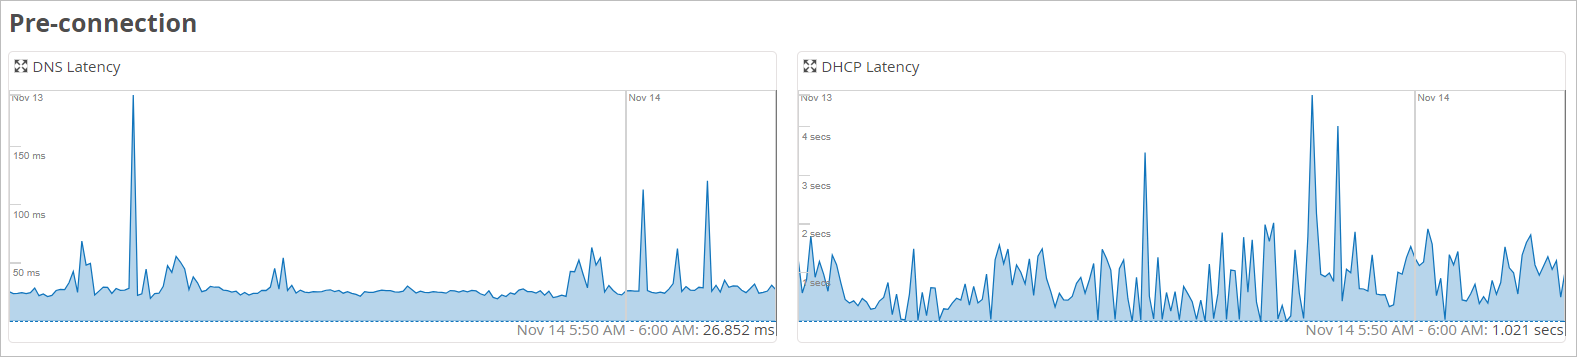
Pre-Connection Charts
For sites, the Pre-Connection charts include DNS Latency and DHCP Latency.
For clients, the Pre-Connection charts include Authorization Latency and DHCP Latency
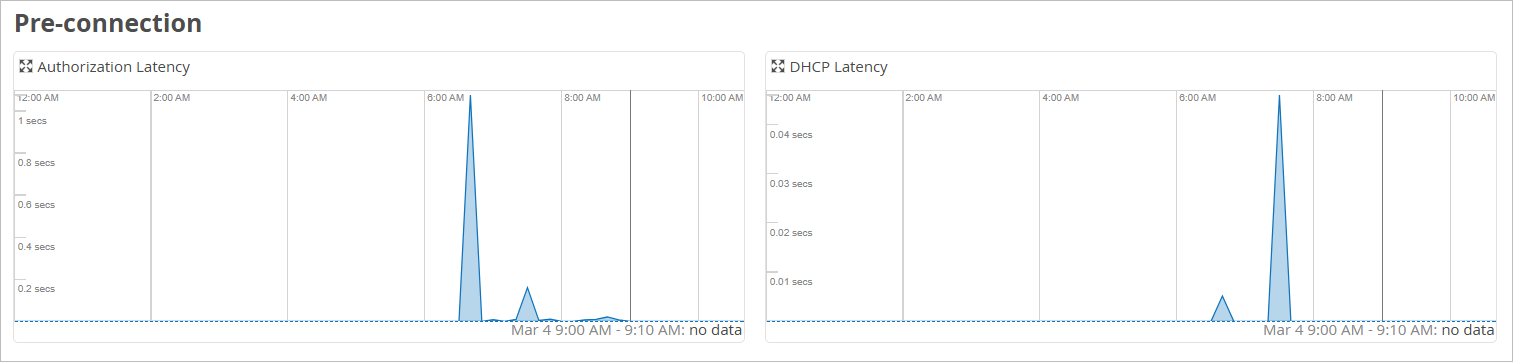
Hover over any point on a chart to see the specific data and timestamp below the chart.
Post-Connection Charts
The Post-Connection charts display minimum/maximum/average statistics for the connected clients over the selected time period. You can use these charts to gain additional insights about a client.
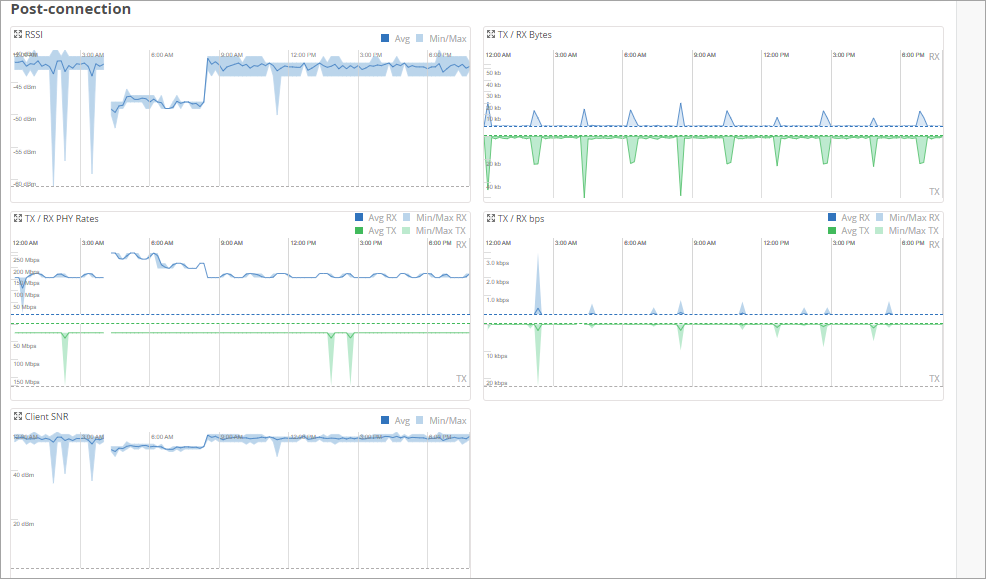
The standard Post-Connection charts are:
-
Associated Clients
-
TX/RX Bytes
If your organization has an active Marvis for Wireless subscription, you'll also see these charts:
-
RSSI
-
TX/RX PHY Rates,
-
TX/RX bps
-
Client SNR (Signal-to-Noise Ratio)