Wireless Client Insights
Investigate issues affecting wireless clients, such as cell phones and laptop computers.
Finding the Wireless Client Insights
Go to the Insights page, click the site menu at the top of the page, then click Client on the left, and then click the client that you want to view.
Client Events
Click an event to see a summary on the right side of the page.
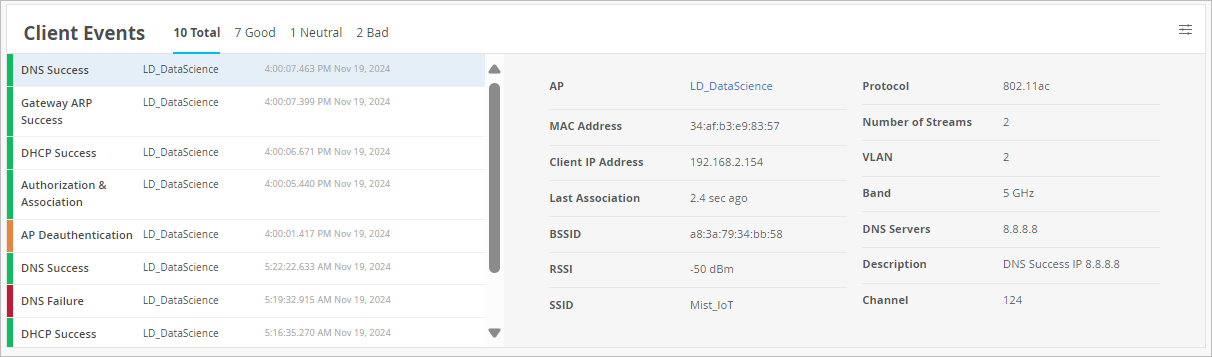
Client Events appear on the Insights page when you select a site, AP, or client as the context.
Options:
-
Use the tabs at the top of this section to show all, good, neutral, or bad events.
-
To select the event types to include, click the settings button at the top-right corner of the Client Events section. For more information, see Client Event Types.
-
Links—Click a link to view more information.
-
Packet Capture—Juniper APs have a built-in packet buffer. For certain events such as authorization failures, Juniper Mist keeps the buffer information and makes it available as a dynamic packet capture. A paperclip icon appears on the event if a capture is available. In the summary, click Download Packet Capture to save the file. You can then open the file and analyze the details.
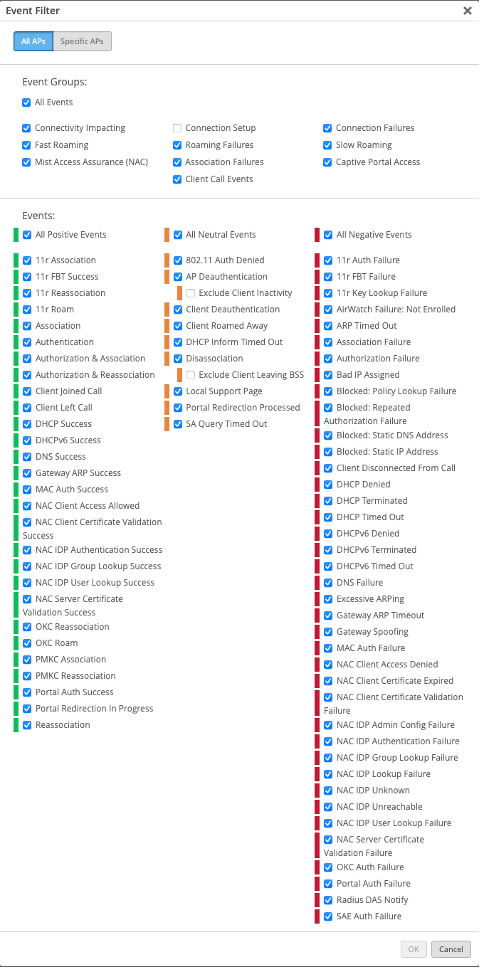
Client Event Types
To select the event types to include, click the settings button at the top-right corner of the Client Events section.

In the Event Filter pop-up window, select or clear the check boxes to show or hide the events. Click OK to save your settings.
|
Positive Client Events |
Neutral Client Events |
Negative Client Events |
|---|---|---|
|
|
|
Related Events and Information for Wireless Clients
When you select a wireless client at the top of the Insights page, related events and information also appear. For help with these sections of the page, go to these topics:
-
Meeting Insights Charts (including Meeting Details)
Current Values for Wireless Clients
The Current Values section appears toward the bottom of the Insights page.
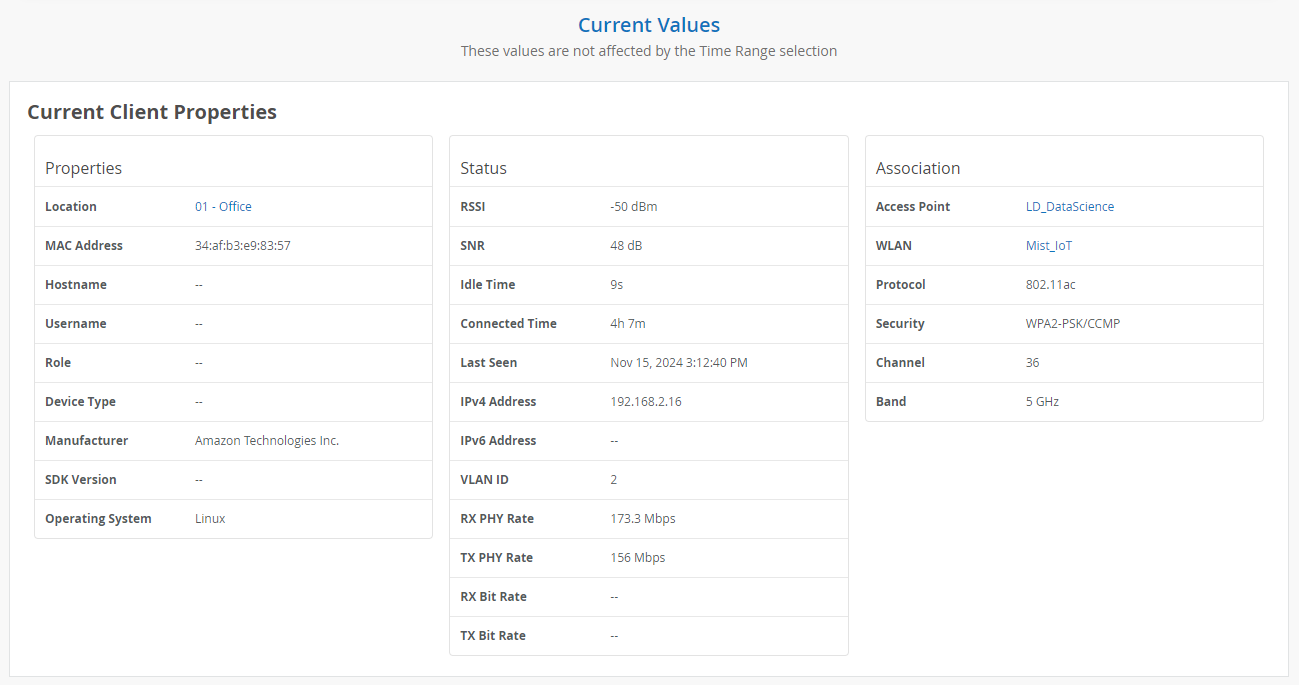
The values in this section don't change when you adjust the time range selection at the top of the page.
When you select a wireless client as the context, this section includes Current Client Properties:
-
Properties—Location, MAC address, hostname, manufacturer, OS, and more
-
Status—Details such as RSSI, SNR, idle time, connected time, IP address, RX/TX rates, and more
-
Association—Names of the associated AP and WLAN, along with protocol, security type, channel, and band.
-
Click the AP hyperlink to go to the AP details page.
-
Click the WLAN hyperlink to go to the WLAN details page.
-