ON THIS PAGE
Create the SQS Queue that is Used to Receive ObjectCreated Notifications
Blue Coat Web Security Service REST API Protocol Configuration Options
Juniper Security Binary Log Collector Protocol Configuration Options
Microsoft Defender for Endpoint SIEM REST API Protocol Configuration Options
Office 365 Message Trace REST API Protocol Configuration Options
Sophos Enterprise Console JDBC Protocol Configuration Options
Protocol Configuration Options
Protocols in JSA provide the capability of collecting a set of data files by using various connection options. These connections pull the data back or passively receive data into the event pipeline in JSA. Then, the corresponding Device Support Module (DSM) parses and normalizes the data.
The following standard connection options pull data into the event pipeline:
-
JDBC
-
FTP
-
SFTP
-
SCP
The following standard connection options receive data into the event pipeline:
-
Syslog
-
HTTP Receiver
-
SNMP
JSA also supports proprietary vendor-specific protocol API calls, such as Amazon Web Services.
Akamai Kona REST API Protocol Configuration Options
To receive events from your Akamai Kona Platform, configure a log source to use the Akamai Kona REST API protocol.
The Akamai Kona REST API protocol is an outbound/active protocol that queries the Akamai Kona Platform and sends events to the JSA Console.
The following table describes the parameters that require specific values for Akamai KONA DSM event collection.
|
Parameter |
Value |
|---|---|
|
Log Source Type |
Akamai KONA |
|
Protocol Configuration |
Akamai Kona REST API |
|
Host |
The Host value is provided during the SIEM OPEN API provisioning in the Akamai Luna Control Center. The Host is a unique base URL that contains information about the appropriate rights to query the security events. This parameter is a password field because part of the value contains secret client information. |
|
Client Token |
Client Token is one of the two security parameters. This token is paired with Client Secret to make the client credentials. This token can be found after you provision the Akamai SIEM OPEN API. |
|
Client Secret |
Client Secret is one of the two security parameters. This secret is paired with Client Token to make the client credentials. This token can be found after you provision the Akamai SIEM OPEN API. |
|
Access Token |
Access Token is a security parameter that is used with client credentials to authorize API client access for retrieving the security events. This token can be found after you provision the Akamai SIEM OPEN API. |
|
Security Configuration ID |
Security Configuration ID is the ID for each security configuration that you want to retrieve security events for. This ID can be found in the SIEM Integration section of your Akamai Luna portal. You can specify multiple configuration IDs in a comma-separated list. For example: configID1,configID2. |
|
Use Proxy |
If JSA accesses the Amazon Web Service by using a proxy, enable Use Proxy. If the proxy requires authentication, configure the Proxy Server, Proxy Port, Proxy Username, and Proxy Password fields. If the proxy does not require authentication, configure the Proxy IP or Hostname fields. |
|
Automatically Acquire Server Certificate |
Select Yes for JSA to automatically download the server certificate and begin trusting the target server. |
|
Recurrence |
The time interval between log source queries to the Akamai SIEM API for new events. The time interval can be in hours (H), minutes (M), or days (D).The default is 1 minute. |
|
EPS Throttle |
The maximum number of events per second. The default is 5000. |
Amazon AWS S3 REST API Protocol Configuration Options
The Amazon AWS REST API protocol is an outbound/active protocol that collects AWS CloudTrail logs from Amazon S3 buckets.
It's important to ensure that no data is missing when you collect logs from Amazon S3 to use with a custom DSM or other unsupported integrations. Because of the way the S3 APIs return the data, all files must be in an alphabetically increasing order when the full path is listed. Make sure that the full path name includes a full date and time in ISO9660 format (leading zeros in all fields and a YYYY-MM-DD date format).
Consider the following file path:
<Name>test-bucket</Name> Prefix>Mylogs/
          </Prefix><Marker> MyLogs/2018-8-9/2018-08-09T23-5925.log.g</Marker>
          <MaxKeys>1000</MaxKeys><IsTruncated> false<IsTruncated>
          </ListBucketResult>
The full name of the file in the marker is
MyLogs/2018-8-9/2018-08-09T23-59-25.955097.log.gz and the folder name is
written as 2018-8-9 instead of 2018-08-09. This date
format causes an issue when data for the 10 September 2018 is presented. When sorted, the
date displays as 2018-8-10 and the files are not sorted
chronologically:
2018-10-1
2018-11-1
2018-12-31
2018-8-10
2018-8-9
2018-9-1
After data for 9 August 2018 comes in to JSA, you won't see data again until 1 September 2018 because leading zeros were not used in the date format. After September, you won't see data again until 2019. Leading zeros are used in the date (ISO 9660) so this issue does not occur.
By using leading zeros, files and folders are sorted chronologically:
2018-08-09
2018-08-10
2018-09-01
2018-10-01
2018-11-01
2018-12-01
2018-12-31
A log source can retrieve data from only one region, so use a different log source for each region. Include the region folder name in the file path for the Directory Prefix value when using the Directory Prefix event collection method to configure the log source.
The following table describes the common parameter values to collect audit events by using the Directory Prefix collection method or the SQS event collection method. These collection methods use the Amazon AWS S3 REST API protocol.
The following table describes the protocol-specific parameters for the Amazon AWS REST API protocol:
|
Parameter |
Description |
|---|---|
|
Protocol Configuration |
Amazon AWS S3 REST API |
|
Log Source Identifier |
Type a unique name for the log source. The Log Source Identifier can be any valid value and does not need to reference a specific server. The Log Source Identifier can be the same value as the Log Source Name. If you have more than one Amazon AWS CloudTrail log source that is configured, you might want to identify the first log source as awscloudtrail1 , the second log source as awscloudtrail2 , and the third log source as awscloudtrail3 . |
|
Authentication Method |
|
|
Access Key |
The Access Key ID that was generated when you configured the security credentials for your AWS user account If you selected Access Key ID / Secret Key or Assume IAM Role, the Access Key parameter is displayed. |
|
Secret Key |
The Secret Key that was generated when you configured the security credentials for your AWS user account. If you selected Access Key ID / Secret Key or Assume IAM Role, the Secret Key parameter is displayed. |
|
Assume an IAM Role |
Enable this option by authenticating with an Access Key or EC2 instance IAM Role. Then, you can temporarily assume an IAM Role for access. |
|
Assume Role ARN |
The full ARN of the role to assume. It must begin with "arn:" and can't contain any leading or trailing spaces, or spaces within the ARN. If you enabled Assume an IAM Role, the Assume Role ARN parameter is displayed. |
|
Assume Role Session Name |
The session name of the role to assume. The default is QRadarAWSSession. Leave as the default if you don't need to change it. This parameter can contain only upper and lowercase alphanumeric characters, underscores, or any of the following characters: =,.@- If you enabled Assume an IAM Role, the Assume Role Session Name parameter is displayed. |
|
Event Format |
AWS Cloud Trail JSON AWS Network Firewall AWS VPC Flow Logs Cisco Umbrella CSB LINEBYLINE W3C |
|
Region Name |
The region that the SQS Queue or the AWS S3 bucket is in. Example: us-east-1, eu-west-1, ap-northeast-3 |
|
Use as a Gateway Log Source |
Select this option for the collected events to flow through the JSA Traffic Analysis engine and for JSA to automatically detect one or more log sources. |
|
Show Advanced Options |
Select this option if you want to customize the event data. |
|
File Pattern |
This option is available when you set Show Advanced Options to Yes. Type a regex for the file pattern that matches the files that you want to pull; for example, .*?\.json\.gz |
|
Local Directory |
This option is available when you set Show Advanced Options to Yes. The local directory on the Target Event Collector. The directory must exist before the AWS S3 REST API protocol attempts to retrieve events. |
|
S3 Endpoint URL |
This option is available when you set Show Advanced Options to Yes. The endpoint URL that is used to query the AWS S3 REST API. If your endpoint URL is different from the default, type your endpoint URL. The default is https:// s3.amazonaws.com |
|
Use S3 Path-Style Access |
Forces S3 requests to use path-style access. This method is deprecated by AWS. However, it might be required when you use other S3 compatible APIs. |
|
Use Proxy |
If JSA accesses the Amazon Web Service by using a proxy, enable Use Proxy. If the proxy requires authentication, configure the Proxy Server, Proxy Port, Proxy Username, and Proxy Password fields. If the proxy does not require authentication, configure the Proxy IP or Hostname field. |
|
Recurrence |
How often a poll is made to scan for new data. If you are using the SQS event collection method, SQS Event Notifications can have a minimum value of 10 (seconds). Because SQS Queue polling can occur more often, a lower value can be used. If you are using the Directory Prefix event collection method, Use a Specific Prefix has a minimum value of 60 (seconds) or 1M. Because every listBucket request to an AWS S3 bucket incurs a cost to the account that owns the bucket, a smaller recurrence value increases the cost. Type a time interval to determine how frequently the remote directory is scanned for new event log files. The minimum value is 1 minute. The time interval can include values in hours (H), minutes (M), or days (D). For example, 2H = 2 hours, 15 M = 15 minutes. |
|
EPS Throttle |
The maximum number of events per second that are sent to the flow pipeline. The default is 5000. Ensure that the EPS Throttle value is higher than the incoming rate or data processing might fall behind. |
The following table describes the specific parameter values to collect audit events by using the Directory Prefix event collection method:
|
Parameter |
Description |
|---|---|
|
S3 Collection Method |
Select Use a Specific Prefix. |
|
Bucket Name |
The name of the AWS S3 bucket where the log files are stored. |
|
Directory Prefix |
The root directory location on the AWS S3 bucket from where the CloudTrail logs are retrieved; for example, AWSLogs/<AccountNumber>/CloudTrial/<RegionName>/ To pull files from the root directory of a bucket, you must use a forward slash (/) in the Directory Prefix file path. Note:
Changing the Directory Prefix value clears the persisted file marker. All files that match the new prefix are downloaded in the next pull. The Directory Prefix file path cannot begin with a forward slash (/) unless only the forward slash is used to collect data from the root of the bucket. If the Directory Prefix file path is used to specify folders, you must not begin the file path with a forward slash (for example, use folder1/folder2 instead). |
The following table describes the parameters that require specific values to collect audit events by using the SQS event collection method:
|
Parameter |
Description |
|---|---|
|
S3 Collection Method |
Select SQS Event Notifications. |
|
SQS Queue URL |
The full URL that begins with , for the SQS Queue that is set up to receive notifications for ObjectCreated events from S3. |
Amazon VPC Flow Logs
The JSA integration for Amazon VPC (Virtual Private Cloud) Flow Logs collects VPC flow logs from an Amazon S3 bucket by using an SQS queue.
This integration supports the default format for Amazon VPC Flow Logs and any custom formats that contain version 3, 4, or 5 fields. However, all version 2 fields must be included in your custom format. The default format includes these fields:
${version} ${account-id} ${interface-id} ${srcaddr} ${dstaddr} ${srcport}
                        ${dstport} $ {protocol} ${packets} ${bytes} ${start} ${end} ${action}
                        ${log-status}
To integrate Amazon VPC Flow Logs with JSA, complete the following steps:
-
If automatic updates are not enabled, download and install the most recent version of the Amazon VPC Flow Logs DSM RPM from the https://support.juniper.net/support/downloads/ onto your JSA console.
-
Protocol Common RPM
-
AWS S3 REST API PROTOCOL RPM
Note:If you are installing the RPM to enable additional AWS-related VPC flow fields in the QRadar Network Activity Flow Details window, then the following services must be restarted before they are visible. You don't have to restart the services for the protocol to function.
-
hostcontext
To restart hostcontext, see QRadar: Hostcontext service and the impact of a service restart.
-
tomcat
On the Console, click the Admin tab, and then click Advanced > Restart Web Server.
-
-
Configure your Amazon VPC Flow Logs to publish the flow logs to an S3 bucket.
-
Create the SQS queue that is used to receive
ObjectCreatednotifications from the S3 bucket that you used in step 2. -
Create security credentials for your AWS user account.
-
Add an Amazon VPC Flow Logs log source on the JSA Console.
Note:A Flow Processor must be available and licensed to receive the flow logs. Unlike other log sources, AWS VPC Flow Log events are not sent to Log Activity tab. They are sent to Network Activity tab.
The following table describes the parameters that require specific values to collect events from Amazon VPC Flow Logs:
Table 5: Amazon VPC Flow Logs log source parameters Parameter
Value
Log Source type
A custom log source type
Protocol Configuration
Amazon AWS S3 REST API
Target Event Collector
The Event Collector or Event Processor that receives and parses the events from this log source.
Note:This integration collects events about Amazon VPC Flow Logs. It does not collect flows. You cannot use a Flow Collector or Flow Processor as the target event collector.
Log Source Identifier
Type a unique name for the log source.
The Log Source Identifier can be any valid value and does not need to reference a specific server. The Log Source Identifier can be the same value as the Log Source Name. If you configured more than one Amazon VPC flow Logs log source, you might want to name in an identifiable way. For example, you can identify the first log source as vpcflowlogs1 and the second log source as vpcflowlogs2.
Authentication Method
-
Access Key ID / Secret Key
Standard authentication that can be used from anywhere.
For more information, see Configuring Security Credentials for your AWS User Account.
-
EC2 Instance IAM Role
If your managed host is running on an AWS EC2 instance, choosing this option uses the IAM Role from the instance metadata assigned to the instance for authentication. No keys are needed. This method works only for managed hosts that are running within an AWS EC2 container.
Assume IAM Role
Enable this option by authenticating with an Access Key or EC2 instance IAM Role. Then, you can temporarily assume an IAM Role for access. This option is available only when you use the SQS Event Notifications collection method.
For more information about creating IAM users and assigning roles, see Creating an Identity and Access Management (IAM) user in the AWS Management Console.
Event Format
AWS VPC Flow Logs
S3 Collection Method
SQS Event Notifications
VPC Flow Destination Hostname
The hostname or IP address of the Flow Processor where you want to send the VPC logs.
Note:For JSA to accept IPFIX flow traffic, you must configure a NetFlow/IPFIX flow source that uses UDP. Most deployments can use a default_Netflow flow source and set the VPC Flow Destination Hostname to the hostname of that managed host.
If the managed host configured with the NetFlow/IPFIX flow source is the same as the Target Event Collector that was chosen earlier in the configuration, you can set the VPC Flow Destination Hostname to localhost.
VPC Flow Destination Port
The port for the Flow Processor where you want to send the VPC logs.
Note:This port must be the same as the monitoring port that is specified in the NetFlow flow source. The port for the default_Netflow flow source is 2055
SQS Queue URL
The full URL that begins with https://, for the SQS Queue that is set up to receive notifications for ObjectCreated events from S3.
Region Name
The region that is associated with the SQS queue and S3 bucket.
Example: us-east-1, eu-west-1, ap-northeast-3
Show Advanced Options
The default is No. Select Yes if you want to customize the event data.
File Pattern
This option is available when you set Show Advanced Options to Yes.
Type a regex for the file pattern that matches the files that you want to pull; for example,
.*?
                                                \.json\.gz
Local Directory
This option is available when you set Show Advanced Options to Yes.
The local directory on the Target Event Collector. The directory must exist before the AWS S3 REST API PROTOCOL attempts to retrieve events.
S3 Endpoint URL
This option is available when you set Show Advanced Options to Yes.
The endpoint URL that is used to query the AWS REST API.
If your endpoint URL is different from the default, type your endpoint URL. The default is http://s3.amazonaws.com.
Use Proxy
If JSA accesses the Amazon Web Service by using a proxy, enable Use Proxy.
If the proxy requires authentication, configure the Proxy Server, Proxy Port, Proxy Username, and Proxy Password fields.
If the proxy does not require authentication, configure the Proxy Server and Proxy Port fields.
Recurrence
How often the Amazon AWS S3 REST API Protocol connects to the Amazon cloud API, checks for new files, and if they exist, retrieves them. Every access to an AWS S3 bucket incurs a cost to the account that owns the bucket. Therefore, a smaller recurrence value increases the cost.
Type a time interval to determine how frequently the remote directory is scanned for new event log files. The minimum value is 1 minute. The time interval can include values in hours (H), minutes (M), or days (D). For example, 2H = 2 hours, 15 M = 15 minutes.
EPS Throttle
The maximum number of events per second that are sent to the flow pipeline. The default is 5000.
Ensure that the EPS Throttle value is higher than the incoming rate or data processing might fall behind.
-
-
To send VPC flow logs to the JSA Cloud Visibility app for visualization, complete the following steps:
-
On the Console, click the Admin tab, and then click System Configuration > System Settings.
-
Click the Flow Processor Settings menu, and in the IPFix additional field encoding field, choose either the TLV or TLV and Payload format.
-
Click Save.
-
From the menu bar on the Admin tab, click Deploy Full Configuration and confirm your changes.
Warning:When you deploy the full configuration, JSA services are restarted. During this time, events and flows are not collected, and offenses are not generated.
-
Refresh your browser.
-
Amazon VPC Flow Logs Specifications
The following table describes the specifications for collecting Amazon VPC Flow Logs.
|
Parameter |
Value |
|---|---|
|
Manufacturer |
Amazon |
|
DSM name |
A custom log source type |
|
RPM file name |
AWS S3 REST API PROTOCOL |
|
Supported versions |
Flow logs v5 |
|
Protocol |
AWS S3 REST API PROTOCOL |
|
Event format |
IPFIX by using JSA Flow Sources |
|
Recorded event types |
Network Flows |
|
Automatically discovered? |
No |
|
Includes identity? |
No |
|
Includes custom properties? |
No |
|
More information |
(https:// docs.aws.amazon.com/vpc/latest/userguide/flowlogs. html) |
Publishing Flow Logs to an S3 Bucket
Complete these steps to publish flow logs to an S3 bucket.
-
Log in to your AWS Management console, and then from the Services menu, navigate to the VPC Dashboard.
-
Enable the check box for the VPC ID that you want to create flow logs for.
-
Click the Flow Logs tab.
-
Click Create Flow Log, and then configure the following parameters:
Table 7: Create Flow Log parameters Parameter
Description
Filter
Select Accept, Reject, or All.
Destination
Select Send to an S3 Bucket.
S3 Bucket ARN
Type the ARN for the S3 Bucket.
arn:aws;s3:::myTestBucket
arn:aws:s3:::myTestBucket/testFlows
-
Click Create.
Create the SQS queue that is used to receive ObjectCreated notifications.
Create the SQS Queue that is Used to Receive ObjectCreated Notifications
You must create an SQS queue and configure S3 ObjectCreated notifications in the AWS Management Console when using the Amazon AWS REST API protocol.
To create the SQS queue and configure S3 ObjectCreated notifications, see the AWS S3 REST API documentation about Creating ObjectCreated Notifications.
Configuring Security Credentials for your AWS User Account
You must have your AWS user account access key and the secret access key values before you can configure a log source in JSA.
-
Log in to your IAM console (https://console.aws.amazon.com/iam/)..
-
Select Users from left navigation pane and then select your user name from the list.
-
To create the access keys, click the Security Credentials tab, and in the Access Keys section, click Create access key.
-
Download the CSV file that contains the keys or copy and save the keys.
Note:Save the Access key ID and Secret access key. You need them when you configure a log source in JSA.
You can view the Secret access key only when it is created.
Amazon Web Services Protocol Configuration Options
The Amazon Web Services protocol for JSA collects AWS CloudTrail logs from Amazon CloudWatch logs.
The following table describes the protocol-specific parameters for the Amazon Web Services protocol:
|
Parameter |
Description |
|---|---|
|
Protocol Configuration |
Select Amazon Web Services from the Protocol Configuration list. |
|
Authentication Method |
|
|
Access Key |
The Access Key ID that was generated when you configured the security credentials for your AWS user account. If you selected Access Key ID / Secret Key, the Access Key parameter displays. |
|
Secret Key |
The Secret Key that was generated when you configured the security credentials for your AWS user account. If you selected Access Key ID / Secret Key, the Access Key parameter displays. |
|
Regions |
Select the check box for each region that is associated with the Amazon Web Service that you want to collect logs from. |
|
Other Regions |
Type the names of any additional regions that are associated with the Amazon Web Service that you want to collect logs from. To collect from multiple regions use a comma-separated list, as shown in the following example: region1,region2 |
|
AWS Service |
The name of the Amazon Web Service. From the AWS Service list, select CloudWatch Logs. |
|
Log Group |
The name of the log group in Amazon CloudWatch where you want to collect logs from. Note:
A single log source collects CloudWatch logs from 1 log group at a time. If you want to collect logs from multiple log groups, create a separate log source for each log group |
|
Log Stream (Optional) |
The name of the log stream within a log group. If you want to collect logs from all log streams within a log group, leave this field blank. |
|
Filter Pattern (Optional) |
Type a pattern for filtering the collected events. This pattern is not a regex filter. Only the events that contain the exact value that you specified are collected from CloudWatch Logs. If you type ACCEPT as the Filter Pattern value, only the events that contain the word ACCEPT are collected, as shown in the following example. {LogStreamName: LogStreamTest,Timestamp: 0,
Message: ACCEPT OK,IngestionTime: 0,EventId: 0}
|
|
Extract Original Event |
To forward only the original event that was added to the CloudWatch logs to JSA, select this option. CloudWatch logs wrap the events that they receive with extra metadata. The original event is the value for the message key that is extracted from the CloudWatch log. The following CloudWatch logs event example shows the original event that is extracted from the CloudWatch log in bold text: {"owner":"123456789012","subscriptionFilters":
["allEvents"],"logEvents":
[{"id":"35093963143971327215510178578576502306458824699048362100","mes
sage":"{\"eventVersion\":\"1.05\",\"userIdentity\":
{\"type\":\"AssumedRole\",\"principalId\":\"ARO1GH58EM3ESYDW3XHP6:test
_session\",\"arn\":\"arn:aws:sts::123456789012:assumed-role\/
CVDevABRoleToBeAssumed\/
test_visibility_session\",\"accountId\":\"123456789012\",\"accessKeyId
\":\"ASIAXXXXXXXXXXXXXXXX\",\"sessionContext\":{\"sessionIssuer\":
{\"type\":\"Role\",\"principalId\":\"AROAXXXXXXXXXXXXXXXXX\",\"arn\":\
"arn:aws:iam::123456789012:role\/
CVDevABRoleToBeAssumed\",\"accountId\":\"123456789012\",\"userName\":\
"CVDevABRoleToBeAssumed\"},\"webIdFederationData\":{},\"attributes\":
{\"mfaAuthenticated\":\"false\",\"creationDate\":\"2019-11-13T17:01:54
Z\"}}},\"eventTime\":\"2019-11-13T17:43:18Z\",\"eventSource\":\"cloudt
rail.amazonaws.com\",\"eventName\":\"DescribeTrails\",\"awsRegion\":\"
apnortheast-
1\",\"sourceIPAddress\":\"192.0.2.1\",\"requestParameters\":
null,\"responseElements\":null,\"requestID\":\"41e62e80-
b15d-4e3f-9b7e-b309084dc092\",\"eventID\":\"904b3fda-8e48-46c0-a923-
f1bb2b7a2f2a\",\"readOnly\":true,\"eventType\":\"AwsApiCall\",\"recipi
entAccountId\":\"123456789012\"}","timestamp":1573667733143}],"message
Type":"DATA_MESSAGE","logGroup":"CloudTrail\/
DefaultLogGroup","logStream":"123456789012_CloudTrail_us-east-2_2"}
|
|
Use As A Gateway Log Source |
If you do not want to define a custom log source identifier for events, ensure that this check box is clear. |
|
Log Source Identifier Pattern |
If you selected Use As A Gateway Log Source, use this option to define a custom Log Source Identifier for events that are being processed. Use key-value pairs to define the custom Log Source Identifier. The key is the Identifier Format String, which is the resulting source or origin value. The value is the associated regex pattern that is used to evaluate the current payload. This value also supports capture groups that can be used to further customize the key. Define multiple key-value pairs by typing each pattern on a new line. Multiple patterns are evaluated in the order that they are listed. When a match is found, a custom Log Source Identifier displays. The following examples show multiple key-value pair functions.
|
|
Use Proxy |
If JSA accesses the Amazon Web Service by using a proxy, select this option. If the proxy requires authentication, configure the Proxy Server, Proxy Port, Proxy Username, and Proxy Password fields. If the proxy does not require authentication, configure the Proxy Server and Proxy Port fields. |
|
Automatically Acquire Server Certificate(s) |
Select Yes for JSA to automatically download the server certificate and begin trusting the target server. You can use this option to initialize a newly created log source and obtain certificates, or to replace expired certificates. |
|
EPS Throttle |
The upper limit for the maximum number of events per second (EPS). The default is 5000. If the Use As A Gateway Log Source option is selected, this value is optional. If the EPS Throttle parameter value is left blank, no EPS limit is imposed by JSA. |
Apache Kafka Protocol Configuration Options
JSA uses the Apache Kafka protocol to read streams of event data from topics in a Kafka cluster that uses the Consumer API. A topic is a category or feed name in Kafka where messages are stored and published. The Apache Kafka protocol is an outbound or active protocol, and can be used as a gateway log source by using a custom log source type.
The Apache Kafka protocol supports topics of almost any scale. You can configure multiple JSA collection hosts (EP/ECs) to collect from a single topic; for example, all firewalls. For more information, see the Kafka Documentation.
The following table describes the protocol-specific parameters for the Apache Kafka protocol:
|
Parameter |
Description |
|---|---|
|
Bootstrap Server List |
The <hostname/ip>:<port> the bootstrap server (or servers). Multiple servers can be specified in a comma-separated list, such as in this example: hostname1:9092,10.1.1.1:9092 |
|
Consumer Group |
A unique string or label that identifies the consumer group this log source belongs to. Each record that is published to a Kafka topic is delivered to one consumer instance within each subscribing consumer group. Kafka uses these labels to load balance the records over all consumer instances in a group. |
|
Topic Subscription Method |
The method that is used for subscribing to Kafka topics. Use the List Topics option to specify specific a list of topics. Use the Regex Pattern Matching option to specify a regular expression to match against available topics. |
|
Topic List |
A list of topic names to subscribe to. The list must be comma-separated; for example: Topic1,Topic2,Topic3. This option is only displayed when List Topics is selected for the Topic Subscription Method option. |
|
Topic Filter Pattern |
A regular expression to match the topics to subscribe to. This option is only displayed when Regex Pattern Matching is selected for the Topic Subscription Method option. |
|
Use SASL Authentication |
This option displays SASL authentication configuration options. When used without client authentication, you
must place a copy of the server certificate in the |
|
Use Client Authentication |
Displays the client authentication configuration options. |
|
/Key Store/Trust Store Type |
The archive file format for your keystore and truststore type. The following options are available for the archive file format:
|
|
Trust Store Filename |
The name of the truststore file. The truststore must be placed in /opt/qradar/conf/trusted_certificates/ kafka/. The file contains the username and password. |
|
Keystore Filename |
The name of the keystore file. The keystore must be placed in /opt/qradar/conf/trusted_certificates/ kafka/. The file contains the username and password. |
|
Use As A Gateway Log Source |
This option enables collected events to go through the JSA Traffic Analysis engine and to automatically detect the appropriate log sources. |
|
Log Source Identifier Pattern |
Defines a custom Log Source Identifier for events that are being processed, if the Use As A Gateway Log Source checkbox is selected. Key-value pairs are used to define the custom Log Source Identifier. The key is the Identifier Format String, which is the resulting source or origin value. The value is the associated regex pattern that is used to evaluate the current payload. This value also supports capture groups that can be used to further customize the key. Multiplekey-value pairs are defined by typing each pattern on a new line. Multiple patterns are evaluated in the order that they are listed. When a match is found, a custom Log Source Identifier is displayed. The following examples show multiple key-value pair functions. Patterns
Events
Resulting custom log source identifier
|
|
Character Sequence Replacement |
Replaces specific literal character sequences in the event payload to actual characters. One or more of the following options are available:
|
|
EPS Throttle |
The maximum number of events per second (EPS). No throttling is applied if the field is empty. |
- Configuring Apache Kafka to Enable Client Authentication
- Configuring Apache Kafka to enable SASL Authentication
- Troubleshooting Apache Kafka
Configuring Apache Kafka to Enable Client Authentication
This task discusses how to enable Client Authentication with Apache Kafka.
Ensure that the ports that are used by the Kafka server are not blocked by a firewall.
To enable client authentication between the Kafka consumers (JSA) and a Kafka brokers, a key and certificate for each broker and client in the cluster must be generated. The certificates also need to be signed by a certificate authority (CA).
In the following steps, you generate a CA, sign the client and broker certificates with it, and add it to the client and broker truststores. You also generate the keys and certificates by using the Java keytool and OpenSSL. Alternatively, an external CA can be used along with multiple CAs, one for signing broker certificates and another for client certificates.
-
Generate the truststore, keystore, private key, and CA certificate.
Note:Replace PASSWORD, VALIDITY, SERVER_ALIAS and CLIENT_ALIAS in the following commands with appropriate values.
-
Generate Server keystore.
Note:The common name (CN) of the broker certificates must match the fully qualified domain name (FQDN) of the server/host. The Kafka Consumer client that is used by JSA compares the CN with the DNS domain name to ensure that it is connecting to the correct broker instead of a malicious one. Make sure to enter the FQDN for the CN/First and Last name value when you generate the Server keystore.
keytool -keystore kafka.server.keystore.jks -alias SERVER_ALIAS -validity VALIDITY -genkeykeytool -keystore kafka.server.keystore.jks -alias server.hostname -validity 365 -genkey
-
Generate CA Certificate.
Note:This CA certificate can be used to sign all broker and client certificates.
openssl req -new -x509 -keyout ca-key -out ca-cert -days VALIDITYkeytool -keystore kafka.server.truststore.jks -alias CARoot -import -file ca-cert
-
Create Server truststore and import CA Certificate.
keytool -keystore kafka.server.truststore.jks -alias CARoot -import -file ca-cert -
Create Client truststore and import CA Certificate.
keytool -keystore kafka.client.truststore.jks -alias CARoot -import -file ca-cert -
Generate a Server Certificate and sign it using the CA.
keytool -keystore kafka.server.keystore.jks -alias SERVER_ALIAS -certreq -file cert-file openssl x509 -req -CA ca-cert -CAkey ca-key -in cert-file -out cert-signed -days VALIDITY -CAcreateserialkeytool -keystore kafka.server.keystore.jks -alias server.hostname -certreq -file cert-file openssl x509 -req -CA ca-cert -CAkey ca-key -in cert-file -out cert-signed -days 365 -CAcreateserial
-
Import CA Certificate into the Server keystore.
keytool -keystore kafka.server.keystore.jks -alias CARoot -import -file ca-cert -
Import Signed Server Certificate to the Server keystore.
keytool -keystore kafka.server.keystore.jks -alias SERVER_ALIAS -import -file cert-signedkeytool -keystore kafka.server.keystore.jks -alias server.hostname -import -file cert-signed
-
Export the Server Certificate into the binary DER file.
Note:The
keytool -exportcertcommand uses the DER format by default. Place the certificate in the trusted_certificates/ directory of any EP that communicates with Kafka. You need the server certificate for every bootstrap server that you use in the configuration. Otherwise, JSA rejects the TLS handshake with the server.keytool -exportcert -keystore kafka.server.keystore.jks -alias SERVER_ALIAS -file SEVER_ALIAS.derkeytool -exportcert -keystore kafka.server.keystore.jks -alias server.hostname -file server.hostname.der
-
Generate a Client keystore.
keytool -keystore kafka.client.keystore.jks -alias CLIENT_ALIAS -validity VALIDITY -genkeykeytool -keystore kafka.client.keystore.jks -alias client.hostname -validity 365 -genkey
-
Generate a Client Certificate and sign it using the CA.
keytool -keystore kafka.client.keystore.jks -alias CLIENT_ALIAS -certreq
                    -file client-cert-file
openssl x509 -req -CA ca-cert -CAkey ca-key -in client-cert-file -out client-cert-signed -days VALIDITY -CAcreateserial
keytool -keystore kafka.client.keystore.jks -alias client.hostname -certreq -file
client-cert-file
openssl x509 -req -CA ca-cert -CAkey ca-key -in client-cert-file -out
client-cert-signed -days 365 -CAcreateserial
-
Import CA Certificate into the Client keystore.
keytool -keystore kafka.client.keystore.jks -alias CARoot -import -file ca-certkeytool -keystore kafka.client.keystore.jks -alias client.hostname -import -file client-cert-signed
-
Import Signed Client Certificate to the Client keystore.
keytool -keystore kafka.client.keystore.jks -alias CLIENT_ALIAS -import -file client-cert-signed -
Copy Client keystore and truststore and to JSA.
-
Copy the
kafka.client.keystore.jksandkafka.client.truststore.jksto /opt/qradar/conf/trusted_certificates/kafka/ on each of the Event processors that the log source is configured for. -
Copy the server certificates <filename>.der that were generated for each broker to /opt/qradar/conf/trusted_certificates/.
-
-
-
Configure Kafka brokers for Client Authentication.
-
Find the Socket Server Settings section.
-
Complete 1 of the following options:
-
If you are not using SASL Authentication, change listeners=PLAINTEXT://:<port> to listeners=SSL://:<PORT> and add
security.inter.broker.protocol=SSL. -
If you are using SASL Authentication, change listeners=PLAINTEXT://:<port> to listeners=SSL://:<PORT> and add
security.inter.broker.protocol=SASL_SSL
-
-
Change listeners=PLAINTEXT://:<port> to listeners=SSL://:<PORT>.
-
Add the following properties to force encrypted communication between brokers and between the brokers and clients. Adjust the paths, file names, and passwords as you need them. These properties are the truststore and keystore of the server:
ssl.client.auth=requiredssl.keystore.location=/somefolder/kafka.server.keystore.jksssl.keystore.password=test1234ssl.key.password=test1234ssl.truststore.location=/somefolder/kafka.server.truststore.jksssl.truststore.password=test1234Note:Since the passwords are stored in plain text in the
server.properties, it is advised that access to the file is restricted by way of file system permissions. -
Restart the Kafka brokers that had their
server.propertiesmodified.
-
Configuring Apache Kafka to enable SASL Authentication
This task discusses how to enable SASL Authentication with Apache Kafka without SSL Client Authentication.
If you are using SASL Authentication with Client Authentication enabled, see Configuring Apache Kafka to Enable Client Authentication.
-
Ensure that the ports that are used by the Kafka server are not blocked by a firewall.
-
To enable client authentication between the Kafka consumers (JSA) and a Kafka brokers, a key and certificate for each broker and client in the cluster must be generated. The certificates also need to be signed by a certificate authority (CA).
In the following steps, you generate a CA, sign the client and broker certificates with it, and add it to the broker truststores. You also generate the keys and certificates by using the Java keytool and OpenSSL. Alternatively, an external CA can be used along with multiple CAs, one for signing broker certificates and another for client certificates.
-
Generate the truststore, keystore, private key, and CA certificate.
Note:Replace PASSWORD, VALIDITY, SERVER_ALIAS and CLIENT_ALIAS in the following commands with appropriate values.
-
Generate Server keystore.
Note:The common name (CN) of the broker certificates must match the fully qualified domain name (FQDN) of the server/host. The Kafka Consumer client that is used by JSA compares the CN with the DNS domain name to ensure that it is connecting to the correct broker instead of a malicious one. Make sure to enter the FQDN for the CN/First and Last name value when you generate the Server keystore.
keytool -keystore kafka.server.keystore.jks -alias SERVER_ALIAS -validity VALIDITY -genkeykeytool -keystore kafka.server.keystore.jks -alias server.hostname -validity 365 -genkey
-
Generate CA Certificate.
Note:This CA certificate can be used to sign all broker and client certificates.
openssl req -new -x509 -keyout ca-key -out ca-cert -days VALIDITYopenssl req -new -x509 -keyout ca-key -out ca-cert -days 365
-
Create Server truststore and import CA Certificate.
keytool -keystore kafka.server.truststore.jks -alias CARoot -import -file ca-cert -
Generate a Server Certificate and sign it using the CA.
keytool -keystore kafka.server.keystore.jks -alias SERVER_ALIAS -certreq
                    -file cert-file
openssl x509 -req -CA ca-cert -CAkey ca-key -in cert-file -out cert-signed -days VALIDITY -CAcreateserialkeytool -keystore kafka.server.keystore.jks -alias server.hostname -certreq -file cert-file openssl x509 -req -CA ca-cert -CAkey ca-key -in cert-file -out cert-signed -days 365 -CAcreateserial
-
Import CA Certificate into the Server keystore.
keytool -keystore kafka.server.keystore.jks -alias CARoot -import -file ca-cert -
Import Signed Server Certificate to the Server keystore.
keytool -keystore kafka.server.keystore.jks -alias SERVER_ALIAS -import -file cert-signedkeytool -keystore kafka.server.keystore.jks -alias server.hostname -import -file cert-signed
-
Export the Server Certificate into the binary DER file.
Note:The
keytool -exportcertcommand uses the DER format by default. Place the certificate in the trusted_certificates/ directory of any EP that communicates with Kafka. You need the server certificate for every bootstrap server that you use in the configuration. Otherwise, JSA rejects the TLS handshake with the server.keytool -exportcert -keystore kafka.server.keystore.jks -alias SERVER_ALIAS -file SEVER_ALIAS.derkeytool -exportcert -keystore kafka.server.keystore.jks -alias server.hostname -file server.hostname.der
-
-
Configure Kafka brokers for Client Authentication.
-
Find the Socket Server Settings section and then change listeners=PLAINTEXT://:<port>to listeners=SSL://:<PORT>.
-
Add the following properties to force encrypted communication between brokers and between the brokers and clients. Adjust the paths, file names, and passwords as you need them. These properties are the truststore and keystore of the server:
security.inter.broker.protocol=SASL_SSLssl.client.auth=nonessl.keystore.location=/somefolder/kafka.server.keystore.jksssl.keystore.password=test1234ssl.key.password=test1234ssl.truststore.location=/somefolder/kafka.server.truststore.jksssl.truststore.password=test1234Note:Since the passwords are stored in plain text in the server.properties, it is advised that access to the file is restricted by way of file system permissions.
-
Restart the Kafka brokers that had their server.properties modified.
-
Troubleshooting Apache Kafka
This reference provides troubleshooting options for configuring Apache Kafka to enable Client Authentication.
|
Issue |
Solution |
|---|---|
|
The Use As A Gateway Log Source option is selected in the log source configuration, but log sources are not being automatically detected. |
Events being streamed from Kafka must contain a valid Syslog RFC3164 or RFC5424 compliant header, so JSA can correctly determine the log source identifier of each event. |
|
No events are being received and the following error is displayed in the log
source configuration form: “ |
Verify that the bootstrap server and port details that are entered into the configuration are valid. If Client Authentication is enabled, verify the following things:
|
|
No events are being received and the following error is displayed in the log
source configuration form: “ |
When you use the List Topics options to subscribe to topics, JSA attempts to verify the topics available in the Kafka cluster to the specified topics when the log source is initially started. If no topics match between what was entered in the configuration and what is available on the cluster, you are presented with this message. Verify the topic names that are entered in the configuration; also, consider the use of the Regex Pattern Matching option for subscribing to topics. |
|
When any parameter value in the property file on the Kafka server is changed, expected results are not received. |
Disable, then re-enable the Kafka log source. |
Blue Coat Web Security Service REST API Protocol Configuration Options
To receive events from Blue Coat Web Security Service, configure a log source to use the Blue Coat Web Security Service REST API protocol.
The Blue Coat Web Security Service REST API protocol is an outbound/active protocol that queries the Blue Coat Web Security Service Sync API and retrieves recently hardened log data from the cloud.
The following table describes the protocol-specific parameters for the Blue Coat Web Security Service REST API protocol:
|
Parameter |
Description |
|---|---|
|
API Username |
The API user name that is used for authenticating with the Blue Coat Web Security Service. The API user name is configured through the Blue Coat Threat Pulse Portal. |
|
Password |
The password that is used for authenticating with the Blue Coat Web Security Service. |
|
Confirm Password |
Confirmation of the Password field. |
|
Use Proxy |
When you configure a proxy, all traffic for the log source travels through the proxy for JSA to access the Blue Coat Web Security Service. Configure the Proxy IP or Hostname, Proxy Port, Proxy Username, and Proxy Password fields. If the proxy does not require authentication, you can leave the Proxy Username and Proxy Password fields blank. |
|
Recurrence |
You can specify when the log collects data. The format is M/H/D for Months/Hours/Days. The default is 5 M. |
|
EPS Throttle |
The upper limit for the maximum number of events per second (EPS). The default is 5000. |
Centrify Redrock REST API Protocol Configuration Options
The Centrify Redrock REST API protocol is an outbound/active protocol for JSA that collects events from Centrify Identity Platform.
The Centrify Redrock REST API protocol supports Centrify Identity Platform and CyberArk Identity Security Platform.
The following parameters require specific values to collect events from Centrify Identity Platform:
|
Parameter |
Value |
|---|---|
|
Log Source type |
Centrify Identity Platform |
|
Protocol Configuration |
Centrify Redrock REST API |
|
Log Source Identifier |
A unique name for the log source. The Log Source Identifier can be any valid value and does not need to reference a specific server. The Log Source Identifier can be the same value as the Log Source Name. If you have more than one Centrify Identity Platform log source that is configured, you might want to identify the first log source as centrify1, the second log source as centrify2, and the third log source as centrify3. |
|
Tenant ID |
The Centrify assigned unique customer or tenant ID. |
|
Tenant URL |
Automatically generated tenant URL for the specified tenant ID. For example,
|
|
Username |
The user name that is associated with the Cloud service for Centrify Identity Platform. |
|
Password |
The password that is associated with the Centrify Identity Platform user name. |
|
Event Logging Filter |
Select the logging level of the events that you want to retrieve. Info, Warning and Error are selectable. At least one filter must be selected. |
|
Allow Untrusted Certificates |
Enable this option to allow self-signed, untrusted certificates. Do not enable this option for SaaS hosted tenants. However, if required, you can enable this option for other tenant configurations. The certificate must be downloaded in PEM or DER encoded binary format and then placed in the /opt/ qradar/conf/trusted_certificates/ directory with a .cert or .crt file extension. |
|
Use Proxy |
When a proxy is configured, all traffic from the Centrify Redrock REST API travels through the proxy. Configure the Proxy Server, Proxy Port, Proxy Username, and Proxy Password fields. If the proxy does not require authentication, you can leave the Proxy Username and Proxy Password fields blank. |
|
EPS Throttle |
The maximum number of events per second. The default is 5000. |
|
Recurrence |
The time interval can be in hours (H), minutes (M) or days (D). The default is 5 minutes (5M). |
Cisco Firepower EStreamer Protocol Configuration Options
To receive events from a Cisco Firepower eStreamer (Event Streamer) service, configure a log source to use the Cisco Firepower eStreamer protocol.
The Cisco Firepower eStreamer protocol is formerly known as Sourcefire Defense Center eStreamer protocol.
The Cisco firepower eStreamer protocol is an inbound/passive protocol.
Event files are streamed to JSA to be processed after the Cisco Firepower Management Center DSM is configured.
The following table describes the protocol-specific parameters for the Cisco Firepower eStreamer protocol:
|
Parameter |
Description |
|---|---|
|
Protocol Configuration |
Cisco Firepower eStreamer |
|
Server Port |
The port number that the Cisco Firepower eStreamer services is configured to accept connection requests on. The default port that JSA uses for Cisco Firepower eStreamer is 8302. |
|
Keystore Filename |
The directory path and file name for the keystore private key and associated certificate. By default, the import script creates the keystore file in the following directory: /opt/qradar/conf/estreamer.keystore. |
|
Truststore Filename |
The directory path and file name for the truststore files. The truststore file contains the certificates that are trusted by the client. By default, the import script creates the truststore file in the following directory: /opt/qradar/conf/estreamer.truststore. |
|
Request Extra Data |
Select this option to request extra data from Cisco Firepower Management Center, for example, extra data includes the original IP address of an event. |
|
Domain |
Note:
Domain Streaming Requests are supported only for eStreamer version 6.x. Leave the Domain field blank for eStreamer version5.x. The domain where the events are streamed from. The value in the Domain field must be a fully qualified domain. This means that all ancestors of the desired domain must be listed starting with the top-level domain and ending with the leaf domain that you want to request events from. Example: Global is the top level domain, B is a second level domain that is a subdomain of Global, and C is a third-level domain and a leaf domain that is a subdomain of B. To request events from C, type the following value for the Domain parameter: Global \ B \ C |
Cisco NSEL Protocol Configuration Options
To monitor NetFlow packet flows from a Cisco Adaptive Security Appliance (ASA), configure the Cisco Network Security Event Logging (NSEL) protocol source.
The Cisco NSEL protocol is an inbound/passive protocol. To integrate Cisco NSEL with JSA, you must manually create a log source to receive NetFlow events. JSA does not automatically discover or create log sources for syslog events from Cisco NSEL.
The following table describes the protocol-specific parameters for the Cisco NSEL protocol:
|
Parameter |
Description |
|---|---|
|
Protocol Configuration |
Cisco NSEL |
|
Log Source Identifier |
If the network contains devices that are attached to a management console, you can specify the IP address of the individual device that created the event. A unique identifier for each, such as an IP address, prevents event searches from identifying the management console as the source for all of the events. |
|
Collector Port |
The UDP port number that Cisco ASA uses to forward NSEL events. JSA uses port 2055 for flow data on JSA Flow Processors. You must assign a different UDP port on the Cisco Adaptive Security Appliance for NetFlow. |
EMC VMware Protocol Configuration Options
To receive event data from the VMWare web service for virtual environments, configure a log source to use the EMC VMWare protocol.
The EMC VMware protocol is an outbound/active protocol.
JSA supports the following event types for the EMC VMware protocol:
-
Account Information
-
Notice
-
Warning
-
Error
-
System Informational
-
System Configuration
-
System Error
-
User Login
-
Misc Suspicious Event
-
Access Denied
-
Information
-
Authentication
-
Session Tracking
The following table describes the protocol-specific parameters for the EMC VMware protocol:
|
Parameter |
Description |
|---|---|
|
Protocol Configuration |
EMC VMware |
|
Log Source Identifier |
The value for this parameter must match the VMware IP parameter. |
|
VMware IP |
The IP address of the VMWare ESXi server. The VMware protocol appends the IP address of your VMware ESXi server with HTTPS before the protocol requests event data. |
Forwarded Protocol Configuration Options
To receive events from another Console in your deployment, configure a log source to use the Forwarded protocol.
The Forwarded protocol is an inbound/passive protocol that is typically used to forward events to another JSA Console. For example, Console A has Console B configured as an off-site target. Data from automatically discovered log sources is forwarded to Console B. Manually created log sources on Console A must also be added as a log source to Console B with the forwarded protocol.
Google Cloud Pub/Sub Protocol Configuration Options
The Google Cloud Pub/Sub protocol is an outbound/active protocol for JSA that collects Google Cloud Platform (GCP) logs.
If automatic updates are not enabled, download the GoogleCloudPubSub protocol RPM from the https://support.juniper.net/support/downloads/.
Google Cloud Pub/Sub protocol is supported on JSA 7.3.2 Patch 6 or later.
The following table describes the protocol-specific parameters for collecting Google Cloud Pub/Sub logs with the Google Cloud Pub/Sub protocol:
|
Parameter |
Description |
|---|---|
|
Service Account Credential Type |
Specify where the required Service Account Credentials are coming from. Ensure that the associated service account has the Pub/Sub Subscriber role or the more specific pubsub.subscriptions.consume permission on the configured Subscription Name in GCP. User Managed Key Provided in the Service Account Key field by inputting the full JSON text from a downloaded Service Account Key. GCP Managed Key Ensure that the JSA managed host is running in a GCP Compute instance and the Cloud API access scopes include Cloud Pub/Sub. |
|
Subscription Name |
The full name of the Cloud Pub/Sub subscription. For example, projects/my-project/subscriptions/my-subscription. |
|
Use As A Gateway Log Source |
Select this option for the collected events to flow through the JSA Traffic Analysis engine and for JSA to automatically detect one or more log sources. When you select this option, the Log Source Identifier Pattern can optionally be used to define a custom Log Source Identifier for events being processed. |
|
Log Source Identifier Pattern |
When the Use As A Gateway Log Source option is selected, use this option to define a custom log source identifier for events that are processed. If the Log Source Identifier Pattern is not configured, JSA receives events as unknown generic log sources. The Log Source Identifier Pattern field accepts key-value pairs, such as key=value, to define the custom Log Source Identifier for events that are being processed and for log sources to be automatically discovered when applicable. Key is the Identifier Format String which is the resulting source or origin value. Value is the associated regex pattern that is used to evaluate the current payload. The value (regex pattern) also supports capture groups which can be used to further customize the key (Identifier Format String). Multiple key-value pairs can be defined by typing each pattern on a new line. When multiple patterns are used, they are evaluated in order until a match is found. When a match is found, a custom Log Source Identifier displays. The following examples show the multiple key-value pair functionality: Patterns
Events
Resulting custom log source identifier
|
|
Use Proxy |
Select this option for JSA to connect to the GCP by using a proxy. If the proxy requires authentication, configure the Proxy Server, Proxy Port, Proxy Username, and Proxy Password fields. If the proxy does not require authentication, configure the Proxy Server and Proxy Port fields. |
|
Proxy IP or Hostname |
The IP or host name of the proxy server. |
|
Proxy Port |
The port number that is used to communicate with the proxy server. The default is 8080. |
|
Proxy Username |
Required only when the proxy requires authentication. |
|
Proxy Password |
Required only when the proxy requires authentication. |
|
EPS Throttle |
The upper limit for the maximum number of events per second (EPS) that this log source should not exceed. The default is 5000. If the Use As A Gateway Log Source option is selected, this value is optional. If the EPS Throttle parameter value is left blank, no EPS limit is imposed by JSA. |
- Configuring Google Cloud Pub/Sub to integrate with JSA
- Creating a Pub/Sub Topic and Subscription in the Google Cloud Console
- Creating a service account and a service account key in Google Cloud Console to access the Pub/Sub Subscription
- Populating a Pub/Sub topic with data
- Adding a Google Cloud Pub/Sub log source in JSA
Configuring Google Cloud Pub/Sub to integrate with JSA
Before you can add a log source in JSA, you must create a Pub/Sub Topic and Subscription, create a service account to access the Pub/Sub Subscription, and then populate the Pub/Sub topic with data.
To configure Google Cloud Pub/Sub to integrate with JSA, complete the following tasks:
Creating a Pub/Sub Topic and Subscription in the Google Cloud Console
A topic in Google Cloud Pub/Sub is where data is published. One or more subscribers can consume this data by using a subscription.
A subscription in Google Cloud Pub/Sub is a view into the topic data for a single subscriber or a group of subscribers. To collect data from Pub/Sub, JSA needs a dedicated subscription to the topic that is not shared by any other SIEM, business process, etc. However, multiple JSA event collectors within the same deployment can use the same subscription to load balance consumption from the same topic by using the Gateway Log Source option.
-
Create a topic. If you already have a topic that contains the data that you want to send to JSA, omit this step.
-
Log in to the Google Cloud Platform.
-
From the navigation menu, select Pub/Sub > Topics, and then click CREATE TOPIC.
-
In the Topic ID field, type a name for the topic.
-
In the Encryption section, ensure that Google-managed key is selected, and then click CREATE TOPIC.
-
-
Create a Subscription.
-
From the Pub/Sub navigation menu, select Subscriptions.
-
Click Create Subscription, and then configure the parameters.
The following table describes the parameter values that are required to create a subscription in Google Cloud Pub/Sub:
Table 17: Google Cloud Pub/Sub Create Subscription parameters for Google Cloud Pub/Sub Parameter
Description
Subscription ID
Type a new subscription name.
Select a Cloud Pub/Sub topic
Select a topic from the list.
Delivery type
Enable Pull.
Subscription expiration
Enable Expire after this many days to (365), and then type the number of days that you want to keep the subscription in the Days field; for example 31.
Acknowledgement deadline
To ensure that messages are processed only once, type 60 in the Seconds field.
Message retention duration
In the Days field, type the number of days that you want to retain unacknowledged messages; for example, 7. JSA acknowledges messages after consuming them.
Note:To ensure that messages are processed only once, do not select Retain acknowledged messages.
Proxy Port
The port number that is used to communicate with the proxy server.
The default is 8080.
Proxy Username
Required only when the proxy requires authentication.
Proxy Password
Required only when the proxy requires authentication.
EPS Throttle
The upper limit for the maximum number of events per second (EPS) that this log source should not exceed. The default is 5000.
If the Use As A Gateway Log Source option is selected, this value is optional.
If the EPS Throttle parameter value is left blank, no EPS limit is imposed by JSA.
-
Click CREATE.
-
Creating a service account and a service account key in Google Cloud Console to access the Pub/Sub Subscription
A service account must be created for JSA to authenticate with the Google Cloud Pub/Sub APIs.
The service account key contains the credentials for the service account in JSON format.
-
Create a Service account.
Omit this step if one of the following conditions apply:
-
You already have service account that you want to use.
-
You have a JSA All-in-One appliance or a JSA Event Collector that collects events from a JSA Cloud Platform Compute instance, and you are using GCP Managed Key as the Service Account Type option.
-
Log in to the Google Cloud Platform.
-
From the IAM & Admin navigation menu, select Service Accounts, and then click CREATE SERVICE ACCOUNT.
-
In the Service account field, type a name for the service account.
-
In the Service account description field, type a description for the service account.
-
Click CREATE.
-
-
Create a Service account key - JSON formatted service account credentials are downloaded to your computer from your web browser. If you use the User Managed Key option for the Service Account Key parameter when you configure a log source in JSA, you need the service account key value. If you use the GCP Managed Key option, omit this step.
-
Log in to the Google Cloud Platform.
-
From the navigation menu, select IAM & Admin > Service Accounts.
-
Select your service account from the Email list, and then select Create key from the Actions list.
-
Select JSON for the Key type, and then click CREATE.
-
-
Assign permissions to a service account - A service account must be created for JSA to authenticate with the Google Cloud Pub/Sub APIs. If you already have a service account, omit this step. If you have a JSA All-in-One appliance or a JSA Event Collector that collects events from a Google Cloud Platform Compute instance, and you are using GCP Managed Key as the Service Account Type option, omit this step.
-
Log in to the Google Cloud Platform.
-
From the navigation menu, select IAM & Admin > IAM, and then click Add.
-
Select the service account that you created in Step 1, or if you are using GCP Managed Keys, select the service account that is assigned to the Compute Instance that your JSA installation is using.
-
From the Role list, select Pub/Sub Subscriber. When you use the Pub/Sub Subscriber role, the service account reads and consumes messages from Pub/Sub topics. If you want to further limit the permissions, you can create a custom role with the pubsub.subscriptions.consume permission and assign it only to a specific subscription.
-
Click SAVE.
-
Populating a Pub/Sub topic with data
Some Google Cloud Platform services can write data to Pub/Sub topics by using a Logging Sink, or by using Stackdriver Agents that can be installed on Google Compute Engine instances.
Ensure that you have a Pub/Sub topic and subscription setup in Google Cloud Platform.
A common use case is to collect Cloud Audit Log Admin Activity from the Google Cloud Platform. Use the following example to the create the Logging Export Sink.
-
Log in to the Google Cloud Platform.
-
From the navigation menu, click Logging > Logs Viewer.
-
From the Audited Resource list, select Google Project.
-
From the Filter by label or text search list, select Convert to advanced filter.
-
In the Advanced filter field, type the
logName:"logs/cloudaudit.googleapis.com" command. -
Click CREATE SINK.
Adding a Google Cloud Pub/Sub log source in JSA
Set up a log source in JSA to use a custom log source type or a Juniper log source type that supports the Google Cloud Pub/Sub protocol.
You can use the Google Cloud Pub/Sub protocol to retrieve any type of event from the Google Cloud Pub/Sub service. Juniper provides DSMs for some Google Cloud services. Any services that don't have a DSM can be handled by using a custom log source type.
If you want to use an existing DSM to parse data, select the Use as a Gateway Log Source parameter option for more log sources to be created from data that is collected by this configuration. Alternatively, if log sources are not automatically detected, you can manually create them by using Syslog for the Protocol type parameter option.
-
Log in to JSA.
-
On the Admin tab, click the JSA Log Source Management app icon.
-
Click New Log Source > Single Log Source.
-
On the Select a Log Source Type page, select a custom log source type or a Juniper log source type that supports the Google Cloud Pub/Sub protocol.
-
On the Select a Protocol Type page, from the Select Protocol Type list, select Google Pub/Sub Protocol.
-
On the Configure the Log Source parameters page, configure the log source parameters, and then click Configure Protocol Parameters. For more information about configuring Google Cloud Pub/Sub protocol parameters, see Adding a Google Cloud Pub/Sub log source in JSA.
-
Test the connection to ensure that connectivity, authentication, and authorization are working. If available, view sample events from the subscription.
-
Click Test Protocol Parameters, and then click Start Test.
-
To fix any errors, click Configure Protocol Parameters, then test your protocol again.
-
Google G Suite Activity Reports REST API Protocol Options
The Google G Suite Activity Reports REST API protocol is an outbound/active protocol for JSA that retrieves logs from Google G Suite.
The Google G Suite Activity Reports REST API protocol is supported on JSA 7.3.2 Patch 6 or later.
The following table describes the protocol-specific parameters for the Google G Suite Activity Reports REST API protocol:
|
Parameter |
Description |
|---|---|
|
Log Source Identifier |
Type a unique name for the log source. The Log Source Identifier can be any valid value and does not need to reference a specific server. The Log Source Identifier can be the same value as the Log Source Name. If you have more than one Google G Suite log source that is configured, you might want to create unique identifiers. For example, you can identify the first log source as googlegsuite1, the second log source as googlegsuite2, and the third log source as googlegsuite3. |
|
User Account |
Google user account, which has reports privileges. |
|
Service Account Credentials |
Authorizes access to Google's APIs for retrieving the events. The Service Account Credentials are contained in a JSON formatted file that you download when you create a new service account in the Google Cloud Platform. |
|
Use Proxy |
If JSA accesses Google G Suite by using a proxy, enable this option. If the proxy requires authentication, configure the Proxy Server, Proxy Port, Proxy Username, and Proxy Password fields. If the proxy does not require authentication, configure the Proxy Server and Proxy Port fields. |
|
Recurrence |
The time interval between log source queries to the Google G Suite Activity Reports API for new events. The time interval can be in hours (H), minutes (M), or days (D). The default is 5 minutes. |
|
EPS Throttle |
The maximum number of events per second. |
|
Event Delay |
The delay, in seconds, for collecting data. Google G Suite logs work on an eventual delivery system. To ensure that no data is missed, logs are collected on a delay. The default delay is 7200 seconds (2 hours), and can be set as low as 0 seconds. |
Google G Suite Activity Reports REST API Protocol FAQ
Got a question? Check these frequently asked questions and answers to help you understand the Google G Suite Activity Reports REST API protocol
What is the event delay option used for?
The event delay option is used to prevent events from being missed. Missed events, in this context, occur because they become available after the protocol updated its query range to a newer timeframe than the event’s arrival time. If an event occurred but wasn't posted to the Google G Suite Activity Reports REST API, then when the protocol queries for that event's creation time, the protocol doesn't get that event.
Example 1: The following example shows how an event can be lost.
The protocol queries the Google G Suite Activity Reports REST API at 2:00 PM to collect events between 1:00 PM – 1:59 PM. The Google G Suite Activity Reports REST API response returns the events that are available in the Google G Suite Activity Reports REST API between 1:00 PM - 1:59 PM. The protocol operates as if all of the events are collected. Then, it sends the next query to the Google G Suite Activity Reports REST API at 3:00 PM to get events that occurred between 2:00 PM – 2:59 PM. The problem with this scenario is that the Google G Suite Activity Reports REST API might not include all of the events that occurred between 1:00 PM – 1:59 PM. If an event occurred at 1:58 PM, that event might not be available in the Google G Suite Activity Reports REST API until 2:03 PM. However, the protocol already queried the 1:00 PM – 1:59 PM time range, and can't requery that range without getting duplicated events. This delay can take multiple hours.
Example 2: The following example shows Example 1, except in this scenario a 15-minute delay is added.
This example uses a 15-minute delay when the protocol makes query calls. When the protocol makes a query call to the Google G Suite Activity Reports REST API at 2:00 PM, it collects the events that occurred between 1:00 - 1:45 PM. The protocol operates as if all of the events are collected. Then, it sends the next query to the Google G Suite Activity Reports REST API at 3:00 PM and collects all events that occurred between 1:45 PM – 2:45 PM. Instead of missing the event, as in Example 1, it gets picked up in the next query call between 1:45 PM - 2:45 PM.
Example 3: The following example shows Example 2, except in this scenario the events are available a day later.
If the event occurred at 1:58 PM, but only became available to the Google G Suite Activity Reports REST API at 1:57 PM the next day, then the event delay from Example 2 doesn't get that event. Instead, the event delay must be set to a higher value, in this case 24 hours.
How does the event delay option work?
Instead of querying from the last received event time to current time, the protocol queries from the last received event time to current time - <event delay>. The event delay is in seconds. For example, a delay of 15 minutes (900 seconds) means that it queries only up to 15 minutes ago. This query gives the Google G Suite Activity Reports REST API 15 minutes to make an event available before the event is lost. When the current time - <event delay> is less than the last received event time, the protocol doesn't query the Google G Suite Activity Reports REST API. Instead, it waits for the condition to pass before querying.
What value do I use for the event delay option?
The Google G Suite Activity Reports REST API can delay an event’s availability. To prevent any events from being missed, you can set the Event Delay parameter option value to 168 hours (one week). However, the larger the event delay, the less real time the results are. For example, with a 24-hour event delay, you see events 24 hours after they occur instead of immediately. The value depends on how much risk you're willing to take and how important real-time data is. The default delay of 2 hours (7200 seconds) provides a value that is set in real time and also prevents most events from being missed. For more information about the delay, see Data retention and lag times.
HTTP Receiver Protocol Configuration Options
To collect events from devices that forward HTTP or HTTPS requests, configure a log source to use the HTTP Receiver protocol.
The HTTP Receiver protocol is an inbound/passive protocol. The HTTP Receiver acts as an HTTP server on the configured listening port and converts the request body of any received POST requests into events. It supports both HTTPS and HTTP requests.
The following table describes the protocol-specific parameters for the HTTP Receiver protocol:
|
Parameter |
Description |
|---|---|
|
Protocol Configuration |
From the list, select HTTP Receiver. |
|
Log Source Identifier |
The IP address, hostname, or any name to identify the device. Must be unique for the log source type. |
|
Communication Type |
Select HTTP, or HTTPs, or HTTPs and Client Authentication. |
|
Client Certificate Path |
If you select HTTPs and Client Authentication as the communication type, you must set the absolute path to the client certificate. You must copy the client certificate to the JSA console or the Event Collector for the log source. |
|
TLS version |
The versions of TLS that can be used with this protocol. To use the most secure version, select the TLSv1.2 option. When you select an option with multiple available versions, the HTTPS connection negotiates the highest version available by both the client and server. |
|
Listen Port |
The port that is used by JSA to accept incoming HTTP Receiver events. The default port is 12469. Note:
Do not use port 514. Port 514 is used by the standard Syslog listener. |
|
Message Pattern |
By default, the entire HTTP POST is processed as a single event. To divide the POST into multiple single-line events, provide a regular expression to denote the start of each event. |
|
Use As A Gateway Log Source |
Select this option for the collected events to flow through the JSA Traffic Analysis engine and for JSA to automatically detect one or more log sources. |
|
Max Payload Length (Byte) |
The maximum payload size of a single event in bytes. The event is split when its payload size exceeds this value. The default value is 8192, and it must not be greater than 32767. |
|
Max POST method Request Length (MB) |
The max size of a POST method request body in MB. If a POST request body size exceeds this value, an HTTP 413 status code is returned. The default value is 5, and it must not be greater than 10. |
|
EPS Throttle |
The maximum number of events per second (EPS) that you do not want this protocol to exceed. The default is 5000. |
JDBC Protocol Configuration Options
JSA uses the JDBC protocol to collect information from tables or views that contain event data from several database types.
The JDBC protocol is an outbound/active protocol. JSA does not include a MySQL driver for JDBC. If you are using a DSM or protocol that requires a MySQL JDBC driver, you must download and install the platform independent MySQL Connector/J from http://dev.mysql.com/downloads/connector/j/.
-
Copy the Java archive (JAR) file to /opt/qradar/jars.
-
If you are using JSA 7.3.1, you must also copy the JAR file to/opt/ibm/si/services/ecs-ecingress/ eventgnosis/lib/q1labs/.
-
Restart Tomcat service by typing one of the following commands:
-
If you are using JSA 2014.8, type service tomcat restart
-
If you are using JSA 7.3.0 or JSA 7.3.1, type systemctl restart tomcat
-
-
Restart event collection services by typing one of the following commands:
-
If you are using JSA 2014.8, type service ecs-ec restart
-
If you are using JSA 7.3.0, type systemctl restart ecs-ec
-
If you are using JSA 7.3.1, type systemctl restart ecs-ec-ingress
-
The following table describes the protocol-specific parameters for the JDBC protocol:
|
Parameter |
Description |
|---|---|
|
Log Source Name |
Type a unique name for the log source. |
|
Log Source Description (Optional) |
Type a description for the log source. |
|
Log Source Type |
Select your Device Support Module (DSM) that uses the JDBC protocol from the Log Source Type list. |
|
Protocol Configuration |
JDBC |
|
Log Source Identifier |
Type a name for the log source. The name can't contain spaces and must be unique among all log sources of the log source type that is configured to use the JDBC protocol. If the log source collects events from a single appliance that has a static IP address or hostname, use the IP address or hostname of the appliance as all or part of the Log Source Identifier value; for example, 192.168.1.1 or JDBC192.168.1.1. If the log source doesn't collect events from a single appliance that has a static IP address or hostname, you can use any unique name for the Log Source Identifier value; for example, JDBC1, JDBC2. |
|
Database Type |
Select the type of database that contains the events. |
|
Database Name |
The name of the database to which you want to connect. |
|
IP or Hostname |
The IP address or hostname of the database server. |
|
Port |
Enter the JDBC port. The JDBC port must match the listen port that is configured on the remote database. The database must permit incoming TCP connections. The database must permit incoming TCP connections. The valid range is 1 - 65535. The defaults are:
If a Database Instance is used with the MSDE database type, administrators must leave the Port parameter blank in the log source configuration. |
|
Username |
A user account for JSA in the database. |
|
Password |
The password that is required to connect to the database. |
|
Confirm Password |
The password that is required to connect to the database. |
|
Authentication Domain (MSDE only) |
If you did not select Use Microsoft JDBC, Authentication Domain is displayed. The domain for MSDE that is a Windows domain. If your network does not use a domain, leave this field blank. |
|
Database Instance (MSDE or Informix only) |
The database instance, if required. MSDE databases can include multiple SQL server instances on one server. When a non-standard port is used for the database or access is blocked to port 1434 for SQL database resolution, the Database Instance parameter must be blank in the log source configuration. |
|
Predefined Query (Optional) |
Select a predefined database query for the log source. If a predefined query is not available for the log source type, administrators can select none. |
|
Table Name |
The name of the table or view that includes the event records. The table name can include the following special characters: dollar sign ($), number sign (#), underscore (_), en dash (-), and period (.). |
|
Select List |
The list of fields to include when the table is polled for events. You can use a comma-separated list or type an asterisk (*) to select all fields from the table or view. If a comma-separated list is defined, the list must contain the field that is defined in the Compare Field. |
|
Compare Field |
A numeric value or timestamp field from the table or view that identifies new events that are added to the table between queries. Enables the protocol to identify events that were previously polled by the protocol to ensure that duplicate events are not created. |
|
Use Prepared Statements |
Prepared statements enable the JDBC protocol source to set up the SQL statement, and then run the SQL statement numerous times with different parameters. For security and performance reasons, most JDBC protocol configurations can use prepared statements. |
|
Start Date and Time (Optional) |
Select or enter the start date and time for database polling. The format is yyyy-mm-dd HH:mm, where HH is specified using a 24 hour clock. If this parameter is empty, polling begins immediately and repeats at the specified polling interval. This parameter is used to set the time and date at which the protocol connects to the target database to initialize event collection. It can be used along with the Polling Interval parameter to configure specific schedules for the database polls. For example, to ensure that the poll happens at five minutes past the hour, every hour, or to ensure that the poll happens at exactly 1:00 AM each day. This parameter cannot be used to retrieve older table rows from the target database. For example, if you set the parameter to Last Week, the protocol does not retrieve all table rows from the previous week. The protocol retrieves rows that are newer than the maximum value of the Compare Field on initial connection. |
|
Polling Interval |
Enter the amount of time between queries to the event table. To define a longer polling interval, append H for hours or M for minutes to the numeric value The maximum polling interval is one week. |
|
EPS Throttle |
The number of Events Per Second (EPS) that you do not want this protocol to exceed. The valid range is 100 - 20,000. |
|
Security Mechanism (Db2 only) |
From the list, select the security mechanism that is supported by your Db2 server. If you don't want to select a security mechanism, select None. The default is None. For more information about security mechanisms that are supported by Db2 environments, see the https://support.juniper.net/support/downloads/. |
|
Use Named Pipe Communication (MSDE only) |
If you did not select Use Microsoft JDBC, Use Named Pipe Communication is displayed. MSDE databases require the username and password field to use a Windows authentication username and password and not the database username and password. The log source configuration must use the default named pipe on the MSDE database. |
|
Database Cluster Name (MSDE only) |
If you selected Use Named Pipe Communication, Use Named Pipe Communication parameter is displayed. If you are running your SQL server in a cluster environment, define the cluster name to ensure named pipe communication functions properly. |
|
Use NTLMv2 (MSDE only) |
If you did not select Use Microsoft JDBC, Use NTLMv2 is displayed. Select this option if you want MSDE connections to use the NTLMv2 protocol when they are communicating with SQL servers that require NTLMv2 authentication. This option does not interrupt communications for MSDE connections that do not require NTLMv2 authentication. Does not interrupt communications for MSDE connections that do not require NTLMv2 authentication. |
|
Use Microsoft JDBC (MSDE only) |
If you want to use the Microsoft JDBC driver, you must enable Use Microsoft JDBC. |
|
Use SSL (MSDE only) |
Select this option if your connection supports SSL. This option appears only for MSDE. |
|
SSL Certificate Hostname |
This field is required when both Use Microsoft JDBC and Use SSL are enabled. This value must be the fully qualified domain name (FQDN) for the host. The IP address is not permitted. For more information about SSL certificates and JDBC, see the procedures at the following links: |
|
Use Oracle Encryption |
Oracle Encryption and Data Integrity settings is also known as Oracle Advanced Security. If selected, Oracle JDBC connections require the server to support similar Oracle Data Encryption settings as the client. |
|
Database Locale (Informix only) |
For multilingual installations, use this field to specify the language to use. |
|
Code-Set (Informix only) |
The Code-Set parameter displays after you choose a language for multilingual installations. Use this field to specify the character set to use. |
|
Enabled |
Select this checkbox to enable the log source. By default, the checkbox is selected. |
|
Credibility |
From the list, select the Credibility of the log source. The range is 0 - 10. The credibility indicates the integrity of an event or offense as determined by the credibility rating from the source devices. Credibility increases if multiple sources report the same event. The default is 5. |
|
Target Event Collector |
Select the Target Event Collector to use as the target for the log source. |
|
Coalescing Events |
Select the Coalescing Events checkbox to enable the log source to coalesce (bundle) events. By default, automatically discovered log sources inherit the value of the Coalescing Events list from the System Settings in JSA. When you create a log source or edit an existing configuration, you can override the default value by configuring this option for each log source. |
|
Store Event Payload |
Select the Store Event Payload checkbox to enable the log source to store event payload information. By default, automatically discovered log sources inherit the value of the Store Event Payload list from the System Settings in JSA. When you create a log source or edit an existing configuration, you can override the default value by configuring this option for each log source. |
JDBC – SiteProtector Protocol Configuration Options
You can configure log sources to use the Java Database Connectivity (JDBC) - SiteProtector protocol to remotely poll IBM Proventia Management SiteProtector databases for events.
The JDBC - SiteProtector protocol is an outbound/active protocol that combines information from the SensorData1 and SensorDataAVP1 tables in the creation of the log source payload. The SensorData1 and SensorDataAVP1 tables are in the IBM Proventia Management SiteProtector database. The maximum number of rows that the JDBC - SiteProtector protocol can poll in a single query is 30,000 rows.
The following table describes the protocol-specific parameters for the JDBC - SiteProtector protocol:
|
Parameter |
Description |
|---|---|
|
Protocol Configuration |
JDBC - SiteProtector |
|
Database Type |
From the list, select MSDE as the type of database to use for the event source. |
|
Database Name |
Type RealSecureDB as the name of the database to which the protocol can connect. |
|
IP or Hostname |
The IP address or host name of the database server. |
|
Port |
The port number that is used by the database server. The JDBC SiteProtector configuration port must match the listener port of the database. The database must have incoming TCP connections enabled. If you define a Database Instance when with MSDE as the database type, you must leave the Port parameter blank in your log source configuration. |
|
Username |
If you want to track access to a database by the JDBC protocol, you can create a specific user for your JSA system. |
|
Authentication Domain |
If you select MSDE and the database is configured for Windows, you must define a Windows domain. If your network does not use a domain, leave this field blank. |
|
Database Instance |
If you select MSDE and you have multiple SQL server instances on one server, define the instance to which you want to connect. If you use a non-standard port in your database configuration, or access is blocked to port 1434 for SQL database resolution, you must leave the Database Instance parameter blank in your configuration. |
|
Predefined Query |
The predefined database query for your log source. Predefined database queries are only available for special log source connections. |
|
Table Name |
SensorData1 |
|
AVP View Name |
SensorDataAVP |
|
Response View Name |
SensorDataResponse |
|
Select List |
Type * to include all fields from the table or view. |
|
Compare Field |
SensorDataRowID |
|
Use Prepared Statements |
Prepared statements allow the JDBC protocol source to set up the SQL statement, and then execute the SQL statement numerous times with different parameters. For security and performance reasons, use prepared statements. You can clear this check box to use an alternative method of querying that does not use pre-compiled statements. |
|
Include Audit Events |
Specifies to collect audit events from IBM Proventia Management SiteProtector. |
|
Start Date and Time |
Optional. A start date and time for when the protocol can start to poll the database. |
|
Polling Interval |
The amount of time between queries to the event table. You can define a longer polling interval by appending H for hours or M for minutes to the numeric value. Numeric values without an H or M designator poll in seconds. |
|
EPS Throttle |
The number of Events Per Second (EPS) that you do not want this protocol to exceed. |
|
Database Locale |
For multilingual installations, use the Database Locale field to specify the language to use. |
|
Database Codeset |
For multilingual installations, use the Codeset field to specify the character set to use. |
|
Use Named Pipe Communication |
If you are using Windows authentication, enable this parameter to allow authentication to the AD server. If you are using SQL authentication, disable Named Pipe Communication. |
|
Database Cluster Name |
The cluster name to ensure that named pipe communications function properly. |
|
Use NTLMv2 |
Forces MSDE connections to use the NTLMv2 protocol with SQL servers that require NTLMv2 authentication. The Use NTLMv2 check box does not interrupt communications for MSDE connections that do not require NTLMv2 authentication. |
|
Use SSL |
Enables SSL encryption for the JDBC protocol. |
|
Log Source Language |
Select the language of the events that are generated by the log source. The log source language helps the system parse events from external appliances or operating systems that can create events in multiple languages. |
Juniper Networks NSM Protocol Configuration Options
To receive Juniper Networks NSM and Juniper Networks Secure Service Gateway (SSG) logs events, configure a log source to use the Juniper Networks NSM protocol.
The Juniper Networks NSM protocol is an inbound/passive protocol.
The following table describes the protocol-specific parameters for the Juniper Networks Network and Security Manager protocol:
|
Parameter |
Description |
|---|---|
|
Log Source Type |
Juniper Networks Network and Security Manager |
|
Protocol Configuration |
Juniper NSM |
Juniper Security Binary Log Collector Protocol Configuration Options
You can configure a log source to use the Security Binary Log Collector protocol. With this protocol, Juniper appliances can send audit, system, firewall, and intrusion prevention system (IPS) events in binary format to JSA.
The Security Binary Log Collector protocol in an inbound/passive protocol.
The binary log format from Juniper SRX Series Services Gateway or J Series appliances are streamed by using the UDP protocol. You must specify a unique port for streaming binary formatted events. The standard syslog port 514 cannot be used for binary formatted events. The default port that is assigned to receive streaming binary events from Juniper appliances is port 40798.
The following table describes the protocol-specific parameters for the Juniper Security Binary Log Collector protocol:
|
Parameter |
Description |
|---|---|
|
Protocol Configuration |
Security Binary Log Collector |
|
XML Template File Location |
The path to the XML file used to decode the binary stream from your Juniper SRX Series Services Gateway or Juniper J Series appliance. By default, the device support module (DSM) includes an XML file for decoding the binary stream. The XML file is in the following directory: /opt/qradar/conf/security_log.xml. |
Log File Protocol Configuration Options
To receive events from remote hosts, configure a log source to use the Log File protocol.
The Log File protocol is an outbound/active protocol that is intended for systems that write daily event logs. It is not appropriate to use the Log File protocol for devices that append information to their event files.
Log files are retrieved one at a time by using SFTP, FTP, SCP, or FTPS. The Log File protocol can manage plain text, compressed files, or file archives. Archives must contain plain-text files that can be processed one line at a time. When the Log File protocol downloads an event file, the information that is received in the file updates the Log Activity tab. If more information is written to the file after the download is complete, the appended information is not processed.
The following table describes the protocol-specific parameters for the Log File protocol:
|
Parameter |
Description |
|---|---|
|
Protocol Configuration |
Log File |
| Service Type |
Select the protocol to use when retrieving log files from a remote server.
The server that you specify in the Remote IP or Hostname field must enable the SFTP subsystem to retrieve log files with SCP or SFTP. |
|
Remote Port |
If the remote host uses a non-standard port number, you must adjust the port value to retrieve events. |
|
SSH Key File |
If the system is configured to use key authentication, type the SSH key. When an SSH key file is used, the Remote Password field is ignored. The SSH key must be located in the /opt/qradar/conf/keys directory. Note:
The SSH Key File field no longer accepts a file path. It can't contain "/" or "~". You must type the file name for the SSH key. The keys for existing configurations are copied to the /opt/qradar/ conf/keys directory. To ensure uniqueness, the keys must have “<Timestamp>” appended to the file name. |
|
Remote Directory |
For FTP, if the log files are in the remote users home directory, you can leave the remote directory blank. A blank remote directory field supports systems where a change in the working directory (CWD) command is restricted. |
|
Recursive |
Enable this checkbox to allow FTP or SFTP connections to recursively search subfolders of the remote directory for event data. Data that is collected from subfolders depends on matches to the regular expression in the FTP File Pattern. The Recursive option is not available for SCP connections. |
|
FTP File Pattern |
The regular expression (regex) that is needed to identify the files to download from the remote host. |
|
FTP Transfer Mode |
For ASCII transfers over FTP, you must select NONE in the Processor field and LINEBYLINE in the Event Generator field. |
| FTP TLS Version |
The versions of TLS that can be used with FTPS connections. To use the most secure version, select the TLSv1.2 option. When you select an option with multiple available versions, the FTPS connection negotiates the highest version available by both the client and server. This option can be configured only if you selected FTPS in the Service Type parameter. |
|
Recurrence |
The time interval to determine how frequently the remote directory is scanned for new event log files. The time interval can include values in hours (H), minutes (M), or days (D). For example, a recurrence of 2H scans the remote directory every 2 hours. |
|
Run On Save |
Starts the log file import immediately after you save the log source configuration. When selected, this checkbox clears the list of previously downloaded and processed files. After the first file import, the Log File protocol follows the start time and recurrence schedule that is defined by the administrator. |
|
EPS Throttle |
The number of Events Per Second (EPS) that the protocol cannot exceed. |
|
Change Local Directory? |
Changes the local directory on the Target Event Collector to store event logs before they are processed. |
|
Local Directory |
The local directory on the Target Event Collector. The directory must exist before the Log File protocol attempts to retrieve events. |
|
File Encoding |
The character encoding that is used by the events in your log file. |
|
Folder Separator |
The character that is used to separate folders for your operating system. Most configurations can use the default value in Folder Separator field. This field is intended for operating systems that use a different character to define separate folders. For example, periods that separate folders on mainframe systems. |
Configure JSA to Use FTPS for the Log File protocol
To configure FTPS for the Log File protocol, you must place server SSL certificates on all JSA Event Collectors that connect to your FTP server. If your SSL certificate is not RSA 2048, create a new SSL certificate.
The following command provides an example of creating a certificate on a LINUX system by using Open SSL:
openssl req -newkey rsa:2048 -nodes -keyout ftpserver.key -x509 -days 365 -out
            ftpserver.crt
Files on the FTP server that have a .crt file extension must be copied to the /opt/qradar/conf/ trusted_certificates directory on each of your Event Collectors.
Microsoft Azure Event Hubs Protocol Configuration Options
The Microsoft Azure Event Hubs protocol for JSA collects events from Microsoft Azure Event Hubs.
By default, each Event Collector can collect events from up to 1000 partitions before it runs out of file handles. If you want to collect from more partitions, you can contact Juniper Customer Support for advanced tuning information and assistance.
The following parameters require specific values to collect events from Microsoft Azure Event Hubs appliances:
|
Parameter |
Value |
|---|---|
|
Use Event Hub Connection String |
Authenticate with an Azure Event Hub by using a connection string. Note:
The ability to toggle this switch to off is deprecated. |
|
Event Hub Connection String |
Authorization string that provides access to an Event Hub. For example,
|
|
Consumer Group |
Specifies the view that is used during the connection. Each Consumer Group maintains its own session tracking. Any connection that shares consumer groups and connection information shares session tracking information. |
|
Use Storage Account Connection String |
Authenticates with an Azure Storage Account by using a connection string. Note:
The ability to toggle this switch to off is deprecated. |
|
Storage Account Connection String |
Authorization string that provides access to a Storage Account. For example,
|
|
Format Azure Linux Events To Syslog |
Formats Azure Linux logs to a single -line syslog format that resembles standard syslog logging from Linux systems. |
|
Use as a Gateway Log Source |
Select this option for the collected events to flow through the JSA Traffic Analysis engine and for JSA to automatically detect one or more log sources. When you select this option, the Log Source Identifier Pattern can optionally be used to define a custom Log Source Identifier for events that are being processed. |
|
Log Source Identifier Pattern |
When the Use As A Gateway Log Source option is selected, use this option to define a custom log source identifier for events that are processed. If the Log Source Identifier Pattern is not configured, JSA receives events as unknown generic log sources. The Log Source Identifier Pattern field accepts key-value pairs, such as key=value, to define the custom Log Source Identifier for events that are being processed and for log sources to be automatically discovered when applicable. Key is the Identifier Format String which is the resulting source or origin value. Value is the associated regex pattern that is used to evaluate the current payload. The value (regex pattern) also supports capture groups which can be used to further customize the key (Identifier Format String). Multiple key-value pairs can be defined by typing each pattern on a new line. When multiple patterns are used, they are evaluated in order until a match is found. When a match is found, a custom Log Source Identifier is displayed. The following examples show the multiple keyvalue pair functionality:
Patterns
Events
Resulting custom log source
identifier
|
|
Use Predictive Parsing |
If you enable this parameter, an algorithm extracts log source identifier patterns from events without running the regex for every event, which increases the parsing speed. Enable predictive parsing only for log source types that you expect to receive high event rates and require faster parsing. |
|
Use Proxy |
When you configure a proxy, all traffic for the log source travels through the proxy to access the Azure Event Hub. After you enable this parameter, configure the Proxy IP or Hostname, Proxy Port, Proxy Username, and Proxy Password fields. If the proxy does not need authentication, you can leave the Proxy Username and Proxy Password fields blank. Note:
Digest Authentication for Proxy is not supported in the Java SDK for Azure Event Hubs. For more information, see Azure Event Hubs - Client SDKs. |
|
Proxy IP or Hostname |
The IP address or hostname of the proxy server. This parameter appears when Use Proxy is enabled. |
|
Proxy Port |
The port number used to communicate with the proxy. The default value is 8080. This parameter appears when Use Proxy is enabled. |
|
Proxy Username |
The username for accessing the proxy server. This parameter appears when Use Proxy is enabled. |
|
Proxy Password |
The password for accessing the proxy server. This parameter appears when Use Proxy is enabled. |
|
EPS Throttle |
The maximum number of events per second (EPS). The default is 5000. |
The following table describes the Microsoft Azure Event Hubs log source parameters that are deprecated:
|
Parameter |
Value |
|---|---|
|
Deprecated - Namespace Name |
This option displays if Use Event Hub Connection String option is set to off. The name of the top-level directory that contains the Event Hub entities in the Microsoft Azure Event Hubs user interface. |
|
Deprecated - Event Hub Name |
This option displays if Use Event Hub Connection String option is set to off. The identifier for the Event Hub that you want to access. The Event Hub Name must match one of the Event Hub entities within the namespace. |
|
Deprecated - SAS Key Name |
This option displays if Use Event Hub Connection String option is set to off. The Shared Access Signature (SAS) name identifies the event publisher. |
|
Deprecated - SAS Key |
This option displays if Use Event Hub Connection String option is set to off. The Shared Access Signature (SAS) key authenticates the event publisher. |
|
Deprecated - Storage Account Name |
This option displays if Use Storage Account Connection String option is set to off. The name of the storage account that stores Event Hub data. The Storage Account Name is part of the authentication process that is required to access data in the Azure Storage Account. |
|
Deprecated - Storage Account Key |
This option displays if Use Storage Account Connection String option is set to off. An authorization key that is used for storage account authentication. The Storage Account Key is part of the authentication process that is required to access data in the Azure Storage Account. |
- Configuring Microsoft Azure Event Hubs to communicate with JSA
- Troubleshooting Microsoft Azure Event Hubs Protocol
Configuring Microsoft Azure Event Hubs to communicate with JSA
The Microsoft Azure Event Hubs protocol collects events that are inside of an Event Hub. This protocol collects events regardless of source provided they are inside the Event Hub. However, these events might not be parsable by an existing DSM.
To retrieve events in JSA, you need to create a Microsoft Azure Storage Account and an Event Hub entity under the Azure Event Hub Namespace. For every Namespace, port 5671 must be open. For every Storage Account, port 443 must be open.
These ports must be open as outbound ports on the JSA Event Collector.
The Namespace hostname is usually [Namespace
Name].servicebus.windows.net and the Storage Account hostname is usually
[Storage_Account_Name].blob.core.windows.net. The Event Hub must have
at least one Shared Access Signature that is created with Listen Policy and at least one
Consumer Group.
The Microsoft Azure Event Hubs protocol can't connect by using a proxy server.
-
Obtain a Microsoft Azure Storage Account Connection String.
The Storage Account Connection String contains authentication for the Storage Account Name and the Storage Account Key that is used to access the data in the Azure Storage account.
-
Log in to the Azure Portal.
-
From the dashboard, in the All resources section, select a Storage account.
-
From the All types list, disable Select All. In the filter items search box, type
Storage Accounts, and then select Storage Accounts from the list -
From the Storage account menu, select Access keys.
-
Record the value for the Storage account name. Use this value for the Storage Account Name parameter value when you configure a log source in JSA.
-
From the key 1 or key 2 section, record the following values.
-
Key - Use this value for the Storage Account Key parameter value when you configure a log source in JSA.
-
Connection string - Use this value for the Storage Account Connection String parameter value when you configure a log source in JSA.
DefaultEndpointsProtocol=https;AccountName=[Storage Account Name]
;AccountKey=[Storage Account Key];EndpointSuffix=core.windows.net]
Most storage accounts use core.window.net for the end-point suffix, but this value can change depending on its location. For example, a government-related storage account might have a different endpoint suffix value. You can use the Storage Account Name and Storage Account Key values, or you can use the Storage Account Connection String value to connect to the Storage Account. You can use key1 or key2.
Note:To connect to a Microsoft Azure Event Hub, you must be able to create a block blob on the Azure Storage Account you select. Page and append blob types are not compatible with the Microsoft Azure Event Hubs Protocol.
-
JSA creates a container that is named qradar in the provided storage blob.
Tip:Through the Azure Event Hubs SDK, JSA uses a container in the configured storage account blob to track event consumption from the Event Hub. A container that is named qradar is automatically created to store the tracking data, or you can manually create the container.
-
-
Obtain a Microsoft Azure Event Hub Connection String.
The Event Hub Connection String contains the Namespace Name, the path to the Event Hub within the namespace and the Shared Access Signature (SAS) authentication information.
-
Log in to the Azure Portal.
-
From the dashboard, in the All resources section, select an Event Hub. Record this value to use as the Namespace Name parameter value when you configure a log source in JSA.
-
In the Entities section, select Event Hub. Record this value to use for the Event Hub Name parameter value when you configure a log source in JSA.
-
From the All types list, disable Select All. In the filter items search box, type event hub, and then select Event Hubs Namespace from the list.
-
In the Event Hub section, select the event hub that you want to use from the list. Record this value to use for the Event Hub Name parameter value when you configure a log source in JSA.
-
In the Settings section, select Shared access policies.
Note:In the Entities section, ensure that the Consumer Groups option is listed. If Event Hubs is listed, return to 2 step c.
-
Select a POLICY that contains a Listen CLAIMS. Record this value to use for the SAS Key Name parameter value when you configure a log source in JSA.
-
Record the values for the following parameters:
-
Primary key or Secondary key
Use the value for the SAS Key parameter value when you configure a log source in JSA. The Primary key and Secondary key are functionally the same.
-
Connection string-primary key or Connection string-secondary key
Use this value for the Event Hub Connection String parameter value when you configure a log source in JSA. The Connection string-primary key and Connection string-secondary key are functionally the same.
Example :
Endpoint=sb://[Namespace Name].servicebus.windows.net
/;SharedAccessKeyName=[SAS Key Name];SharedAccessKey=[SAS Key];
EntityPath=[Event Hub Name]
You can use the Namespace Name, Event Hub Name, SAS Key Name and SAS Key values, or you can use the Event Hub Connection String value to connect to the Event Hub.
-
-
In the Entities section, select Consumer groups. Record the value to use for the Consumer Group parameter value when you configure a log source in JSA.
Note:Do not use the $Default consumer group that is automatically created. Use an existing consumer group that is not in use or create a new consumer group. Each consumer group must be used by only one device, such as JSA.
-
-
Troubleshooting Microsoft Azure Event Hubs Protocol
To resolve issues with the Microsoft Azure Event Hubs protocol use the troubleshooting and support information. Find the errors by using the protocol testing tools in the Juniper Secure Analytics Log Source Management app.
General troubleshooting
The following steps apply to all user input errors. The general troubleshooting procedure contains the first steps to follow any errors with the Microsoft Azure Event Hubs protocol.
-
If the Use Event Hub Connection String or Use Storage Account Connection String option is set to off, switch it to On. For more information about getting the connection strings, see Configuring Microsoft Azure Event Hubs to communicate with JSA.
-
Confirm that the Microsoft Azure event hub connection string follows the format in the following example. Ensure that the entityPath parameter value is the name of your event hub.
Endpoint=sb://<Namespace
Name>.servicebus.windows.net/;SharedAccessKeyName=<SAS Key
Name>;SharedAccessKey=<SAS Key>;EntityPath=<Event Hub Name>
After the log source is saved and closed, for security reasons, you can no longer see the entered values. If you don't see the values, enter them and then confirm their validity.
-
Confirm that the Microsoft Azure storage account connection string follows the format of the following example.
DefaultEndpointsProtocol=https;AccountName=<Storage Account
Name>;AccountKey=<Storage Account Key>;EndpointSuffix=core.windows.net
After the log source is saved and closed, for security reasons, you can no longer see the entered values. If you don't see the values, reenter them and then confirm their validity.
-
Optional: For troubleshooting, set Use As a Gateway Log Source to Off and set Format Azure Linux Events to Syslog to On. This forces all events to go through the selected log source type. This can quickly determine whether minimum events are arriving and that there is no network or access issue.
If you leave Use As a Gateway Log Source set to On, ensure that the events are not arriving in JSA as unknown, stored, or sim-generic. If they are, it might explain why the protocol appears to be not working.
-
Ensure that the provided consumer group exists for the selected event hub. For more information, see Configuring Microsoft Azure Event Hubs to communicate with JSA.
-
Enable the Automatically Acquire Server Certificate option or confirm that the certificate is manually added in JSA.
-
Ensure that the JSA system time is accurate; if the system time is not in real time, you might have network issues.
-
Ensure that the port 443 is open to the storage account host. The storage account host is usually <Storage_Account_Name>.<something>, where <something> usually refers to the endpoint suffix.
-
Ensure that port 5671 is open on the event hub host. The event hub host is usually the <Endpoint> from the event hub connection string.
For more information, see:
Illegal connection string format exception
Symptoms
Error: “Ensure that the Event Hub Connection String or Event Hub parameters are valid."
"This exception is thrown when the Event Hub Connection String or Event Hub information that is provided does not meet the requirements to be a valid connection string. An attempt will be made to query for content at the next retry interval."
Causes
The Event Hub Connection String doesn't match the specifications set by Microsoft. This error can also occur if unexpected characters, such as white space, are copied into the event hub connection string.
Resolving the problem
Follow these steps to resolve your illegal connection string error.
-
Ensure that the storage account connection string is valid and appears in a similar format to the following example:
Endpoint=sb://<Namespace
Name>.servicebus.windows.net/;SharedAccessKeyName=<SAS Key
Name>;SharedAccessKey=<SAS Key>;EntityPath=<Event Hub Name>
-
When you move the event hub connection string from the Azure portal to JSA, ensure that no additional white space or invisible characters are added. Alternatively, before you copy the string, ensure that you don't copy any additional characters or white space.
Storage exception
Symptoms
Error: “Unable to connect to the Storage Account [Storage Account Name]. Ensure that the Storage Account Connection String is valid and that JSA can connect to [Storage Account Host Name]."
"An error occurred that represents an exception for the Microsoft Azure Storage Service. An attempt will be made to query for content at the next retry interval."
Causes
Storage exception errors represent issues that occur when you authenticate with a storage account or when you communicate with a storage account. An attempt is made to query for content at the next retry interval. There are two common issues that might occur due to a storage exception.
-
The storage account connection string is invalid.
-
Network issues are preventing JSA from communicating with the storage account.
Resolving the problem
Follow these steps to resolve your storage exception error.
-
Ensure that the storage account connection string is valid and displays in a similar format to the following example.
DefaultEndpointsProtocol=https;AccountName=<Storage Account
Name>;AccountKey=<Storage Account Key>;EndpointSuffix=core.windows.net
-
Ensure that JSA can communicate with the storage account host on port 443.
-
Ensure that JSA can communicate with the event hub on ports 5671 and 5672.
-
Verify that the system time in JSA matches the current time. Security settings on the storage account prevent mismatched times between the server (storage account) and the client (JSA).
-
Ensure that a certificate is downloaded manually or by using the Automatically Acquire Server Certificate(s) option. The certificates are downloaded from
<Storage Account
                    Name>.blob.core.windows.net
.
Illegal Entity exception
Symptoms
Error: “An entity, such as the Event Hub, cannot be found. Verify that the Event Hub information provided is valid. This exception is thrown when the Event Hub Connection String or Event Hub information that is provided does not meet the requirements to be a valid connection string. An attempt will be made to query for content at the next retry interval.”
Error: "The messaging entity 'sb://qahub4.servicebus.windows.net/notreal' could not be found. To know more visit https://aka.ms/sbResourceMgrExceptions."
Error: "com.microsoft.azure.eventhubs.IllegalEntityException: The messaging entity 'sb:// qahub4.servicebus.windows.net/notreal' could not be found. To know more visit https://aka.ms/ sbResourceMgrExceptions."
Causes
The event hub (entity) doesn’t exist or the event hub connection string doesn’t contain a reference to an event hub (entity).
Resolving the problem
Follow these steps to resolve your illegal entity error.
-
Make sure that the event hub connection string contains the entitypath section and that it refers to the event hubs name. For example,
Endpoint=sb://<Namespace
Name>.servicebus.windows.net/;SharedAccessKeyName=<SAS Key
Name>;SharedAccessKey=<SAS Key>;EntityPath=<Event Hub Name>
-
Verify that the event hub exists on the Azure portal, and that the event hub path references the
entitypaththat you want to connect to. -
Verify that the consumer group is created and entered correctly in the Consumer Group field.
URI Syntax exception
Symptoms
Error: “The Storage Account URI is malformed. Ensure that the Storage Account information is valid and properly formatted. Unable to connect to the host.”
Error: "Could not parse text as a URI reference. For more information see the “Raw Error Message". An attempt will be made to query for content at the next retry interval."
Causes
The URI that is formed from the storage account connection string is invalid. The URI
is formed from the DefaultEndpointsProtocol, AccountName, and
EndpointSuffix fields. If one of these fields is altered, this
exception can occur.
Resolving the problem
Recopy the Storage Account Connection String from the Azure Portal. It displays similar to the following example:
DefaultEndpointsProtocol=https;AccountName=<Storage Account
Name>;AccountKey=<Storage Account Key>;EndpointSuffix=core.windows.net
Invalid key exception
Symptoms
Error: “The Storage Account Key was invalid. Unable to connect to the host.”
Error: “An invalid key was encountered. This error is commonly associated with passwords or authorization keys. For more information see the "Raw Error Message". An attempt will be made to query for content at the next retry interval”.
Causes
The key that is formed from the storage account connection string is invalid. The storage account key is in the connection string. If the key is altered, it might become invalid.
Resolving the problem
From the Azure portal, recopy the storage account connection string. It displays similar to the following example:
DefaultEndpointsProtocol=https;AccountName=<Storage Account
Name>;AccountKey=<Storage Account Key>;EndpointSuffix=core.windows.net
Timeout exception
Symptoms
Error: “Ensure that there are no network related issues preventing the connection. Additionally ensure that the Event Hub and Storage Account Connection Strings are valid.”
Error: “The server did not respond to the requested operation within the specified time, which is controlled by OperationTimeout. The server might have completed the requested operation. This exception can be caused by network or other infrastructure delays. An attempt will be made to query for content at the next retry interval.”
Causes
The most common cause is that the connection string information is invalid. The network might be blocking communication, resulting in a timeout. While rare, it is possible that the default timeout period (60 seconds) is not long enough due to network congestion.
Resolving the problem
Follow these steps to resolve your timeout exception error.
-
When you copy the event hub connection string from the Azure portal to JSA, ensure that no additional white space or invisible characters are added. Alternatively, before you copy the string, ensure that you don't copy any additional characters or white space.
-
Verify that the storage account connection string is valid and appears in a similar format to the following example:
DefaultEndpointsProtocol=https;AccountName=<Storage Account
Name>;AccountKey=<Storage Account Key>;EndpointSuffix=core.windows.net
-
Ensure that JSA can communicate with the storage account host on port 443, and with the event hub on ports 5671 and 5672.
-
Ensure that a certificate is downloaded manually or by using the Automatically Acquire Server Certificate(s) option. The certificates are downloaded from
<Storage Account Name>.blob.core.windows.net -
Advanced- There is a hidden parameter that can increase the default timeout from 60 seconds. Contact Juniper Customer Support for assistance in getting the timeout increased.
Other exceptions
Symptoms
Error: “Ensure that there are no network related issues preventing the connection. Additionally ensure that the Event Hub and Storage Account Connection Strings are valid.”
Error: “An error occurred. For more information, see the \"Raw Error Message\". An attempt will be made to query for content at the next retry interval”
Causes
Exceptions in this category are unknown to the protocol and are unexpected. These exceptions can be difficult to troubleshoot and usually require research to resolve.
Resolving the problem
Follow these steps to resolve your error. They might resolve some of the more common issues.
-
Ensure that the event hub connection string uses the same or a similar format as displayed in the following example:
Endpoint=sb://<Namespace
Name>.servicebus.windows.net/;SharedAccessKeyName=<SAS Key
Name>;SharedAccessKey=[SAS Key];EntityPath=ame>;SharedAccessKey=[SAS Key];EntityPath=<Event Hub Name>
-
When you move the event hub connection string from the Azure portal to JSA, ensure that no additional white space or invisible characters are added. Alternatively, before you copy the string, ensure that you don't copy any additional characters or white space.
-
Ensure that the storage account connection string is valid and displays in a similar format to the following example:
DefaultEndpointsProtocol=https;AccountName=<Storage Account
Name>;AccountKey=<Storage Account Key>;EndpointSuffix=core.windows.net
-
Ensure that JSA can communicate with the storage account host on port 443, and with the event hub on port 5671 and 5672.
-
Verify that a certificate is downloaded manually or by using the Automatically Acquire Server Certificate(s) option. The certificates are downloaded from
<Storage Account Name>.blob.core.windows.net. -
Verify that the system time in JSA matches the current time. Security settings on the storage account prevent mismatched times between the server (storage account) and the client (JSA).
Microsoft Azure Event Hubs protocol FAQ
Use these frequently asked questions and answers to help you understand the Microsoft Azure Event Hubs protocol.
Why do I need a storage account to connect to an event hub?
You must have a storage account for the Microsoft Azure Event Hubs protocol to manage the lease and partitions of an event hub.
Why does the Microsoft Azure Event Hubs protocol use the storage account?
The Microsoft Azure Event Hubs protocol uses the storage account to track partition ownership. This protocol creates blob files in the Azure storage account in the <Event Hub Name> → <Consumer group Name> directory. Each blob file relates to a numbered partition that is managed by the event hub.
How much data does the storage account need to store?
The amount of data that needs to be stored in a storage account is the number of partitions that are multiplied by ~150 bytes.
Does my storage account need to contain events?
No. Storing the logs in storage is an option that is provided by Microsoft. However, this option is not used by the protocol.
What does a blob file that is created by the Microsoft Azure Event Hubs protocol look like?
The following example shows what is stored in a blob file that is created by the protocol:
{"offset":"@latest","sequenceNumber":0,"partitionId":"3","epoch":8,"owner":"","token":""}”
Can I use the same storage account with other event hubs?
There are no restrictions on how many event hubs can store data in a storage account. You can use the same storage account for all log sources in the same JSA environment. This creates a single location for all event hub partition management folders and files.
What do I do if the protocol isn't collecting events?
If the protocol appears to be working and the protocol testing tools pass all of the tests, and you don't see events, follow these steps to confirm whether events are posted.
-
Confirm that there are events for the event hub to collect. If the Azure side configuration is not correct, the event hub might not collect the events.
-
If the Use as a Gateway Log Source is enabled, do a payload search for events that the Event Hub log source collects. If you are not sure what the events should look like, then go to step 4.
-
If the Use as a Gateway Log Source option is enabled, and the protocol is not collecting events, test the same log source with the gateway disabled. By setting the Use as a Gateway Log Source to disabled, all collected events are forced to use the log source that is connected to the protocol. If events are arriving when the Use as a Gateway Log Source is disabled, but events are not arriving when Use as a Gateway Log Source is enabled, there might be an issue with the log source identifier options or the Traffic Analysis can't automatically match the events to a DSM.
-
If you identified in Step 2 or Step 3 that the events are not coming in under the expected log source, there might be an issue with the event hub log sources
logsourceidentifierpattern. For issues related to the event hub log source identifier pattern, you might need to contact Juniper Customer Support.
Why do I need to open the ports for two different IPs that have different ports?
You need two different IPs to have different ports open because the Microsoft Azure Event Hub protocol communicates between the event hub host and the storage account host.
The event hub connection uses the Advanced Message Queuing Protocol (AMQP) with ports 5671 and 5672. The storage account uses HTTPS with ports 443. Because the storage account and the event hub have different IPs, you must open two different ports.
Can I collect <Service/Product> events by using the Microsoft Event Hubs protocol?
The Microsoft Event Hubs protocol collects all events that are sent to the event hub, but not all events are parsed by a supported DSM. For a list of supported DSMs, see JSA Supported DSMs.
What does the Format Azure Linux Events To Syslog option do?
This option takes the Azure Linux event, which is wrapped in a JSON format with metadata, and converts it to a standard syslog format. Unless there is a specific reason that the metadata on the payload is required, enable this option. When this option is disabled, the payloads do not parse with Linux DSMs.
Microsoft Defender for Endpoint SIEM REST API Protocol Configuration Options
Configure a Microsoft Defender for Endpoint SIEM REST API protocol to receive events from supported Device Support Modules (DSMs).
The Microsoft Defender for Endpoint SIEM REST API protocol is an outbound/active protocol.
Due to a change in the Microsoft Defender API suite as of 25 November 2021, Microsoft no longer allows the onboarding of new integrations with their SIEM API. Existing integrations continue to function. The Streaming API can be used with the Microsoft Azure Event Hubs protocol to provide event and alert forwarding to JSA.
For more information about the service and its configuration, see Configure Microsoft 365 Defender to stream Advanced Hunting events to your Azure Event Hub.
The following table describes the protocol-specific parameters for the Microsoft Defender for Endpoint SIEM REST API protocol:
|
Parameter |
Value |
|---|---|
|
Log Source type |
Microsoft 365 Defender |
|
Protocol Configuration |
Microsoft Defender for Endpoint SIEM REST API |
|
Authorization Server URL |
The URL for the server that provides the authorization to obtain an access token. The access token is used as the authorization to collect events from Microsoft 365 Defender. The Authorization Server URL uses the following format: "https://login.microsoftonline.com/<Tenant_ID>/oauth2/token”
where <Tenant_ID> is a UUID. |
|
Resource |
The resource that is used to access Microsoft 365 Defender SIEM API events. |
|
Client ID |
Ensures that the user is authorized to obtain an access token. |
|
Client Secret |
The Client Secret value is displayed only one time, and then is no longer visible. If you don't have access to the Client Secret value, contact your Microsoft Azure administrator to request a new client secret. |
|
Region |
Select the regions that are associated with Microsoft 365 Defender SIEM API that you want to collect logs from. |
|
Other Region |
Type the names of any additional regions that are associated with the Microsoft 365 Defender SIEM API that you want to collect logs from. Use a comma-separated list; for example, region1,region2. |
|
Use GCC Endpoints |
Enable or disable the use of GCC and GCC High & DOD endpoints. GCC and GCC High & DOD endpoints are endpoints for US Government customers. Tip:
When this parameter is enabled, you cannot configure the Regions parameter. For more information, see Microsoft Defender for Endpoint for US Government customers. |
|
GCC Type |
Select GCC or GCC High & DOD.
|
|
Use Proxy |
If a proxy for JSA is configured, all traffic for the log source travels through the proxy so that JSA can access the Microsoft 365 Defender SIEM API. Configure the Proxy Server, Proxy Port, Proxy Username, and Proxy Password fields. If the proxy does not require authentication, configure the Proxy Server and Proxy Port fields. |
|
Recurrence |
You can specify how often the log collects data. The format is M/H/D for Minutes/Hours/Days. The default is 5 M. |
|
EPS Throttle |
The upper limit for the maximum number of events per second (EPS). The default is 5000. |
If you need to create virtual machines (VMs) and test the connection between Microsoft Defender for Endpoint and JSA, see Microsoft Defender for Endpoint evaluation lab.
Microsoft DHCP Protocol Configuration Options
To receive events from Microsoft DHCP servers, configure a log source to use the Microsoft DHCP protocol.
The Microsoft DHCP protocol is an outbound/active protocol.
To read the log files, folder paths that contain an administrative share (C$), require NetBIOS privileges on the administrative share (C$). Local or domain administrators have sufficient privileges to access log files on administrative shares.
Fields for the Microsoft DHCP protocol that support file paths allow administrators to define a drive letter with the path information. For example, the field can contain the c$/LogFiles/ directory for an administrative share, or the LogFiles/ directory for a public share folder path, but cannot contain the c:/LogFiles directory.
The Microsoft authentication protocol NTLMv2 is not supported by the Microsoft DHCP protocol.
The following table describes the protocol-specific parameters for the Microsoft DHCP protocol:
|
Parameter |
Description |
|---|---|
|
Protocol Configuration |
Microsoft DHCP |
|
Log Source Identifier |
Type a unique hostname or other identifier unique to the log source. |
|
Server Address |
The IP address or host name of your Microsoft DHCP server. |
|
Domain |
Type the domain for your Microsoft DHCP server. This parameter is optional if your server is not in a domain. |
|
Username |
Type the user name that is required to access the DHCP server. |
|
Password |
Type the password that is required to access the DHCP server. |
|
Confirm Password |
Type the password that is required to access the server. |
|
Folder Path |
The directory path to the DHCP log files. The default is /WINDOWS/system32/dhcp/ |
|
File Pattern |
The regular expression (regex) that identifies event logs. The log files must contain a three-character abbreviation for a day of the week. Use one of the following file patterns: English:
Polish:
|
|
Recursive |
Select this option if you want the file pattern to search the sub folders. |
|
SMB Version |
The version of SMB to use: AUTO - Auto-detects to the highest version that the client and server agree to use.
SMB1 - Forces the use of SMB1. SMB1 uses the
Note:
SMB1 is no longer supported. All administrators must update existing configurations to use SMB2 or SMB3.
SMB2 - Forces the use of SMB2. SMB2 uses the
SMB3 - Forces the use of SMB3. SMB3 uses the
Note:
Before you create a log source with a specific SMB version (for example: SMBv1, SMBv2, and SMBv3), ensure that the specified SMB version is supported by the Windows OS that is running on your server. You also need to verify that SMB versions is enabled on the specified Windows Server. |
|
Polling Interval (in seconds) |
The number of seconds between queries to the log files to check for new data. The minimum polling interval is 10 seconds. The maximum polling interval is 3,600 seconds. |
|
Throttle events/sec |
The maximum number of events the DHCP protocol can forward per second. The minimum value is 100 EPS. The maximum value is 20,000 EPS. |
|
File Encoding |
The character encoding that is used by the events in your log file. |
|
Enabled |
When this option is not enabled, the log source does not collect events and the log source is not counted in the license limit. |
|
Credibility |
Credibility is a representation of the integrity or validity of events that are created by a log source. The credibility value that is assigned to a log source can increase or decrease based on incoming events or adjusted as a response to user-created event rules. The credibility of events from log sources contributes to the calculation of the offense magnitude and can increase or decrease the magnitude value of an offense. |
|
Target Event Collector |
Specifies the JSA Event Collector that polls the remote log source. Use this parameter in a distributed deployment to improve Console system performance by moving the polling task to an Event Collector. |
|
Coalescing Events |
Increases the event count when the same event occurs multiple times within a short time interval. Coalesced events provide a way to view and determine the frequency with which a single event type occurs on the Log Activity tab. When this check box is clear, events are viewed individually and events are not bundled. New and automatically discovered log sources inherit the value of this check box from the System Settings configuration on the Admin tab. You can use this check box to override the default behavior of the system settings for an individual log source. |
Microsoft Exchange Protocol Configuration Options
To receive events from SMTP, OWA, and message tracking events from Microsoft Exchange 2007, 2010, 2013 and 2017 servers, configure a log source to use the Microsoft Exchange protocol.
The Microsoft Exchange protocol is an outbound/active protocol
To read the log files, folder paths that contain an administrative share (C$), require NetBIOS privileges on the administrative share (C$). Local or domain administrators have sufficient privileges to access log files on administrative shares.
Fields for the Microsoft Exchange protocol that support file paths allow administrators to define a drive letter with the path information. For example, the field can contain the c$/LogFiles/ directory for an administrative share, or the LogFiles/ directory for a public share folder path, but cannot contain the c:/LogFiles directory.
The Microsoft Exchange protocol does not support Microsoft Exchange 2003 or Microsoft authentication protocol NTLMv2 Session.
The following table describes the protocol-specific parameters for the Microsoft Exchange protocol:
|
Parameter |
Description |
|---|---|
|
Protocol Configuration |
Microsoft Exchange |
|
Log Source Identifier |
Type the IP address, host name, or name to identify your log source. |
|
Server Address |
The IP address or host name of your Microsoft Exchange server. |
|
Domain |
Type the domain for your Microsoft Exchange server. This parameter is optional if your server is not in a domain. |
|
Username |
Type the user name that is required to access your Microsoft Exchange server. |
|
Password |
Type the password that is required to access your Microsoft Exchange server. |
|
Confirm Password |
Type the password that is required to access your Microsoft Exchange server. |
|
SMTP Log Folder Path |
The directory path to access the SMTP log files. The default file path is Program Files/Microsoft/Exchange Server/ TransportRoles/Logs/ProtocolLog When the folder path is clear, SMTP event collection is disabled. |
|
OWA Log Folder Path |
The directory path to access OWA log files. The default file path is Windows/system32/LogFiles/W3SVC1 When the folder path is clear, OWA event collection is disabled. |
|
MSGTRK Log Folder Path |
The directory path to access message tracking logs. The default file path is Program Files/Microsoft/Exchange Server/ TransportRoles/Logs/MessageTracking Message tracking is available on Microsoft Exchange 2017 or 2010 servers that are assigned the Hub Transport, Mailbox, or Edge Transport server role. |
|
Use Custom File Patterns |
Select this check box to configure custom file patterns. Leave the check box clear to use the default file patterns. |
|
MSGTRK File Pattern |
The regular expression (regex) that is used to identify and download the MSTRK logs. All files that match the file pattern are processed. The default file pattern is MSGTRK\d+-\d+\.(?:log|LOG)$ All files that match the file pattern are processed. |
|
MSGTRKMD File Pattern |
The regular expression (regex) that is used to identify and download the MSGTRKMD logs. All files that match the file pattern are processed. The default file pattern is MSGTRKMD\d+-\d+\.(?:log|LOG)$ All files that match the file pattern are processed. |
|
MSGTRKMS File Pattern |
The regular expression (regex) that is used to identify and download the MSGTRKMS logs. All files that match the file pattern are processed. The default file pattern is MSGTRKMS\d+-\d+\.(?:log|LOG)$ All files that match the file pattern are processed. |
|
MSGTRKMA File Pattern |
The regular expression (regex) that is used to identify and download the MSGTRKMA logs. All files that match the file pattern are processed. The default file pattern is MSGTRKMA\d+-\d+\.(?:log| All files that match the file pattern are processed. |
|
SMTP File Pattern |
The regular expression (regex) that is used to identify and download the SMTP logs. All files that match the file pattern are processed. The default file pattern is .*\.(?:log|LOG)$ All files that match the file pattern are processed. |
|
OWA File Pattern |
The regular expression (regex) that is used to identify and download the OWA logs. All files that match the file pattern are processed. The default file pattern is .*\.(?:log|LOG)$ All files that match the file pattern are processed. |
|
Force File Read |
If the check box is cleared, the log file is read only when JSA detects a change in the modified time or file size. |
|
Recursive |
If you want the file pattern to search sub folders, use this option. By default, the check box is selected. |
|
SMB Version |
Select the version of SMB that you want to use. AUTO - Auto-detects to the highest version that the client and server agree to use.
SMB1 - Forces the use of SMB1. SMB1 uses the
Note:
SMB1 is no longer supported. All administrators must update existing configurations to use SMB2 or SMB3.
SMB2 - Forces the use of SMB2. SMB2 uses the
SMB3 – Forces the use of SMB3. SMB3 uses the
Note:
Before you create a log source with a specific SMB version (for example: SMBv1, SMBv2, and SMBv3), ensure that the specified SMB version is supported by the Windows OS that is running on your server. You also need to verify that SMB versions is enabled on the specified Windows Server. |
|
Polling Interval (in seconds) |
Type the polling interval, which is the number of seconds between queries to the log files to check for new data. The default is 10 seconds. |
|
Throttle Events/Second |
The maximum number of events the Microsoft Exchange protocol can forward per second. |
|
File Encoding |
The character encoding that is used by the events in your log file. |
Microsoft Graph Security API Protocol Configuration Options
To receive events from the Microsoft Graph Security API, configure a log source in JSA to use the Microsoft Graph Security API protocol.
The Microsoft Graph Security API protocol is an outbound/active protocol. Your DSM might also use this protocol. For a list of supported DSMs, see JSA Supported DSMs.
The following parameters require specific values to collect events from Microsoft Graph Security servers:
|
Parameter |
Value |
|---|---|
|
Log Source Type |
A custom log source type or a specific DSM that uses this protocol. |
|
Protocol Configuration |
Microsoft Graph Security API |
|
Tenant ID |
The Tenant ID value that is used for Microsoft Azure Active Directory authentication. |
|
Client ID |
The Client ID parameter value from your application configuration of Microsoft Azure Active Directory. |
|
Client Secret |
The Client Secret parameter value from your application configuration of Microsoft Azure Active Directory. |
|
Event Filter |
Retrieve events by using the Microsoft Security Graph API query filter. For example, severity eq 'high'. Do not type "filter=" before the filter parameter. |
|
Use Proxy |
If JSA accesses the Microsoft Graph Security API by proxy, enable this checkbox. If the proxy requires authentication, configure the Proxy Hostname or IP, Proxy Port, Proxy Username, and Proxy fields. If the proxy does not require authentication, configure the Proxy Hostname or IP and Proxy Port fields. |
|
Proxy IP or Hostname |
The IP address or hostname of the proxy server. If Use Proxy is set to False, this option is hidden. |
|
Proxy Port |
The port number that is used to communicate with the proxy. The default is 8080. If Use Proxy is set to False, this option is hidden. |
|
Proxy Username |
The username that is used to communicate with the proxy. If Use Proxy is set to False, this option is hidden. |
|
Proxy Password |
The password that is used to access the proxy. If Use Proxy is set to False, this option is hidden. |
|
Recurrence |
Type a time interval beginning at the Start Time to determine how frequently the poll scans for new data. The time interval can include values in hours (H), minutes (M), or days (D). For example, 2H - 2 hours, 15M - 15 minutes. The default is 1M. |
|
EPS Throttle |
The maximum number of events per second (EPS). The default is 5000. |
|
Show Advanced Options |
To configure the advanced options for event collection, set this option to on. Note:
The advanced option values are in effect even if you do not alter the values. |
|
Login Endpoint |
Specify the Azure AD Login Endpoint. The default value is login.microsoftonline.com. If you disable Show Advanced Options, this option is hidden. |
|
Graph API Endpoint |
Specify the Microsoft Graph Security API URL. The default value is https://graph.microsoft.com. If you disable Show Advanced Options, this option is hidden. |
Configuring Microsoft Graph Security API to Communicate with JSA
Integrate the Microsoft Graph Security API with JSA before you use the protocol.
To integrate the Microsoft Graph Security API with JSA, you need Microsoft Azure Active Directory.
-
If automatic updates are not enabled, RPMs are available for download from the Juniper Downloads. Download and install the most recent version of the following RPMs on your JSA Console.
-
Protocol Common RPM
-
Microsoft Graph Security API Protocol RPM
-
-
Configure your Microsoft Graph Security API server to forward events to JSA by following these instructions:
-
Authorization and the Microsoft Graph Security API
You must include the following app roles in the Access Token:
-
SecurityEvents.Read.All -
User.Read.All -
SecurityActions.Read.All -
IdentityRiskyUser.Read.All -
IdentityRiskEvent.Read.All
Note:You must designate the app roles with Application permissions. If your environment does not accept Application permissions, you can use Delegated permissions.
-
-
Add a Microsoft Security Graph API protocol log source on the JSA Console by using a custom log source type or a specific DSM that uses this protocol.
For more information about supported DSMs, see JSA Supported DSMs. For more information about adding a log source in JSA, see Adding a log source.
Microsoft IIS Protocol Configuration Options
You can configure a log source to use the Microsoft IIS protocol. This protocol supports a single point of collection for W3C format log files that are located on a Microsoft IIS web server.
The Microsoft IIS protocol is an outbound/active protocol.
To read the log files, folder paths that contain an administrative share (C$), require NetBIOS privileges on the administrative share (C$). Local or domain administrators have sufficient privileges to access log files on administrative shares.
Fields for the Microsoft IIS protocol that support file paths allow administrators to define a drive letter with the path information. For example, the field can contain the c$/LogFiles/ directory for an administrative share, or the LogFiles/ directory for a public share folder path, but cannot contain the c:/LogFiles directory.
The Microsoft authentication protocol NTLMv2 is not supported by the Microsoft IIS protocol.
The following table describes the protocol-specific parameters for the Microsoft IIS protocol:
|
Parameter |
Description |
|---|---|
|
Protocol Configuration |
Microsoft IIS |
|
Log Source Identifier |
Type the IP address, host name, or a unique name to identify your log source. |
|
Server Address |
The IP address or host name of your Microsoft IIS server. |
|
Domain |
Type the domain for your Microsoft IIS server. This parameter is optional if your server is not in a domain. |
|
Username |
Type the user name that is required to access your server. |
|
Password |
Type the password that is required to access your server. |
|
Confirm Password |
Type the password that is required to access the server. |
|
Log Folder Path |
The directory path to access the log files. For example, administrators can use the c$/LogFiles/ directory for an administrative share, or the LogFiles/ directory for a public share folder path. However, the c:/LogFiles directory is not a supported log folder path. If a log folder path contains an administrative share (C$), users with NetBIOS access on the administrative share (C$) have the privileges that are required to read the log files. Local system or domain administrator privileges are also sufficient to access a log files that are on an administrative share. |
|
File Pattern |
The regular expression (regex) that identifies the event logs. |
|
Recursive |
If you want the file pattern to search sub folders, use this option. By default, the check box is selected. |
|
SMB Version |
Select the version of SMB that you want to use. AUTO - Auto-detects to the highest version that the client and server agree to use.
SMB1 - Forces the use of SMB1. SMB1 uses the
Note:
SMB1 is no longer supported. All administrators must update existing configurations to use SMB2 or SMB3.
SMB2 - Forces the use of SMB2. SMB2 uses the
SMB3 - Forces the use of SMB3. SMB3 uses the
Note:
Before you create a log source with a specific SMB version (for example: SMBv1, SMBv2, and SMBv3), ensure that the specified SMB version is supported by the Windows OS that is running on your server. You also need to verify that SMB versions is enabled on the specified Windows Server. |
|
Polling Interval (In seconds) |
Type the polling interval, which is the number of seconds between queries to the log files to check for new data. The default is 10 seconds. |
|
Throttle Events/Second |
The maximum number of events the IIS protocol can forward per second. |
|
File Encoding |
The character encoding that is used by the events in your log file. |
If you use Advanced IIS Logging, you need to create a new log definition. In the Log Definition window, ensure that the following fields are selected in the Selected Fields section:
-
Date-UTC
-
Time-UTC
-
URI-Stem
-
URI-Querystring
-
ContentPath
-
Status
-
Server Name
-
Referer
-
Win325Status
-
Bytes Sent
Microsoft Security Event Log Protocol Configuration Options
You can configure a log source to use the Microsoft Security Event Log protocol. You can use MicrosoftWindows Management Instrumentation (WMI) to collect customized event logs or agent less Windows Event Logs.
The WMI API requires that firewall configurations accept incoming external communications on port 135 and on any dynamic ports that are required for DCOM. The following list describes the log source limitations that you use the Microsoft Security Event Log Protocol:
-
Systems that exceed 50 events per second (eps) might exceed the capabilities of this protocol. Use WinCollect for systems that exceed 50 eps.
-
A JSA all-in-one installation can support up to 250 log sources with the Microsoft Security Event Log protocol.
-
Dedicated JSA Event Collectors can support up to 500 log sources by using the Microsoft Security Event Log protocol.
The Microsoft Security Event Log protocol is an outbound/active protocol. This protocol is not suggested for remote servers that are accessed over network links, for example, systems that have high round-trip delay times, such as satellite or slow WAN networks. You can confirm round-trip delays by examining requests and response time that is between a server ping. Network delays that are created by slow connections decrease the EPS throughput available to those remote servers. Also, event collection from busy servers or domain controllers rely on low round-trip delay times to keep up with incoming events. If you cannot decrease your network round-trip delay time, you can use WinCollect to process Windows events.
The Microsoft Security Event Log supports the following software versions with the MicrosoftWindows Management Instrumentation (WMI) API:
-
Microsoft Windows 2000
-
Microsoft Windows Server 2003
-
Microsoft Windows Server 2008
-
Microsoft Windows Server 2008R3
-
Microsoft Windows XP
-
Microsoft Windows Vista
-
Microsoft Windows 7
The following table describes the protocol-specific parameters for the Microsoft Security Event Log protocol:
|
Parameter |
Description |
|---|---|
|
Protocol Configuration |
Windows Security Event Log |
Microsoft Security Event Log Over MSRPC Protocol
The Microsoft Security Event Log over MSRPC protocol (MSRPC) is an outbound/active protocol that collects Windows events without installing an agent on the Windows host.
The MSRPC protocol uses the Microsoft Distributed Computing Environment/Remote Procedure Call (DCE/RPC) specification to provide agentless, encrypted event collection. The MSRPC protocol provides higher event rates than the default MicrosoftWindows Security Event Log protocol, which uses WMI/DCOM for event collection.
The following table lists the supported features of the MSRPC protocol.
|
Features |
Microsoft Security Event Log over MSRPC protocol |
|---|---|
|
Manufacturer |
Microsoft |
|
Connection test tool |
The MSRPC test tool checks the connectivity between the JSA appliance and a Windows host. The MSRPC test tool is part of the MSRPC protocol RPM and can be found in /opt/qradar/jars after you install the protocol. |
|
Protocol type |
The operating system dependent type of the remote procedure protocol for collection of events. Select one of the following options from the Protocol Type list:
|
|
Maximum EPS rate |
100 EPS / Windows host |
|
Maximum overall EPS rate of MSRPC |
8500 EPS / JSA 16xx or 18xx appliance |
|
Maximum number of supported log sources |
500 log sources / JSA 16xx or 18xx appliance |
|
Bulk log source support |
Yes |
|
Encryption |
Yes |
|
Supported event types |
Application System Security DNS Server File Replication Directory Service logs |
|
Supported Windows Operating Systems |
Windows Server 2022 (including Core) Windows Server 2019 (Including Core) Windows Server 2016 (Including Core) Windows Server 2012 (Including Core) Windows 10 |
|
Required permissions |
The log source user must be a member of the Event Log Readers group. If this group is not configured, then domain admin privileges are required in most cases to poll a Windows event log across a domain. In some cases, the backup operators group can be used depending on how Microsoft Group Policy Objects are configured.
|
|
Required RPM files |
PROTOCOL-WindowsEventRPC- JSA_release-Build_number.noarch.rpm DSM-MicrosoftWindows-JSA_release-Build_number.noarch.rpm DSM-DSMCommon-JSA_release-Build_number.noarch.rpm |
|
Windows service requirements |
|
|
Windows port requirements |
|
|
Special features |
Supports encrypted events by default. |
|
Automatically discovered? |
No |
|
Includes identity? |
Yes |
|
Includes custom properties? |
A security content pack with Windows custom event properties is available on https://support.juniper.net/support/downloads/. |
|
Intended application |
Agentless event collection for Windows operating systems that can support 100 EPS per log source. |
|
Tuning support |
MSRPC is limited to 100 EPS / Windows host. For higher event rate systems, see the Juniper Secure Analytics WinCollect User Guide. |
|
Event filtering support |
MSRPC does not support event filtering. See the Juniper Secure Analytics WinCollect User Guide for this feature. |
|
More information |
Microsoft support (http://support.microsoft.com/) |
In contrast to WMI/DCOM, the MSRPC protocol provides twice the EPS. The event rates are shown in the following table.
|
Name |
Protocol type |
Maximum event rate |
|---|---|---|
|
Microsoft Security Event Log |
WMI/DCOM |
50EPS / Windows host |
|
Microsoft Security Event Log over MSRPC |
MSRPC |
100EPS / Windows host |
MQ Protocol Configuration Options
To receive messages from a message queue (MQ) service, configure a log source to use the MQ protocol. The protocol name displays in JSA as MQ JMS.
MQ is supported.
The MQ protocol is an outbound/active protocol that can monitor multiple message queues, up to a maximum of 50 per log source.
The following table describes the protocol-specific parameters for the MQ protocol:
|
Parameter |
Description |
|---|---|
|
Protocol Name |
MQ JMS |
|
IP or Hostname |
The IP address or host name of the primary queue manager. |
|
Port |
The default port that is used for communicating with the primary queue manager is 1414. |
|
Standby IP or Hostname |
The IP address or host name of the standby queue manager. |
|
Standby Port |
The port that is used to communicate with the standby queue manager. |
|
Queue Manager |
The name of the queue manager. |
|
Channel |
The channel through which the queue manager sends messages. The default channel is SYSTEM.DEF.SVRCONN. |
|
Queue |
The queue or list of queues to monitor. A list of queues is specified with a comma-separated list. |
|
Username |
The user name that is used for authenticating with the MQ service. |
|
Password |
Optional: The password that is used to authenticate with the MQ service. |
|
Incoming Message Encoding |
The character encoding that is used by incoming messages. |
|
Process Computational Fields |
Optional: Select this option only if the retrieved messages contain computational data that is defined in a COBOL copybook. The binary data in the messages is processed according to the field definition found in the specified copybook file. |
|
CopyBook File Name |
This parameter displays when Process Computational Fields is selected. The name of the copybook file to use for processing data. The copybook file must be placed in /store/ec/mqjms/* |
|
Event Formatter |
Select the event formatting to be applied for any events that are generated from processing data containing computational fields. By default, No Formatting is used. |
|
Include JMS Message Header |
Select this option to include a header in each generated event containing JMS
message fields such as the |
|
EPS Throttle |
The limit for the maximum number of events per second (EPS). |
Office 365 Message Trace REST API Protocol Configuration Options
The Office 365 Message Trace REST API protocol for JSA collects message trace logs from the Message Trace REST API. This protocol is used to collect Office 365 email logs. The Office 365 Message Trace REST API protocol is an outbound/active protocol.
The following parameters require specific values to collect events from the Office 365 Message Trace:
|
Parameter |
Description |
|---|---|
|
Log Source Identifier |
A unique name for the log source. The name can't include spaces and must be unique among all log sources of this type that are configured with the Office 365 Message Trace REST API protocol. |
|
Office 365 User Account email |
To authenticate with the Office 365 Message Trace REST API, provide an Office 365 e-mail account with proper permissions. |
|
Office 365 User Account Password |
To authenticate with the Office 365 Message Trace REST API, provide the password that is associated with the Office 365 user account email. |
|
Event Delay |
The delay, in seconds, for collecting data. Office 365 Message Trace logs work on an eventual delivery system. To ensure that no data is missed, logs are collected on a delay. The default delay is 900 seconds (15 minutes), and can be set as low as 0 seconds. |
|
Use Proxy |
If the server is accessed by using a proxy, select the Use Proxy checkbox. If the proxy requires authentication, configure the Proxy Server, Proxy Port, Proxy Username, and Proxy Password fields. If the proxy does not require authentication, configure the Proxy Server and Proxy Port fields. |
|
Proxy IP or Hostname |
The IP address or hostname of the proxy server. |
|
Proxy Port |
The port number that is used to communicate with the proxy. The default is 8080. |
|
Proxy Username |
The username that is used to access the proxy server when the proxy requires authentication. |
|
Proxy Password |
The password that is used to access the proxy server when the proxy requires authentication. |
|
Recurrence |
The time interval between log source queries to the Office 365 Message Trace REST API for new events. The time interval can be in hours (H), minutes (M), or days (D). The default is 5 minutes. |
|
EPS Throttle |
The maximum number of events per second (EPS). The default is 5000. |
Conditional access for reading reports
If you receive the error message "Status Code: 401 | Status Reason:
Unauthorized," review the following Conditional Access policies documentation to
confirm that the user account has access to the legacy application Office 365 Message Trace
API:
-
For more information about blocking and unblocking legacy content in Conditional Access policies, see Conditional Access: Block legacy authentication.
-
For more information about creating Conditional Access policies for users and groups, see Conditional Access: Users and groups.
-
For more information about creating Conditional Access policies for Cloud apps or actions, see Conditional Access: Cloud apps or actions.
-
For more information about granting or blocking access to resources with a Conditional Access policy, see Conditional Access: Grant.
Troubleshooting the Office 365 Message Trace REST API Protocol
To resolve issues with the Office 365 Message Trace REST API protocol, use the troubleshooting and support information. Find the errors by using the protocol testing tools in the Juniper Secure Analytics Log Source Management app.
General troubleshooting
The following steps apply to all user input errors. The general troubleshooting procedure contains the first steps to follow any errors with the Office 365 Message Trace REST API protocol.
-
If you use JSA 7.3.2, software update 3 or later, run the testing tool before you enable the log source. If the testing tool doesn't pass all tests, the log source fails when enabled. If a test fails, an error message with more information displays.
-
Verify that the selected Event Collector can access the
reports.office365.com
                host.
This protocol connects by using HTTPS (port 443). -
Verify that the Office 365 email account username and password are valid.
-
Ensure that the Office 365 email account has the correct permissions. For more information, see Office 365 Message Trace REST API protocol FAQ.
-
Ensure that your access is not blocked to the Reporting Web Services legacy authentication protocol. For more information, see HTTP Status code 401.
-
Reenter all fields.
-
If available, rerun the testing tool.
For more information, see:
HTTP Status code 401
Symptoms
Error: "Status Code: 401 | Status Reason: Unauthorized"
Error: "Invalid Office 365 User Account E-mail or Password"
Error: <A response received from the Office 365 Message Trace REST API displays>
Causes
JSA connected to the Office 365 Message Trace protocol, but because of invalid user credentials, it couldn't authenticate.
Resolving the problem
To resolve your HTTP Status code 401 error, verify that the Office 365 e-mail account username and the account password are valid.
HTTP Status code 404
Symptoms
Error: “Status Code : 404 | Status Reason: Not Found"
Error: "Occasionally 404 responses are related to the user account permissions not granting access to the Message Trace API”
Error: <A response received from the Office 365 Message Trace REST API displays>
Causes
404 responses are usually due to the server not being found. However, the Office 365 Message Trace REST API can return this response when the User Account that was provided does not have proper permissions. Most instances of this exception occur because the User Account does not have the necessary permissions.
Resolving the problem
To resolve your HTTP Status code 404 error, ensure that the user accounts have the necessary permissions. For more information, see Office 365 Message Trace REST API protocol FAQ.
Office 365 Message Trace REST API protocol FAQ
Got a question? Check these frequently asked questions and answers to help you understand the Office 365 Message Trace REST API protocol.
What permissions are required to collect logs from the Office 365 Message Trace REST API?
Use the same administrative permissions that you use to access the reports in the Office 365 organization.
What information is contained in the events that are collected by a Microsoft Office 365 Message Trace REST API protocol?
This protocol returns the same information that is provided in the message trace in the Security and Compliance Center.
Extended and enhanced reports are not available when you use the Office 365 Message Trace REST API.
What is the event delay option used for?
The event delay option is used to prevent events from being missed. Missed events, in this context, occur because they become available after the protocol updated its query range to a newer time frame than the event’s arrival time. If an event occurred but wasn't posted to the Office 365 Message Trace REST API, then when the protocol queries for that event's creation time, the protocol doesn't get that event.
Example 1: The following example shows how an event can be lost.
The protocol queries the Office 365 Message Trace API at 2:00 PM to collect events between 1:00 PM – 1:59 PM. The Office 365 Message Trace API response returns the events that are available in the Office 365 Message Trace API between 1:00 PM - 1:59 PM. The protocol operates as if all of the events are collected and then sends the next query to the Office 365 Message Trace API at 3:00 PM to get events that occurred between 1:45 PM – 2:59 PM. The problem with this scenario is that the Office 365 Message Trace API might not include all of the events that occurred between 1:00 PM – 1:59 PM. If an event occurred at 1:58 PM, that event might not be available in the Office 365 Message Trace API until 2:03 PM. However, the protocol has already queried the 1:00 PM – 1:59 PM time range, and can't re-query that range without getting duplicated events. This delay can vary between 1 minute to 24 hours.
Example 2: The following example shows Example 1, except in this scenario a 15-minute delay is added.
This example uses a 15-minute delay when the protocol makes query calls. When the protocol makes a query call to the Office 365 Message Trace API at 2:00 PM, it collects the events that occurred between 1:00 - 1:45 PM. The protocol operates as if all of the events are collected, sends the next query to the Office 365 Message Trace API at 3:00 PM and collects all events that occurred between 1:45 PM – 2:45 PM. Instead of the event being missed, as in Example 1, it gets picked up in the next query call between 1:45 PM - 2:45 PM.
Example 3: The following example shows Example 2, except in this scenario the events are available a day later.
If the event occurred at 1:58 PM, but only became available to the Office 365 Message Trace API at 1:57 PM the next day, then the event delay that is described in Example 2 no longer gets that event. Instead, the event delay must be set to a higher value, in this case 24 hours.
How does the event delay option work?
Instead of querying from the last received event time to current time, the protocol queries from the last received event time to current time - <event delay>. The event delay is in seconds. For example, a delay of 15 minutes (900 seconds) means that it queries only up to 15 minutes ago. This query gives the Office 365 Message Trace API 15 minutes to make an event available before the event is lost. When the current time - <event delay> is less than the last received event time, the protocol doesn't query the Office 365 Message Trace API; it waits for the condition to pass before querying.
What value do I use for the event delay option?
The Office 365 Message Trace API can delay the event’s availability for up to 24 hours. To prevent any events from being missed, the Event Delay parameter option value can be set to 24 hours. However, the larger the event delay, the less real time the results are. With a 24-hour event delay, you see events only 24 hours after they occur. The value depends on how much risk you're willing to take and how important real-time data is. This default delay of 15 minutes provides a value that is set in real time and also prevents most events from being missed.
Okta REST API Protocol Configuration Options
To receive events from Okta, configure a log source in JSA by using the Okta REST API protocol.
The Okta REST API protocol is an outbound/active protocol that queries Okta events and users API endpoints to retrieve information about actions that are completed by users in an organization.
The following table describes the protocol-specific parameters for the Okta REST API protocol:
|
Parameter |
Description |
|---|---|
|
Log Source Identifier |
A unique name for the log source. The Log Source Identifier can be any valid value and does
not need to reference a specific server. The Log Source
Identifier can be the same value as the log source
Name. If you have more than one Okta log source that is
configured, you might want to identify the first log source as
|
|
IP or Hostname |
oktaprise.okta.com |
|
Authentication Token |
A single authentication token that is generated by the Okta console and must be used for all API transactions. |
|
Use Proxy |
If JSA accesses Okta by using a proxy, enable this option. When a proxy is configured, all traffic for the log source travels through the proxy for JSA to access Okta. If the proxy requires authentication, configure the Hostname, Proxy Port, Proxy Username, and Proxy Password fields. If the proxy does not require authentication, you can leave the Proxy Username and Proxy Password fields blank. |
|
Hostname |
If you select Use Proxy, this parameter is displayed. |
|
Proxy Port |
If you select Use Proxy, this parameter is displayed. |
|
Proxy Username |
If you select Use Proxy, this parameter is displayed. |
|
Proxy Password |
If you select Use Proxy, this parameter is displayed. |
|
Recurrence |
A time interval to determine how frequently the poll is made for new data. The time interval can include values in hours (H), minutes (M), or days (D). For example, 2H = 2 hours, 15M = 15 minutes, 30 = seconds. The default is 1M. |
|
EPS Throttle |
The maximum number of events per second that are sent to the flow pipeline. The default is 5000. Ensure that the EPS Throttle value is higher than the incoming rate or data processing might fall behind. |
OPSEC/LEA Protocol Configuration Options
To receive events on port 18184, configure a log source to use the OPSEC/LEA protocol.
The OPSEC/LEA protocol is an outbound/active protocol.
The following table describes the protocol-specific parameters for the OPSEC/LEA protocol:
|
Parameter |
Description |
|---|---|
|
Protocol Configuration |
OPSEC/LEA |
|
Log Source Identifier |
The IP address, host name, or any name to identify the device. Must be unique for the log source type. |
|
Server IP |
Type the IP address of the server. |
|
Server Port |
The port number that is used for OPSEC communication. The valid range is 0 - 65,536 and the default is 18184. |
|
Use Server IP for Log Source |
Select the Use Server IP for Log Source check box if you want to use the LEA server IP address instead of the managed device IP address for a log source. By default, the check box is selected. |
|
Statistics Report Interval |
The interval, in seconds, during which the number of syslog events are recorded in the qradar.log file. The valid range is 4 - 2,147,483,648 and the default interval is 600. |
|
Authentication Type |
From the list, select the Authentication Type that you want to use for this LEA configuration. The options are sslca (default), sslca_clear, or clear. This value must match the authentication method that is used by the server. |
|
OPSEC Application Object SIC Attribute (SIC Name) |
The Secure Internal Communications (SIC) name is the distinguished name (DN) of the application, for example: CN=LEA, o=fwconsole..7psasx. |
|
Log Source SIC Attribute (Entity SIC Name) |
The SIC name of the server, for example: cn=cp_mgmt,o=fwconsole..7psasxz. |
|
Specify Certificate |
Select this check box if you want to define a certificate for this LEA configuration. JSA attempts to retrieve the certificate by using these parameters when the certificate is needed. |
|
Certificate Filename |
This option appears only if Specify Certificate is selected. Type the file name of the certificate that you want to use for this configuration. The certificate file must be located in the /opt/qradar/conf/ trusted_certificates/lea directory. |
|
Certificate Authority IP |
Type the Check Point Manager Server IP address. |
|
Pull Certificate Password |
Type the password. |
|
OPSEC Application |
The name of the application that makes the certificate request. |
|
Enabled |
Select this check box to enable the log source. By default, the check box is selected. |
|
Credibility |
From the list, select the Credibility of the log source. The range is 0 - 10. The credibility indicates the integrity of an event or offense as determined by the credibility rating from the source devices. Credibility increases if multiple sources report the same event. The default is 5. |
|
Target Event Collector |
From the list, select the Target Event Collector to use as the target for the log source. |
|
Coalescing Events |
Select the Coalescing Events check box to enable the log source to coalesce (bundle) events. By default, automatically discovered log sources inherit the value of the Coalescing Events list from the System Settings in JSA. When you create a log source or edit an existing configuration, you can override the default value by configuring this option for each log source. |
|
Store Event Payload |
Select the Store Event Payload check box to enable the log source to store event payload information. By default, automatically discovered log sources inherit the value of the Store Event Payload list from the System Settings in JSA. When you create a log source or edit an existing configuration, you can override the default value by configuring this option for each log source. |
If you receive the error message Unable to pull SSL certificate after an upgrade, follow these steps:
-
Clear the Specify Certificate check box.
-
Reenter the password for Pull Certificate Password.
Oracle Database Listener Protocol Configuration Options
To remotely collect log files that are generated from an Oracle database server, configure a log source to use the Oracle Database Listener protocol source.
The Oracle Database Listener protocol is an outbound/active protocol.
Before you configure the Oracle Database Listener protocol to monitor log files for processing, you must obtain the directory path to the Oracle database log files.
The following table describes the protocol-specific parameters for the Oracle Database Listener protocol:
|
Parameter |
Description |
|---|---|
|
Protocol Configuration |
Oracle Database Listener |
|
Log Source Identifier |
Type the IP address, host name, or a unique name to identify your log source. |
|
Server Address |
The IP address or host name of your Oracle Database Listener server. |
|
Domain |
Type the domain for your Oracle Database Learner server. This parameter is optional if your server is not in a domain. |
|
Username |
Type the user name that is required to access your server. |
|
Password |
Type the password that is required to access your server. |
|
Confirm Password |
Type the password that is required to access the server. |
|
Log Folder Path |
Type the directory path to access the Oracle Database Listener log files. |
|
File Pattern |
The regular expression (regex) that identifies the event logs. |
|
Force File Read |
Select this check box to force the protocol to read the log file when the timing of the polling interval specifies. When the check box is selected, the log file source is always examined when the polling interval specifies, regardless of the last modified time or file size attribute. When the check box is not selected, the log file source is examined at the polling interval if the last modified time or file size attributes changed. |
|
Recursive |
If you want the file pattern to search sub folders, use this option. By default, the check box is selected. |
|
SMB Version |
Select the version of SMB that you want to use: AUTO - Auto-detects to the highest version that the client and server agree to use.
SMB1 - Forces the use of SMB1. SMB1 uses the
Note:
SMB1 is no longer supported. All administrators must update existing configurations to use SMB2 or SMB3.
SMB2 - Forces the use of SMB2. SMB2 uses the
SMB3 - Forces the use of SMB3. SMB3 uses the
Note:
Before you create a log source with a specific SMB version (for example: SMBv1, SMBv2, and SMBv3), ensure that the specified SMB version is supported by the Windows OS that is running on your server. You also need to verify that SMB versions is enabled on the specified Windows Server. |
|
Polling Interval (in seconds) |
Type the polling interval, which is the number of seconds between queries to the log files to check for new data. The default is 10 seconds. |
|
Throttle events/sec |
The maximum number of events the Oracle Database Listener protocol forwards per second. |
|
File Encoding |
The character encoding that is used by the events in your log file. |
SDEE Protocol Configuration Options
You can configure a log source to use the Security Device Event Exchange (SDEE) protocol. JSA uses the protocol to collect events from appliances that use SDEE servers.
The SDEE protocol is an outbound/active protocol.
The following table describes the protocol-specific parameters for the SDEE protocol:
|
Parameter |
Description |
|---|---|
|
Protocol Configuration |
SDEE |
|
URL |
The HTTP or HTTPS URL that is required to access the log source, for example, https://www.mysdeeserver.com/cgi-bin/sdee-server. For SDEE/CIDEE (Cisco IDS v5.x and later), the URL must end with /cgi-bin/sdee-server. Administrators with RDEP (Cisco IDS v4.x), the URL must end with /cgi-bin/event-server. |
|
Force Subscription |
When the check box is selected, the protocol forces the server to drop the least active connection and accept a new SDEE subscription connection for the log source. |
|
Maximum Wait To Block For Events |
When a collection request is made and no new events are available, the protocol enables an event block. The block prevents another event request from being made to a remote device that did not have any new events. This timeout is intended to conserve system resources. |
SMB Tail Protocol Configuration Options
You can configure a log source to use the SMB Tail protocol. Use this protocol to watch events on a remote Samba share and receive events from the Samba share when new lines are added to the event log.
The SMB Tail protocol is an outbound/active protocol.
The following table describes the protocol-specific parameters for the SMB Tail protocol:
|
Parameter |
Description |
|---|---|
|
Protocol Configuration |
SMB Tail |
|
Log Source Identifier |
Type the IP address, hostname, or a unique name to identify your log source. |
|
Server Address |
The IP address or hostname of your SMB Tail server. |
|
Domain |
Type the domain for your SMB Tail server. This parameter is optional if your server is not in a domain. |
|
Username |
Type the username that is required to access your server. |
|
Password |
Type the password that is required to access your server. |
|
Confirm Password |
Confirm the password that is required to access the server. |
|
Log Folder Path |
The directory path to access the log files. For example, administrators can use the c$/LogFiles/ directory for an administrative share, or the LogFiles/ directory for a public share folder path. However, the c:/LogFiles directory is not a supported log folder path. If a log folder path contains an administrative share (C$), users with NetBIOS access on the administrative share (C$) have the privileges that are required to read the log files. Local system or domain administrator privileges are also sufficient to access a log files that are on an administrative share. |
|
File Pattern |
The regular expression (regex) that identifies the event logs. |
|
SMB Version |
Select the version of Server Message Block (SMB) that you want to use. AUTO - Auto-detects to the highest version that the client and server agree to use.
SMB1 - Forces the use of SMB1. SMB1 uses the
Note:
SMB1 is no longer supported. All administrators must update existing configurations to use SMB2 or SMB3.
SMB2 - Forces the use of SMB2. SMB2 uses the
SMB3 - Forces the use of SMB3. SMB3 uses the
Note:
Before you create a log source with a specific SMB version (for example: SMBv1, SMBv2, and SMBv3), ensure that the specified SMB version is supported by the Windows OS that is running on your server. You also need to verify that SMB versions are enabled on the specified Windows Server. |
|
Force File Read |
If the checkbox is cleared, the log file is read only when JSA detects a change in the modified time or file size. |
|
Recursive |
If you want the file pattern to search sub folders, use this option. By default, the checkbox is selected. |
|
Polling Interval (In seconds) |
Type the polling interval, which is the number of seconds between queries to the log files to check for new data. The default is 10 seconds. |
|
Throttle Events/Second |
The maximum number of events the SMB Tail protocol forwards per second. |
|
File Encoding |
The character encoding that is used by the events in your log file. |
SNMPv2 Protocol Configuration Options
You can configure a log source to use the SNMPv2 protocol to receive SNMPv2 events.
The SNMPv2 protocol is an inbound/passive protocol.
The following table describes the protocol-specific parameters for the SNMPv2 protocol:
|
Parameter |
Description |
|---|---|
|
Protocol Configuration |
SNMPv2 |
|
Community |
The SNMP community name that is required to access the system that contains SNMP events. For example, Public. |
|
Include OIDs in Event Payload |
Specifies that the SNMP event payload is constructed by using name-value pairs instead of the event payload format. When you select specific log sources from the Log Source Types list, OIDs in the event payload are required for processing SNMPv2 or SNMPv3 events. |
|
Coalescing Events |
Select this check box to enable the log source to coalesce (bundle) events. Coalescing events increase the event count when the same event occurs multiple times within a short time interval. Coalesced events provide administrators a way to view and determine the frequency with which a single event type occurs on the Log Activity tab. When this check box is clear, the events are displayed individually and the information is not bundled. New and automatically discovered log sources inherit the value of this check box from the System Settings configuration on the Admin tab. Administrators can use this check box to override the default behavior of the system settings for an individual log source. |
|
Store Event Payload |
Select this check box to enable the log source to store the payload information from an event. New and automatically discovered log sources inherit the value of this check box from the System Settings configuration on the Admin tab. Administrators can use this check box to override the default behavior of the system settings for an individual log source. |
SNMPv3 Protocol Configuration Options
You can configure a log source to use the SNMPv3 protocol to receive SNMPv3 events.
The SNMPv3 protocol is an inbound/passive protocol.
The following table describes the protocol-specific parameters for the SNMPv3 protocol:
|
Parameter |
Description |
|---|---|
|
Protocol Configuration |
SNMPv3 |
|
Log Source Identifier |
Type a unique name for the log source. |
|
Authentication Protocol |
The algorithm that you want to use to authenticate SNMP3 traps:
|
|
Authentication Password |
The password to authenticate SNMPv3. Your authentication password must include a minimum of 8 characters. |
|
Decryption Protocol |
Select the algorithm that you want to use to decrypt the SNMPv3 traps.
Note:
If you select AES192 or AES256 as your decryption algorithm, you must install the Java Cryptography Extension. For more information about installing the Java Cryptography Extension on McAfee ePolicy Orchestrator, see Installing the Java Cryptography Extension on JSA. |
|
Decryption Password |
The password to decrypt SNMPv3 traps. Your decryption password must include a minimum of 8 characters. |
|
User |
The user name that was used to configure SNMPv3 on your appliance. |
|
Include OIDs in Event Payload |
Specifies that the SNMP event payload is constructed by using name-value pairs instead of the standard event payload format. When you select specific log sources from the Log Source Types list, OIDs in the event payload are required for processing SNMPv2 or SNMPv3 events. Note:
You must include OIDs in the event payload for processing SNMPv3 events for McAfee ePolicy Orchestrator. |
Seculert Protection REST API Protocol Configuration Options
To receive events from Seculert, configure a log source to use the Seculert Protection REST API protocol.
The Seculert Protection REST API protocol is an outbound/active protocol. Seculert Protection provides alerts on confirmed incidents of malware that are actively communicating or exfiltrating information.
Before you can configure a log source for Seculert, you must obtain your API key from the Seculert web portal.
-
Log in to the Seculert web portal.
-
On the dashboard, click the API tab.
-
Copy the value for Your API Key.
The following table describes the protocol-specific parameters for the Seculert Protection REST API protocol:
|
Parameter |
Description |
|---|---|
|
Log Source Type |
Seculert |
|
Protocol Configuration |
Seculert Protection REST API |
|
Log Source Identifier |
Type the IP address or host name for the log source as an identifier for events from Seculert. Each additional log source that you create when you have multiple installations ideally includes a unique identifier, such as an IP address or host name. |
|
API Key |
The API key that is used for authenticating with the Seculert Protection REST API. The API key value is obtained from the Seculert web portal. |
|
Use Proxy |
When you configure a proxy, all traffic for the log source travels through the proxy for JSA to access the Seculert Protection REST API. Configure the Proxy IP or Hostname, Proxy Port, Proxy Username, and Proxy Password fields. If the proxy does not require authentication, you can leave the Proxy Username and Proxy Password fields blank. |
|
Automatically Acquire Server Certificate(s) |
If you select Yes form the list, JSA downloads the certificate and begins trusting the target server. |
|
Recurrence |
Specify when the log collects data. The format is M/H/D for Minutes/Hours/Days. The default is 1 M. |
|
EPS Throttle |
The upper limit for the maximum number of events per second (eps) for events that are received from the API. |
|
Enabled |
Select this check box to enable the log source. By default, the check box is selected. |
|
Credibility |
Select the Credibility of the log source. The range is 0 - 10. The credibility indicates the integrity of an event or offense as determined by the credibility rating from the source devices. Credibility increases if multiple sources report the same event. The default is 5. |
|
Target Event Collector |
Select the Target Event Collector to use as the target for the log source. |
|
Coalescing Events |
Select this check box to enable the log source to coalesce (bundle) events. By default, automatically discovered log sources inherit the value of the Coalescing Events list from the System Settings in JSA. When you create a log source or edit an existing configuration, you can override the default value by configuring this option for each log source. |
|
Store Event Payload |
Select this check box to enable the log source to store event payload information. By default, automatically discovered log sources inherit the value of the Store Event Payload list from the System Settings in JSA. When you create a log source or edit an existing configuration, you can override the default value by configuring this option for each log source. |
Sophos Enterprise Console JDBC Protocol Configuration Options
To receive events from Sophos Enterprise Consoles, configure a log source to use the Sophos Enterprise Console JDBC protocol.
The Sophos Enterprise Console JDBC protocol is an outbound/active protocol that combines payload information from application control logs, device control logs, data control logs, tamper protection logs, and firewall logs in the vEventsCommonData table. If the Sophos Enterprise Console does not have the Sophos Reporting Interface, you can use the standard JDBC protocol to collect antivirus events.
The following table describes the parameters for the Sophos Enterprise Console JDBC protocol:
|
Parameter |
Description |
|---|---|
|
Protocol Configuration |
Sophos Enterprise Console JDBC |
|
Log Source Identifier |
Type a name for the log source. The name can't contain spaces and must be unique among all log sources of the log source type that is configured to use the JDBC protocol. If the log source collects events from a single appliance that has a static IP address or host name, use the IP address or host name of the appliance as all or part of the Log Source Identifier value; for example, 192.168.1.1 or JDBC192.168.1.1. If the log source doesn't collect events from a single appliance that has a static IP address or host name, you can use any unique name for the Log Source Identifier value; for example, JDBC1, JDBC2. |
|
Database Type |
MSDE |
|
Database Name |
The database name must match the database name that is specified in the Log Source Identifier field. |
|
Port |
The default port for MSDE in Sophos Enterprise Console is 1168. The JDBC configuration port must match the listener port of the Sophos database to communicate with JSA. The Sophos database must have incoming TCP connections enabled. If a Database Instance is used with the MSDE database type, you must leave the Port parameter blank. |
|
Authentication Domain |
If your network does not use a domain, leave this field blank. |
|
Database Instance |
The database instance, if required. MSDE databases can include multiple SQL server instances on one server. When a non-standard port is used for the database or administrators block access to port 1434 for SQL database resolution, the Database Instance parameter must be blank. |
|
Table Name |
vEventsCommonData |
|
Select List |
* |
|
Compare Field |
InsertedAt |
|
Use Prepared Statements |
Prepared statements enable the protocol source to set up the SQL statement, and then run the SQL statement numerous times with different parameters. For security and performance reasons, most configurations can use prepared statements. Clear this check box to use an alternative method of querying that do not use pre-compiled statements. |
|
Start Date and Time |
Optional. A start date and time for when the protocol can start to poll the database. If a start time is not defined, the protocol attempts to poll for events after the log source configuration is saved and deployed. |
|
Polling Interval |
The polling interval, which is the amount of time between queries to the database. You can define a longer polling interval by appending H for hours or M for minutes to the numeric value. The maximum polling interval is 1 week in any time format. Numeric values without an H or M designator poll in seconds. |
|
EPS Throttle |
The number of Events Per Second (EPS) that you do not want this protocol to exceed. |
|
Use Named Pipe Communication |
If MSDE is configured as the database type, administrators can select this check box to use an alternative method to a TCP/IP port connection. Named pipe connections for MSDE databases require the user name and password field to use a Windows authentication username and password and not the database user name and password. The log source configuration must use the default named pipe on the MSDE database. |
|
Database Cluster Name |
If you use your SQL server in a cluster environment, define the cluster name to ensure that named pipe communications function properly. |
|
Use NTLMv2 |
Forces MSDE connections to use the NTLMv2 protocol with SQL servers that require NTLMv2 authentication. The default value of the check box is selected. The Use NTLMv2 check box does not interrupt communications for MSDE connections that do not require NTLMv2 authentication. |
Sourcefire Defense Center EStreamer Protocol Options
Sourcefire Defense Center eStreamer protocol is now known as Cisco Firepower eStreamer protocol.
Syslog Redirect Protocol Overview
The Syslog Redirect protocol is an inbound/passive protocol that is used as an alternative to the Syslog protocol. Use this protocol when you want JSA to identify the specific device name that sent the events. JSA can passively listen for Syslog events by using TCP or UDP on any unused port that you specify..
The following table describes the protocol-specific parameters for the Syslog Redirect protocol:
|
Parameter |
Description |
|---|---|
|
Protocol Configuration |
Syslog Redirect |
|
Log Source Identifier Regex |
Enter a regex to parse the Log Source Identifier from the payload. |
|
Log Source Identifier |
Enter a Log Source Identifier to use as a default. If the Log Source Identifier Regex cannot parse the Log Source Identifier from a particular payload by using the regex that is provided, the default is used. |
|
Log Source Identifier Regex Format String |
Format string to combine capture groups from the Log Source Identifier Regex. For example:
The resulting string is used as the new log source identifier. |
|
Perform DNS Lookup On Regex Match |
Select the Perform DNS Lookup On Regex Match, check box to enable DNS functionality, which is based on the Log Source Identifier Regex and parameter value. By default, the check box is not selected. |
|
Listen Port |
Enter any unused port and set your log source to send events to JSA on that port. |
|
Protocol |
From the list, select either TCP or UDP. The Syslog Redirect protocol supports any number of UDP syslog connections, but restricts TCP connections to 2500. If the syslog stream has more than 2500 log sources, you must enter a second log source and listen port number. |
|
Enabled |
Select this check box to enable the log source. By default, the check box is selected. |
|
Credibility |
From the list, select the Credibility of the log source. The range is 0 - 10. The credibility indicates the integrity of an event or offense as determined by the credibility rating from the source devices. Credibility increases if multiple sources report the same event. The default is 5. |
|
Target Event Collector |
From the list, select the Target Event Collector to use as the target for the log source. |
|
Coalescing Events |
Select the Coalescing Events check box to enable the log source to coalesce (bundle) events. By default, automatically discovered log sources inherit the value of the Coalescing Events list from the System Settings in JSA. When you create a log source or edit an existing configuration, you can override the default value by configuring this option for each log source. |
|
Incoming Event Payload |
From the Incoming Event Payload list, select the incoming payload encoder for parsing and storing the logs. |
|
Store Event Payload |
Select the Store Event Payload check box to enable the log source to store event payload information. By default, automatically discovered log sources inherit the value of the Store Event Payload list from the System Settings in JSA. When you create a log source or edit an existing configuration, you can override the default value by configuring this option for each log source. |
TCP Multiline Syslog Protocol Configuration Options
You can configure a log source that uses the TCP multiline syslog protocol. The TCP multiline syslog protocol is an inbound/passive protocol that uses regular expressions to identify the start and end pattern of multiline events.
The following example is a multiline event:
06/13/2012 08:15:15 PM
LogName=Security
SourceName=Microsoft Windows security auditing.
EventCode=5156
EventType=0
TaskCategory=Filtering Platform Connection
Keywords=Audit Success
Message=The Windows Filtering Platform permitted a connection.
Process ID: 4
Application Name: System
Direction: Inbound
Source Address: 10.1.1.1
Source Port: 80
Destination Address: 10.1.1.12
Destination Port:444
The following table describes the protocol-specific parameters for the TCP multiline syslog protocol:
|
Parameter |
Description |
|---|---|
|
Protocol Configuration |
TCP Multiline Syslog |
|
Log Source Identifier |
Type an IP address or host name to identify the log source. To use a name instead, select Use Custom Source Name and fill in the Source Name Regex and Source Name Formatting String parameters. Note:
These parameters are only available if Show Advanced Options is set to Yes. |
|
Listen Port |
The default port is 12468. |
|
Aggregation Method |
The default is Start/End Matching. Use ID-Linked if you want to combine multiline events that are joined by a common identifier. |
|
Event Start Pattern |
This parameter is available when you set the Aggregation Method parameter to Start/End Matching. The regular expression (regex) that is required to identify the start of a TCP multiline event payload. Syslog headers typically begin with a date or time stamp. The protocol can create a single-line event that is based on solely on an event start pattern, such as a time stamp. When only a start pattern is available, the protocol captures all the information between each start value to create a valid event. |
|
Event End Pattern |
This parameter is available when you set the Aggregation Method parameter to Start/End Matching. This regular expression (regex) that is required to identify the end of a TCP multiline event payload. If the syslog event ends with the same value, you can use a regular expression to determine the end of an event. The protocol can capture events that are based on solely on an event end pattern. When only an end pattern is available, the protocol captures all the information between each end value to create a valid event. |
|
Message ID Pattern |
This parameter is available when you set the Aggregation Method parameter to ID-Linked. This regular expression (regex) required to filter the event payload messages. The TCP multiline event messages must contain a common identifying value that repeats on each line of the event message. |
|
Event Formatter |
Use the Windows Multiline option for multiline events that are formatted specifically for Windows. |
|
Show Advanced Options |
The default is No. Select Yes if you want to customize the event data. |
|
Use Custom Source Name |
This parameter is available when you set Show Advanced Options to Yes. Select the check box if you want to customize the source name with regex. |
|
Source Name Regex |
This parameter is available when you check Use Custom Source Name. The regular expression (regex) that captures one or more values from event payloads that are handled by this protocol. These values are used along with the Source Name Formatting String parameter to set a source or origin value for each event. This source value is used to route the event to a log source with a matching Log Source Identifier value. |
|
Source Name Formatting String |
This parameter is available when you check Use Custom Source Name. You can use a combination of one or more of the following inputs to form a source value for event payloads that are processed by this protocol:
|
|
Use as a Gateway Log Source |
This parameter is available when you set Show Advanced Options to Yes. When selected, events that flow through the log source can be routed to other log sources, based on the source name tagged on the events. When this option is not selected and Use Custom Source Name is not checked, incoming events are tagged with a source name that corresponds to the Log Source Identifier parameter. |
|
Flatten Multiline Events into Single Line |
This parameter is available when you set Show Advanced Options to Yes. Shows an event in one single line or multiple lines. |
|
Retain Entire Lines during Event Aggregation |
This parameter is available when you set Show Advanced Options to Yes. If you set the Aggregation Method parameter to ID-Linked, you can enable Retain Entire Lines during Event Aggregation to either discard or keep the part of the events that comes before Message ID Pattern when concatenating events with the same ID pattern together. |
|
Time Limit |
The number of seconds to wait for additional matching payloads before the event is pushed into the event pipeline. The default is 10 seconds. |
|
Enabled |
Select this check box to enable the log source. |
|
Credibility |
Select the credibility of the log source. The range is 0 - 10. The credibility indicates the integrity of an event or offense as determined by the credibility rating from the source devices. Credibility increases if multiple sources report the same event. The default is 5. |
|
Target Event Collector |
Select the Event Collector in your deployment that should host the TCP Multiline Syslog listener. |
|
Coalescing Events |
Select this check box to enable the log source to coalesce (bundle) events. By default, automatically discovered log sources inherit the value of the Coalescing Events list from the System Settings in JSA. When you create a log source or edit an existing configuration, you can override the default value by configuring this option for each log source. |
|
Store Event Payload |
Select this check box to enable the log source to store event payload information. By default, automatically discovered log sources inherit the value of the Store Event Payload list from the System Settings in JSA. When you create a log source or edit an existing configuration, you can override the default value by configuring this option for each log source. |
TCP Multiline Syslog Protocol Configuration Use Cases
To set the TCP Multiline Syslog listener log source to collect all events that are sent from the same system, follow these steps:
-
Leave Use As A Gateway Log Source and Use Custom Source Name cleared.
-
Enter the IP address of the system that is sending events in the Log Source Identifier parameter.
Figure 1: A JSA Log Source Collects Events Sent from a Single System to a TCP Multiline Syslog Listener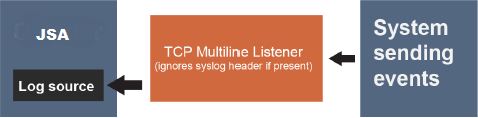
If multiple systems are sending events to the TCP Multiline Syslog listener, or if one intermediary system is forwarding events from multiple systems and you want the events to be routed to separate log sources based on their syslog header or IP address, check the Use As A Gateway Log Source check box.
Note:JSA checks each event for an RFC3164 or RFC5424-compliant syslog header, and if present, uses the IP/hostname from that header as the source value for the event. The event is routed to a log source with that same IP or host name as its Log Source Identifier. If no such header is present, JSA uses the source IP value from the network packet that the event arrived on as the source value for the event.
Figure 2: Separate JSA Log Sources Collect Events Sent from Multiple Systems to a TCP Multiline Listener, by Using the Syslog Header.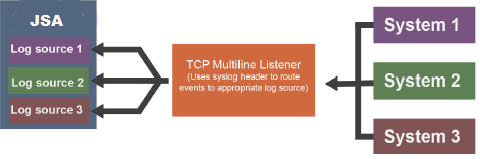 Figure 3: Separate JSA Log Sources Collect Events Sent from Multiple Systems and Forwarded Via an Intermediate System to a TCP Multiline Listener, by Using the Syslog Header.
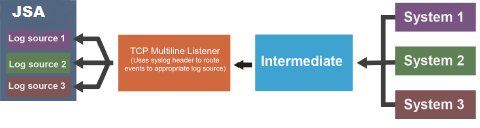
To route events to separate log sources based on a value other than the IP or host name in their syslog header, follow these steps:
-
Check the Use Custom Source Name check box.
-
Configure a Source Name Regex and Source Name Formatting String to customize how JSA sets a source name value for routing the received events to log sources.
Figure 4: Separate JSA Log Sources Collect Events Sent from Multiple Systems and Forwarded Via an Intermediate System to a TCP Multiline Listener, by Using the Source Name Regex and Source Name Formatting String.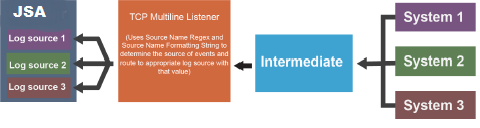
TLS Syslog Protocol Configuration Options
Configure a TLS Syslog protocol log source to receive encrypted syslog events from up to 50 network devices that support TLS Syslog event forwarding for each listener port.
The TLS Syslog protocol is an inbound/passive protocol. The log source creates a listen port for incoming TLS Syslog events. By default, TLS Syslog log sources use the certificate and key that is generated by JSA. Up to 50 network appliances can forward events to the log source's listen port. If you create more log sources with unique listen ports, you can configure up to 1000 network appliances.
The following table describes the protocol-specific parameters for the TLS Syslog protocol:
|
Parameter |
Description |
|---|---|
|
Protocol Configuration |
TLS Syslog |
|
Log Source Identifier |
An IP address or hostname to identify the log source. |
|
TLS Listen Port |
The default TLS listen port is 6514. |
|
Authentication Mode |
The mode your TLS connection uses to authenticate. If you select the TLS and Client Authentication option, you must configure the certificate parameters. |
|
Client Certificate Authentication |
Select one of the following options from the list:
|
|
Use CN Allowlist |
Enable this parameter to use a CN allowlist. |
|
CN Allowlist |
The allowlist of trusted client certificate common names. You can enter plain text or a regular expression (regex). To define multiple entries, enter each one on a separate line. |
|
Use Issuer Verification |
Enable this parameter to use issuer verification. |
|
Root/Intermediate Issuer's Certificate or Public key |
Enter the Root/Intermediate issuer's certificate or public key in PEM format.
|
|
Check Certificate Revocation |
Checks the certificate revocation status against the client certificate. This option requires network connectivity to the URL that is specified by the CRL Distribution Points field for the client certificate in the X509v3 extension. |
|
Check Certificate Usage |
Checks the contents of the certificate X509v3 extensions in the Key Usage and Extended Key Usage extension fields. For incoming client certificate, the allow values of X509v3 Key Usage are digitalSignature and keyAgreement. The allow value for X509v3 Extended Key Usage is TLS Web Client Authentication. This property is disabled by default. |
|
Client Certificate Path |
The absolute path to the client-certificate on disk. The certificate must be stored on the JSA Console or Event Collector for this log source. Note:
Ensure that the certificate file that you enter begins with: -----BEGIN CERTIFICATE----- and ends with: -----END CERTIFICATE----- |
|
Server Certificate Type |
The type of certificate to use for authentication for the server certificate and server key. Select one of the following options from the Server Certificate Type list:
|
|
Generated Certificate |
This option is available when you configure the Certificate Type. If you want to use the default certificate and key that is generated by JSA for the server certificate and server key, select this option. The generated certificate is named syslog-tls.cert in the /opt/ qradar/conf/trusted_certificates/ directory on the target Event Collector that the log source is assigned to. |
|
Single Certificate and Private Key |
This option is available when you configure the Certificate Type. If you want to use a single PEM certificate for the server certificate, select this option and then configure the following parameters:
Note:
The corresponding private key must be a DER-encoded PKCS8 key. The configuration fails with any other key format |
|
PKCS12 Certificate and Password |
This option is available when you configure the Certificate Type. If you want to use a PKCS12 file that contains the server certificate and server key, select this option and then configure the following parameters:
|
|
Choose from JSA Certificate Store |
This option is available when you configure the Certificate Type. You can use the Certificate Management app to upload a certificate from the JSA Certificate Store. The app is supported on JSA 7.3.3 Fix Pack 6 or later, and JSA 7.4.2 or later. |
|
Max Payload Length |
The maximum payload length (characters) that is displayed for TLS Syslog message. |
|
Maximum Connections |
The Maximum Connections parameter controls how many simultaneous connections the TLS Syslog protocol can accept for each Event Collector. For each Event Collector, there is a limit of 1000 connections, including enabled and disabled log sources, in the TLS Syslog log source configuration. Tip:
Automatically discovered log sources share a listener with another log source. For example, if you use the same port on the same event collector, it counts only one time toward the limit. |
|
TLS Protocols |
The TLS Protocol to be used by the log source. Select the "TLS 1.2 or later" option. |
|
Use As A Gateway Log Source |
Sends collected events through the JSA Traffic Analysis Engine to automatically detect the appropriate log source. If you do not want to define a custom log source identifier for events, clear the checkbox. When this option is not selected and Log Source Identifier Pattern is not configured, JSA receives events as unknown generic log sources. |
|
Log Source Identifier Pattern |
Use the Use As A Gateway Log Source option to define a custom log source identifier for events that are being processed and for log sources to be automatically discovered when applicable. If you don't configure the Log Source Identifier Pattern, JSA receives events as unknown generic log sources. Use key-value pairs to define the custom Log Source Identifier. The key is the Identifier Format String, which is the resulting source or origin value. The value is the associated regex pattern that is used to evaluate the current payload. This value also supports capture groups that can be used to further customize the key. Define multiple key-value pairs by typing each pattern on a new line. Multiple patterns are evaluated in the order that they are listed. When a match is found, a custom Log Source Identifier is displayed. The following examples show multiple key-value pair functions.
|
|
Enable Multiline |
Aggregate multiple messages into single events based on a Start/End Matching or an ID-Linked regular expression. |
|
Aggregation Method |
This parameter is available when Enable Multiline is turned on.
|
|
Event Start Pattern |
This parameter is available when Enable Multiline is turned on and the Aggregation Method is set to Start/End Matching. The regular expression (regex) is required to identify the start of a TCP multiline event payload. Syslog headers typically begin with a date or timestamp. The protocol can create a single-line event that is based on solely on an event start pattern, such as a timestamp. When only a start pattern is available, the protocol captures all the information between each start value to create a valid event. |
|
Event End Pattern |
This parameter is available when Enable Multiline is turned on and the Aggregation Method is set to Start/End Matching. This regular expression (regex) is required to identify the end of a TCP multiline event payload. If the syslog event ends with the same value, you can use a regular expression to determine the end of an event. The protocol can capture events that are based on solely on an event end pattern. When only an end pattern is available, the protocol captures all the information between each end value to create a valid event. |
|
Message ID Pattern |
This parameter is available when Enable Multiline is turned on and the Aggregation Method is set to ID-Linked. This regular expression (regex) required to filter the event payload messages. The TCP multiline event messages must contain a common identifying value that repeats on each line of the event message. |
|
Time Limit |
This parameter is available when Enable Multiline is turned on and the Aggregation Method is set to ID-Linked. The number of seconds to wait for more matching payloads before the event is pushed into the event pipeline. The default is 10 seconds. |
|
Retain Entire Lines during Event Aggregation |
This parameter is available when Enable Multiline is turned on and the Aggregation Method is set to ID-Linked. If you set the Aggregation Method parameter to ID-Linked, you can enable Retain Entire Lines during Event Aggregation to discard or keep the part of the events that precedes Message ID Pattern. You can enable this function only when concatenating events with the same ID pattern together. |
|
Flatten Multiline Events Into Single Line |
This parameter is available when Enable Multiline is turned on. Shows an event in one single line or multiple lines. |
|
Event Formatter |
This parameter is available when Enable Multiline is turned on. Use the Windows Multiline option for multiline events that are formatted specifically for Windows. |
After the log source is saved, a syslog-tls certificate is created for the log source. The certificate must be copied to any device on your network that is configured to forward encrypted syslog. Other network devices that have a syslog-tls certificate file and the TLS listen port number can be automatically discovered as a TLS Syslog log source.
TLS Syslog Use Cases
The following use cases represent possible configurations that you can create:
-
Client Certificate on Disk--You can supply a client-certificate that enables the protocol to engage in client-authentication. If you select this option and provide the certificate, incoming connections are validated against the client-certificate.
-
CN Allowlist and Issuer Verification–
If you selected this option, you must copy the issuer certificate (with the .crt, .cert, or .der file extensions) to the following directory:
/opt/qradar/conf/trusted_certificates
This directory is on the Target Event Collector that the log source is assigned to.
Any incoming client certificate is verified by the following methods to check whether the certificate was signed by the trusted issuer and other checks. You can choose one or both methods for client certificate authentication:
-
CN Allowlist--Provide an allowlist of trusted client certificate common names. You can enter plain text or a regular expression. Define multiple entries by entering each on a new line.
-
Issuer Verification--Provide a trusted client certificate's root or intermediate issuer certificate, or a public key in PEM format.
-
Check Certificate Revocation--Checks certificate revocation status against the client certificate. This option needs network connectivity to the URL that is specified by the CRL Distribution Points field in the client certificate for the X509v3 extension.
-
Check Certificate Usage--Checks the contents of the certificate X509v3 extensions in the Key Usage and Extended Key Usage extension fields. For incoming client certificate, the allow values of X509v3 Key Usage are digitalSignature and keyAgreement. The allow value for X509v3 Extended Key Usage is TLS Web Client Authentication.
-
-
User-provided Server Certificates--You can configure your own server certificate and corresponding private key. The configured TLS Syslog provider uses the certificate and key. Incoming connections are presented with the user-supplied certificate, rather than the automatically generated TLS Syslog certificate.
-
Default authentication--To use the default authentication method, use the default values for the Authentication Mode and Certificate Type parameters. After the log source is saved, a syslog-tls certificate is created for log source device. The certificate must be copied to any device on your network that forwards encrypted syslog data.
Multiple Log Sources Over TLS Syslog
You can configure multiple devices in your network to send encrypted syslog events to a single TLS Syslog listen port. The TLS Syslog listener acts as a gateway, decrypts the event data, and feeds it within JSA to extra log sources configured with the Syslog protocol.
When using the TLS Syslog protocol, there are specific parameters that you must use.
Multiple devices within your network that support TLS-encrypted syslog can send encrypted events via a TCP connection to the TLS Syslog listen port. These encrypted events are decrypted by the TLS syslog (gateway) and are injected into the event pipeline. The decrypted events get routed to the appropriate receiver log sources or to the traffic analysis engine for autodiscovery.
Events are routed within JSA to log sources with a Log Source Identifier value that matches the source value of an event. For syslog events with an RFC3164-, or RFC5425-, or RFC5424-compliant syslog header, the source value is the IP address or the host name from the header. For events that do not have a compliant header, the source value is the IP address from which the syslog event was sent.
On JSA, you can configure multiple log sources with Syslog protocol to receive encrypted events that are sent to a single TLS Syslog listen port from multiple devices.
Most TLS-enabled clients require the target server or listener's public certificate to authenticate the server's connection. By default, a TLS Syslog log source generates a certificate that is named syslog-tls.cert in /opt/qradar/conf/trusted_certificates/ on the target Event Collector that the log source is assigned to. This certificate file must be copied to all clients that is making a TLS connection.
To add a log source over TLS Syslog, go to Adding a Log Source.
You need to repeat the procedure for adding a log source for each device in your network. You can also add multiple receiver log sources in bulk from the Log Sources window. See Adding Bulk Log Sources.
UDP Multiline Syslog Protocol Configuration Options
To create a single-line syslog event from a multiline event, configure a log source to use the UDP multiline protocol. The UDP multiline syslog protocol uses a regular expression to identify and reassemble the multiline syslog messages into single event payload.
The UDP multiline syslog protocol is an inbound/passive protocol. The original multiline event must contain a value that repeats on each line in order for a regular expression to capture that value and identify and reassemble the individual syslog messages that make up the multiline event. For example, this multiline event contains a repeated value, 2467222, in the conn field. This field value is captured so that all syslog messages that contain conn=2467222 are combined into a single event.
15:08:56 10.1.1.1 slapd[517]: conn=2467222 op=2 SEARCH RESULT tag=101
15:08:56 10.1.1.1 slapd[517]: conn=2467222 op=2 SRCH base="dc=iso-n,dc=co"
15:08:56 10.1.1.1 slapd[517]: conn=2467222 op=2 SRCH attr=gidNumber
15:08:56 10.1.1.1 slapd[517]: conn=2467222 op=1 SRCH base="dc=iso-n,dc=com”
The following table describes the protocol-specific parameters for the UDP multiline syslog protocol:
|
Parameter |
Description |
|---|---|
|
Protocol Configuration |
UDP Multiline Syslog |
|
Listen Port |
The default port number that is used by JSA to accept incoming UDP Multiline Syslog events is 517. You can use a different port in the range 1 - 65535. To edit a saved configuration to use a new port number, complete the following steps:
The port update is complete and event collection starts on the new port number. |
|
Message ID Pattern |
The regular expression (regex) required to filter the event payload messages. The UDP multiline event messages must contain a common identifying value that repeats on each line of the event message. |
|
Event Formatter |
The event formatter that formats incoming payloads that are detected by the listener. Select No Formatting to leave the payload untouched. Select Cisco ACS Multiline to format the payload into a single-line event. In ACS syslog header, there are total_seg and seg_num fields. These two fields are used to rearrange ACS multiline events into a single-line event with correct order when you select the Cisco ACS Multiline option. |
|
Show Advanced Options |
The default is No. Select Yes if you want to configure advanced options. |
|
Use Custom Source Name |
Select the check box if you want to customize the source name with regex. |
|
Source Name Regex |
Use the Source Name Regex and Source Name Formatting String parameters if you want to customize how JSA determines the source of the events that are processed by this UDP Multiline Syslog configuration. For Source Name Regex, enter a regex to capture one or more identifying values from event payloads that are handled by this protocol. These values are used with the Source Name Formatting String to set a source or origin value for each event. This source value is used to route the event to a log source with a matching Log Source Identifier value when the Use As A Gateway Log Source option is enabled. |
|
Source Name Formatting String |
You can use a combination of one or more of the following inputs to form a source value for event payloads that are processed by this protocol:
For example, CiscoACS\1\2$PIP$, where \1\2 means first and second capture groups from the Source Name Regex value, and $PIP$ is the packet IP. |
|
Use As A Gateway Log Source |
If this check box is clear, incoming events are sent to the log source with the Log Source Identifier matching the IP that they originated from. When checked, this log source serves as a single entry point or gateway for multiline events from many sources to enter JSA and be processed in the same way, without the need to configure a UDP Multiline Syslog log source for each source. Events with an RFC3164- or RFC5424-compliant syslog header are identified as originating from the IP or host name in their header, unless the Source Name Formatting String parameter is in use, in which case that format string is evaluated for each event. Any such events are routed through JSA based on this captured value. If one or more log sources exist with a corresponding Log Source Identifier, they are given the event based on configured Parsing Order. If they do not accept the event, or if no log sources exist with a matching Log Source Identifier, the events are analyzed for autodetection. |
|
Flatten Multiline Events Into Single Line |
Shows an event in one single line or multiple lines. If this check box is selected, all newline and carriage return characters are removed from the event. |
|
Retain Entire Lines During Event Aggregation |
Choose this option to either discard or keep the part of the events that comes before Message ID Pattern when the protocol concatenates events with same ID pattern together. |
|
Time Limit |
The number of seconds to wait for additional matching payloads before the event is pushed into the event pipeline. The default is 10 seconds. |
|
Enabled |
Select this check box to enable the log source. |
|
Credibility |
Select the credibility of the log source. The range is 0 - 10. The credibility indicates the integrity of an event or offense as determined by the credibility rating from the source devices. Credibility increases if multiple sources report the same event. The default is 5. |
|
Target Event Collector |
Select the Event Collector in your deployment that should host the UDP Multiline Syslog listener. |
|
Coalescing Events |
Select this check box to enable the log source to coalesce (bundle) events. By default, automatically discovered log sources inherit the value of the Coalescing Events list from the System Settings in JSA. When you create a log source or edit an existing configuration, you can override the default value by configuring this option for each log source. |
|
Store Event Payload |
Select this check box to enable the log source to store event payload information. By default, automatically discovered log sources inherit the value of the Store Event Payload list from the System Settings in JSA. When you create a log source or edit an existing configuration, you can override the default value by configuring this option for each log source. |
VMware vCloud Director Protocol Configuration Options
To collect events from VMware vCloud Director virtual environments, create a log source that uses the VMware vCloud Director protocol, which is an outbound/active protocol.
The following table describes the protocol-specific parameters for the VMware vCloud Director protocol:
|
Parameter |
Description |
|---|---|
|
Log Source Identifier |
The log source name can't include spaces and must be unique among all log sources of this type that are configured with the VMware vCloud Director protocol. |
|
Protocol Configuration |
VMware vCloud Director |
|
vCloud URL |
The URL that is configured on your VMware vCloud appliance to access the REST
API. The URL must match the address that is configured as the VCD
public REST API base URL field on the vCloud server. For example,
|
|
User Name |
The username that is required to remotely access the vCloud Server. For example, console/user@organization. If you want to configure a read-only account to use with JSA, create a vCloud user in your organization that has the Console Access Only permission. |
|
Password |
The password that is required to remotely access the vCloud Server. |
|
Polling Interval (in seconds) |
The amount of time between queries to the vCloud server for new events. The default polling interval is 10 seconds. |
|
EPS Throttle |
The maximum number of events per second (EPS). The default is 5000. |
|
Enable Advanced Options |
Enable this option to configure more parameters. |
|
API PageSize |
If you select Enable Advanced Options, this parameter is displayed. The number of records to return per API call. The maximum is 128. |
|
Enable Legacy vCloud SDK |
If you select Enable Advanced Options, this parameter is displayed. To connect to vCloud 5.1 or earlier, enable this option. |
|
vCloud API Version |
If you select Enable Advanced Options and then you select Enable Legacy vCloud SDK, this parameter no longer displays. The vCloud version that is used in your API request. This version must match a version that is compatible with your vCloud installation. Use the following examples to help you determine which version is compatible with your vCloud installation:
|
|
Allow Untrusted Certificates |
If you select Enable Advanced Options and then you select Enable Legacy vCloud SDK, this parameter no longer displays. When you connect to vCloud 5.1 or later, you must enable this option to allow self-signed, untrusted certificates. The certificate must be downloaded in PEM or DER encoded binary format and then
placed in the /opt/qradar/conf/ trusted_certificates/ directory
with a |
|
Use Proxy |
If you select Enable Advanced Options and then you select Enable Legacy vCloud SDK, this parameter no longer displays. If the server is accessed by using a proxy, select the Use Proxy checkbox. If the proxy requires authentication, configure the Proxy Server, Proxy Port, Proxy username, and Proxy Password fields. If the proxy does not require authentication, configure the Proxy IP or Hostname field. |
|
Proxy IP or Hostname |
If you select Use Proxy, this parameter is displayed. If you select Enable Advanced Options and then you select Enable Legacy vCloud SDK, this parameter no longer displays. |
|
Proxy Port |
If you select Use Proxy, this parameter is displayed. If you select Enable Advanced Options and then you select Enable Legacy vCloud SDK, this parameter no longer displays. The port number that is used to communicate with the proxy. The default is 8080. |
|
Proxy Username |
If you select Use Proxy, this parameter is displayed. If you select Enable Advanced Options and then you select Enable Legacy vCloud SDK, this parameter no longer displays. |
|
Proxy Password |
If you select Use Proxy, this parameter is displayed. If you select Enable Advanced Options and then you select Enable Legacy vCloud SDK, this parameter no longer displays. |