
アクセスと認証の検証
良好なユーザーエクスペリエンスを確保し、認証の問題を迅速に解決するには、接続されているクライアントデバイスと障害が発生したクライアントデバイスをチェックし、問題を特定し、根本的原因と推奨アクションについてMarvisからガイダンスを取得します。
接続されているクライアントデバイスを確認する
- インサイトダッシュボードに直接移動し、ジュニパー Mistポータルの左側のメニューから 監視>サービスレベル を選択します。次に、監視ページの上部にある インサイト ボタンをクリックします。
図1:Mistインサイトのページ
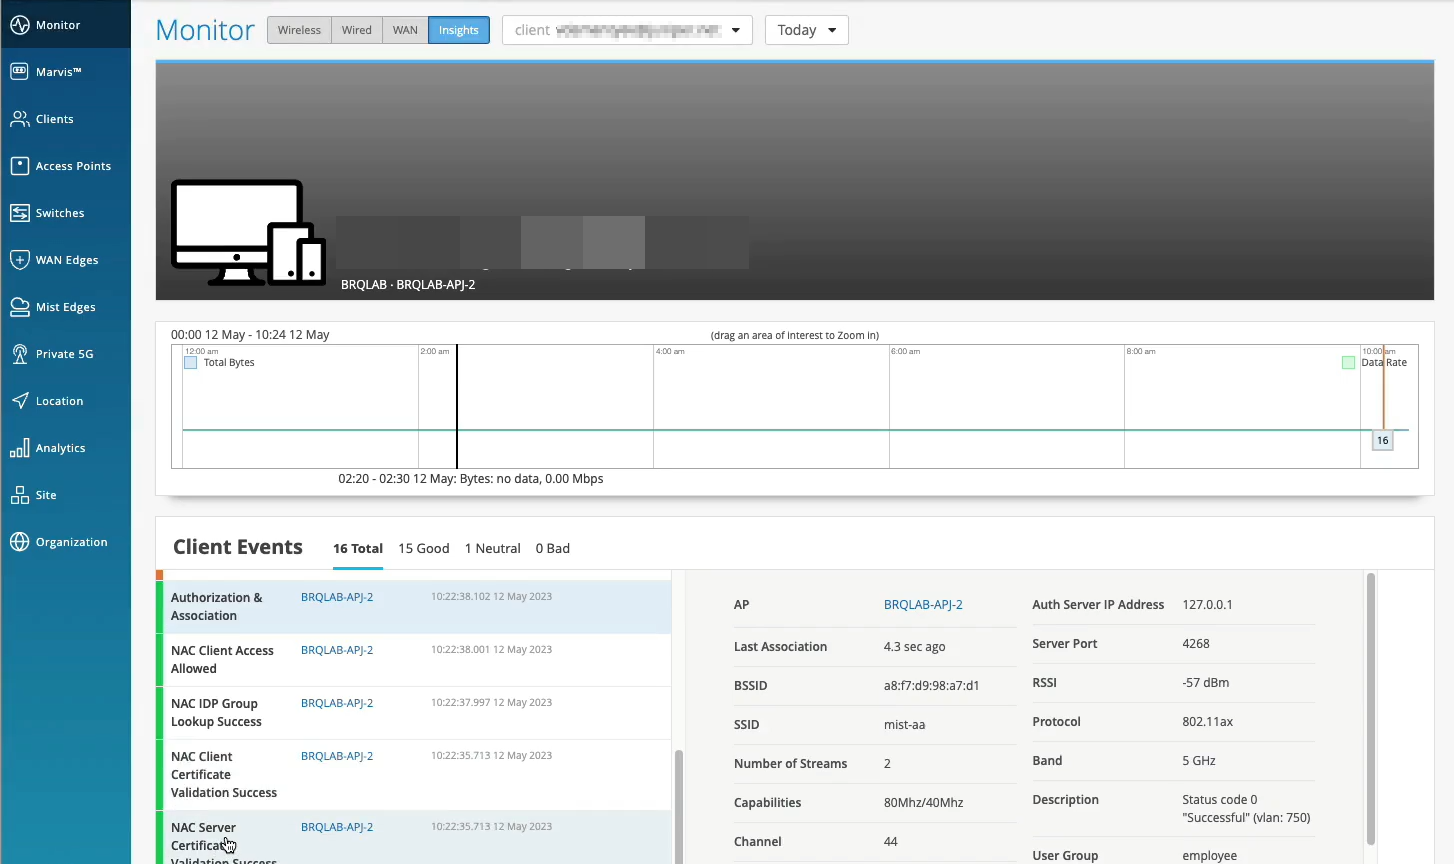 を表示
を表示
- クライアントイベントブロックには、選択した時間枠内に選択したサイトに対してMist PACEによって記録されたすべてのイベントのリストが表示されます。
図2:クライアントイベントの表示
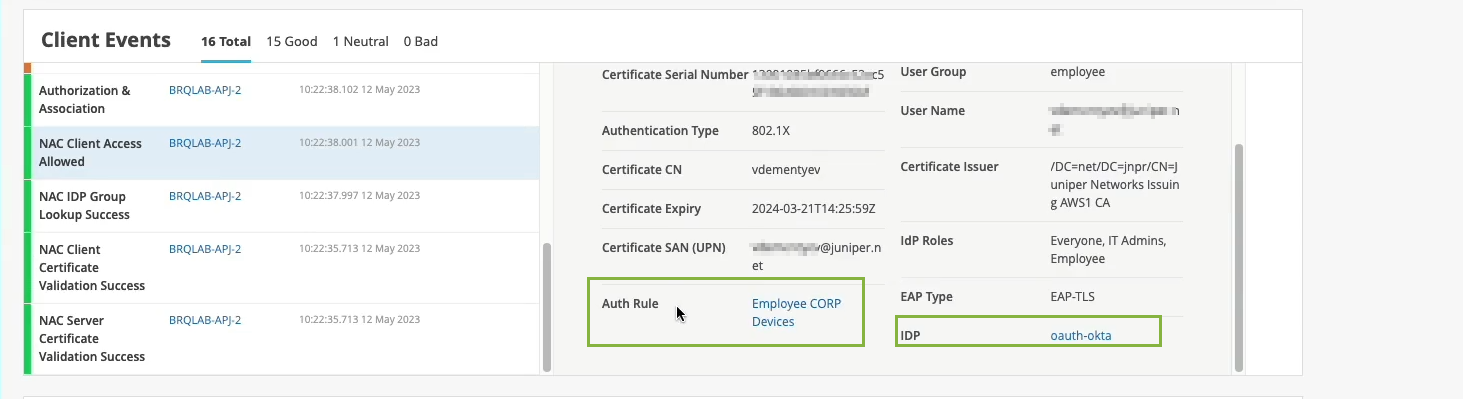
これらのイベントは、携帯電話やラップトップコンピューターなどの無線クライアントにのみ適用されます。リストからイベントを選択すると、Mistはリストの右側にイベントの概要を表示します。証明書の詳細、認証タイプ、VLAN、認証ルール、IDプロバイダ(IdP)などの詳細を確認できます。
- 認証ルールをクリックして、認証ポリシーページでルールを開きます。
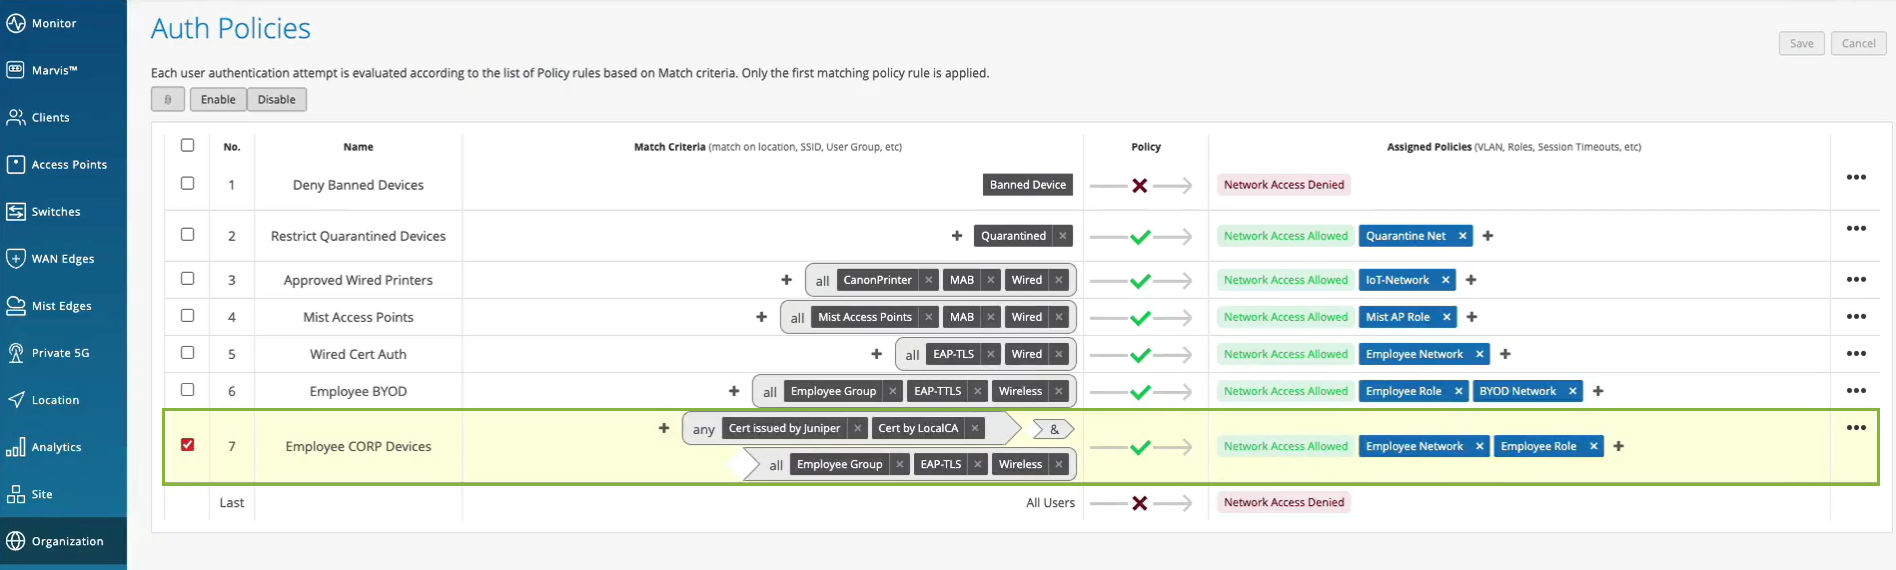
ポータルには、クライアントデバイスに適用されたポリシーが強調表示されます。一致基準、ポリシールール、ポリシーアクションなどの詳細を表示できます。
アクセスと認証設定の検証に関する次のビデオをご覧ください。
Clients are actually happy and connected and authorized and can actually pass traffic. So let's take a look at one of the clients here that I have as an example. So let's take a look at client insights. What we already see is the client is able to get network connectivity, grab an IP address. It can resolve DNS. We have this information as the client goes through that whole connection process from the network infrastructure, in this particular case from the access point.
But now, we are extending this visibility into the whole NAC authentication and authorization phases. So we know that, OK, client trusted the server cert. Then, actually, we see that it's using certific ate to authenticate. So our service, we're getting all the metadata about the client certificate. We then do an IDP lookup against Okta in our particular scenario. And we know, OK, so this user is actually part of these three groups in the Okta user directory. Great. What's next?
We are actually evaluating whether we should allow or deny this particular client, and what policy we want to assign. So we are saying, oh, client access is allowed, great. We are signing a VLAN. We're signing a role or a user group, employee. But we are also saying, oh, hey, this is the authentication rule that we've hit during the authorization process. So let's take a look. Let's click on it. Oh, voila. So we now can tell you exactly which policy rule triggered during that particular user authentication. So we are seeing not only the authentication experience. We are also seeing the whole end to end connection experience, all the way from the neck, all the way to the client actually being able to pass traffic left and right.
障害が発生したクライアントデバイスの確認
- Mistポータルジュニパー、ジュニパー Mistポータルの左側のメニューから監視 >サービスレベル を選択します。次に、監視ページの上部にある インサイト ボタンをクリックします。
図3:Mistインサイトページの表示
- クライアントイベントブロックには、選択した時間枠内に選択したサイトに対してMist PACEによって記録されたすべてのイベントのリストが表示されます。
図4:クライアントイベントの表示
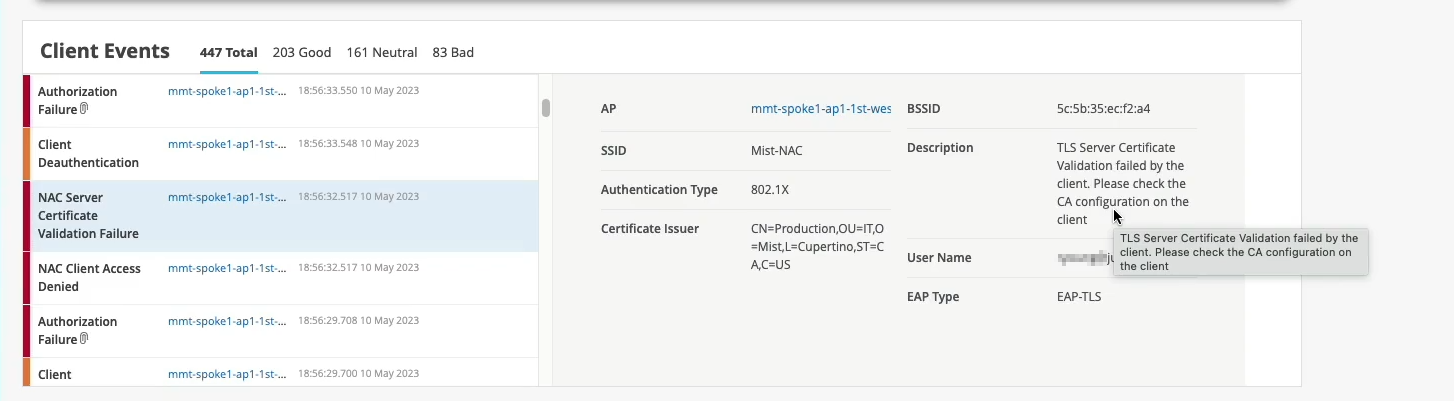
リストからイベントを選択すると、Mistはリストの右側にイベントの概要を表示します。概要を上下にスクロールして、すべての詳細を取得できます。アクセスに失敗した場合は、 説明 フィールドをチェックして失敗の理由を把握できます。
アクセスと認証設定の検証に関する次のビデオをご覧ください。
Normally, if we would only have the visibility from the network point of view, we would just say, OK, this client failed authorization. It's a .1X failure. But since we don't control the other side of the authentication process, we don't really know what's happening here.
But now, since we've extended this NAC authentication authorization visibility into the Mist cloud, we now can say exactly what happened. So if you look just at the event below, we are saying, oh, actually, the reason for the failure is because the client does not trust the server certificate, right?
So we are now - we now can tell exactly what is the authentication issue that the client has experienced. And this is caused by the client configuration issue that you need to look at. And again, we are providing all the details in here.
So now, we can pinpoint and answer the question, whether it's client config problem, whether it's a network issue and client cannot get network services, or it's an authentication policy issue and we've just configured our policies incorrectly.
認証の問題を特定するMarvis Actions
Marvis Actionsは、組織内のユーザーエクスペリエンスに影響を与えるサイト全体のネットワークに関する進行中の問題を可視化するワンストップの情報センターです。
組織で利用しているサブスクリプションのタイプによって、Marvis Actionsの使用状況が決まります。詳細については 、有線、WAN、無線アシュアランス向けMarvis Actions をご覧ください。
- ジュニパー Mistポータルで、ジュニパー Mistポータルの左側のメニューから[ Marvis™ ]を選択します。
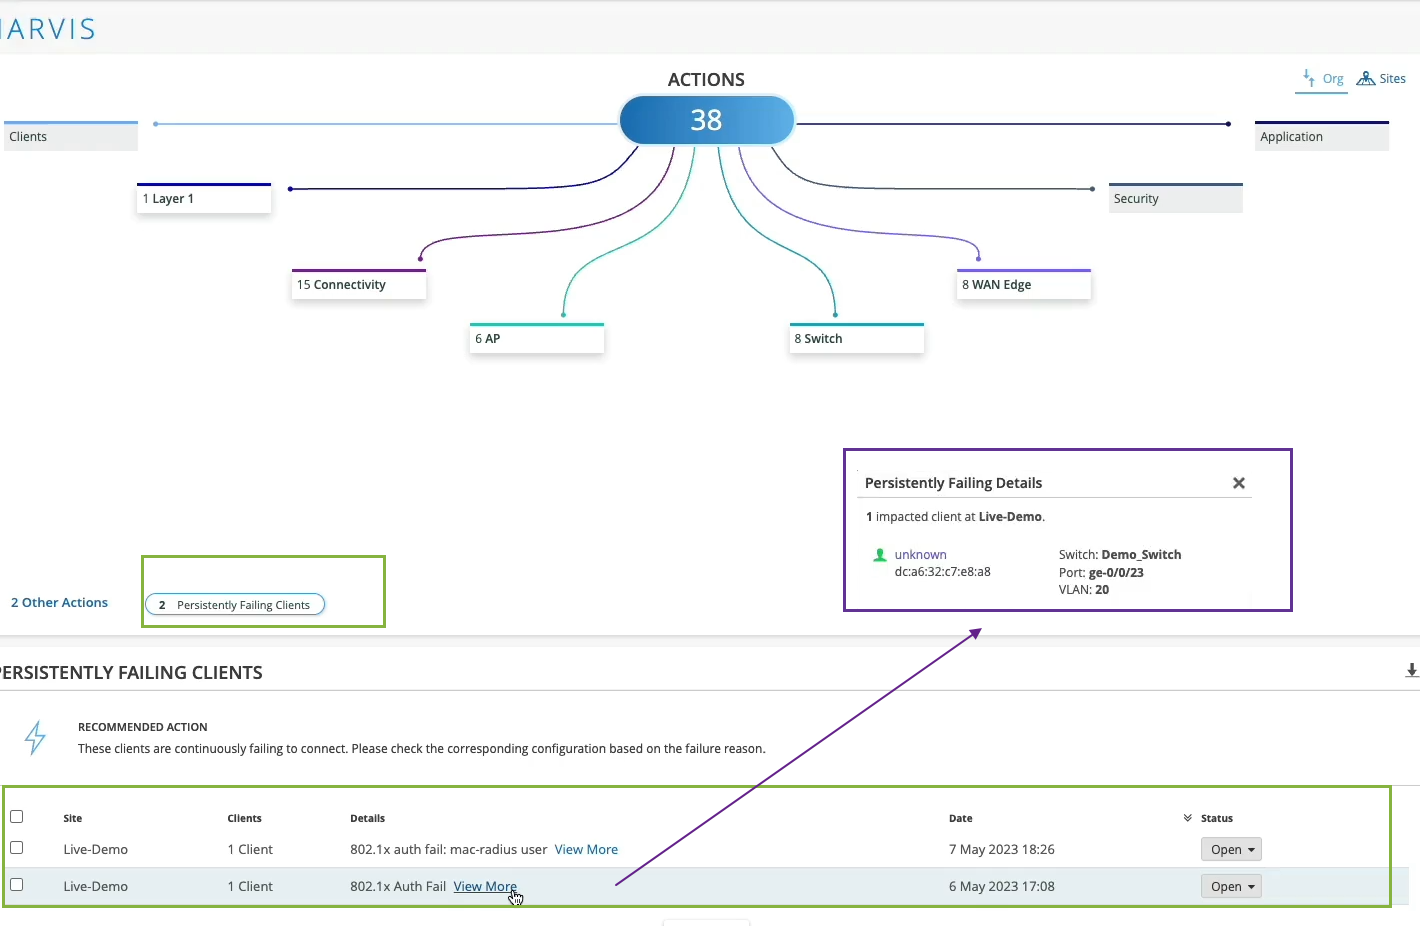
「永続的に障害が発生しているクライアント」アクションは、クライアント固有の問題のために継続的に接続に失敗する有線または無線クライアントを強調表示します。つまり、障害の範囲はアクセスポイント(AP)、スイッチ、無線LAN(WLAN)、サーバーではありません。障害の原因は、間違ったPSK(事前共有鍵)の入力による認証失敗、または誤った802.1x設定による障害です。Marvisは、障害が発生しているクライアントのリストと、接続しようとしているクライアントを表示します。
「 詳細を表示」 をクリックして、障害が発生したクライアントの詳細を取得します。この情報を使用して、接続されている特定のスイッチ、ポート、VLANを特定し、接続の問題が発生しているユーザーの場所を特定できます。
注:注:この問題を修正すると、[永続的に障害が発生しているクライアント]アクションは1時間以内に自動的に解決されます。このアクションは優先度が低いと見なされるため、Marvisは[最新アップデート]セクションまたは[サイト]タブに[永続的に失敗しているクライアント]アクションをリストしません。
- MARVISページでは、さまざまなカテゴリに情報が表示されていることがわかります。Marvisは、カテゴリで検出された問題の数を示します。たとえば、次のスクリーンショットでは、Marvisが接続カテゴリに15件の課題をリストしていることがわかります。
図5:Marvis Actionsページ
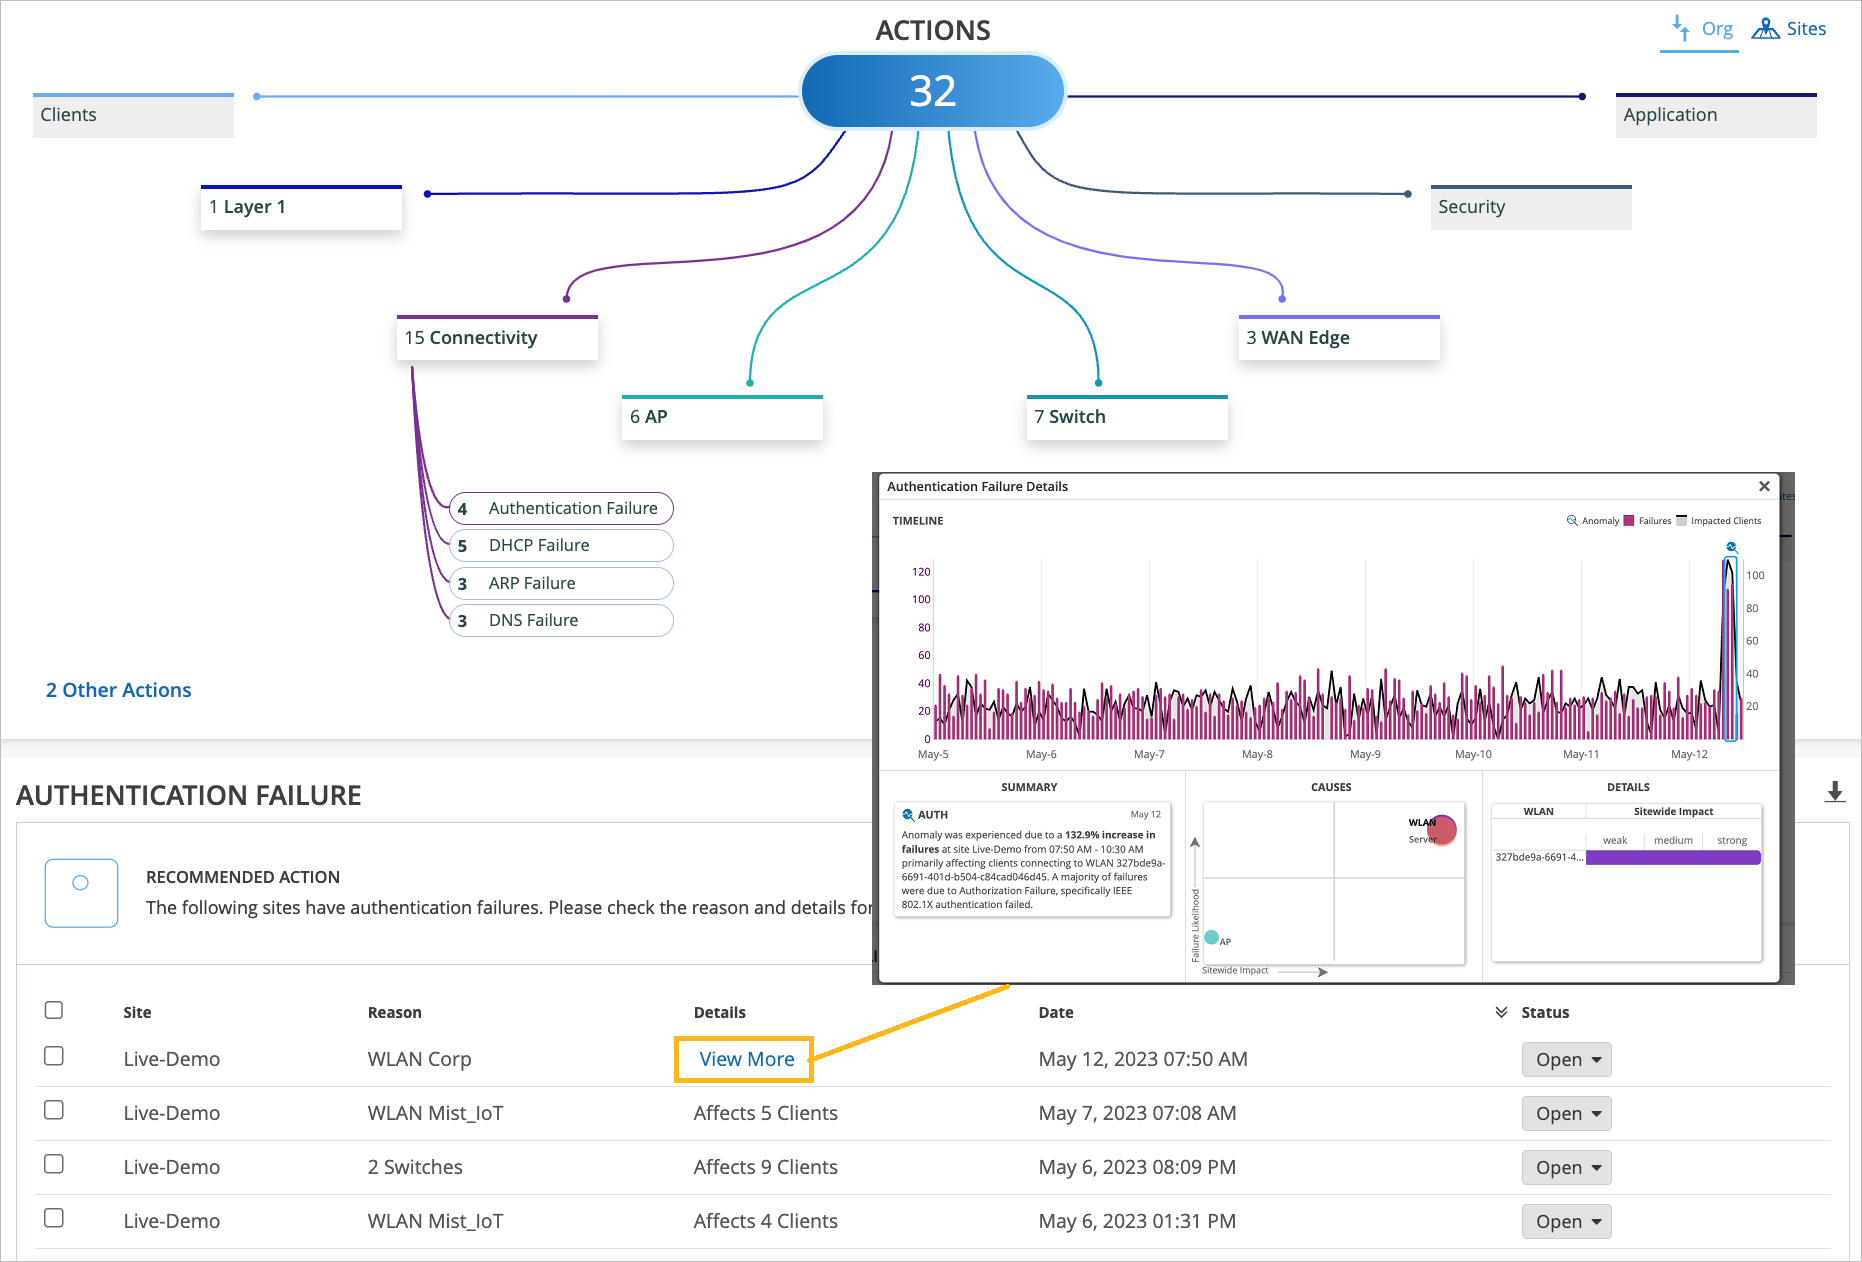 の接続エラー
「 詳細を表示」 をクリックして、障害が発生したクライアントの詳細を取得します。認証失敗の詳細ページには、問題、原因、詳細の概要が表示されます。スクリーンショットは、Marvis Actionsが802.1x認証失敗を報告する方法の例を示しています。
問題が認証または認可に関連していない場合は、上のレイヤーを見て、実際のネットワークサービス関連の問題があるかどうかを調査します。たとえば、ゲートウェイが応答しなかったり、IP アドレスが不足したりしている可能性があります。
アクセスと認証設定の検証に関するMarvisのアクションに関する次のビデオをご覧ください。
Maybe I don't even want to be reactive. Is there something that can tell me when there is an issue? Is there something that can look at my entire network and figure out if there is an issue that is widespread, maybe it's affecting a specific site, a specific group of access points or switches or anything like that? Well, yes, sure there is. That's why we have Marvis Actions.
In Marvis Actions, we can start slow and we could say, okay, maybe you have some offenders on the network that are consistently trying to connect and they're failing. So let's take a look at them. Let's see what we have there.
Oh, okay. So we have two clients that are failing .1x authentication persistently, consistently, right? And we are saying, okay, let's take a look and maybe at least we can pinpoint where those users are. Well, they are connected to this specific switch and this specific port and this VLAN.
Maybe you want to check and see what's plugged into there that is never able to connect for a long period of time. That's fine. Now, if we look at things at scale, if we look at things holistically, let's say at the whole organization, we can then pinpoint, oh, maybe you have authentication failures that are affecting a specific SSID or specific groups of APs or clients that are more widespread.
This is where we are actually learning what's going on on your network, what's normal, what's not. And whenever there is an anomaly, we would highlight this in the connectivity action in Marvis Action tab. Similarly, if it's not related to authentication or authorization, we can look the layer above and maybe there is an actual network service related issue, maybe your gateway is not responding, maybe you're run out of IP addresses.
The point is all of this information is looked at holistically, right? All the way starting from the NAC authentication authorization now, all the way to client being able to pass traffic and get network services up and running.